

Abstract
The authors estimated the generalized impact fraction (GIF) for heart failure (HF) related to obesity, representing the proportion of incident HF events that could be prevented from reductions in obesity and/or overweight. The Atherosclerosis Risk in Communities Study is a biracial population-based cohort study of persons aged 45–64 years from 4 US communities with a median 14 years of follow-up (1987–2003) for incident, hospitalized, or fatal HF. Body mass index (BMI; weight (kg)/height (m)2) was measured at baseline (1987–1989) and categorized as normal weight (BMI <25), overweight (BMI 25–29.9), or obese (BMI ≥30). After exclusion of prevalent HF, missing BMI, and poorly represented racial groups, the sample size was 14,642. The GIF and attributable fraction were calculated using a case-load weighted-sum method. A 95% distribution of the GIF was estimated from bootstrapped data sets. A 30% hypothetical reduction in obesity/overweight would potentially prevent 8.5% (95% simulation interval: 6.1, 10.7) of incident HF events. The attributable fraction, which assumes complete elimination of obesity/overweight, was 28% (95% simulation interval: 20, 36)—approximately 3 times larger than the most optimistic GIF calculated here. Investigators studying exposures that are unlikely to be eradicated given current prevention efforts, such as obesity, should consider estimating the GIF to avoid overestimates of population impact.
Keywords: epidemiologic methods, heart failure, obesity, population dynamics
Heart failure is common, with an estimated 5,300,000 American adults living with heart failure, and it is increasing in prevalence (1). Hospital discharges for heart failure in the United States have increased 171% since 1979, with 660,000 incident heart failure cases annually and nearly $35 billion in US health-care costs (1). Clearly the prevention of heart failure must be a priority. The American Heart Association recognizes obesity as a qualifying risk factor for stage A heart failure (2). The American Heart Association has released a specific scientific statement on heart failure prevention; it recommends maintenance of normal weight as one way to prevent heart failure (3). The impact of a population-level reduction in obesity on the potential prevention of heart failure has been assessed only in terms of the attributable fraction (AF), which estimates the proportional reduction in disease given complete elimination of an exposure (4, 5). For many exposures (including obesity and overweight), complete elimination is highly unlikely given our current methods for prevention (6). Despite this, the AF has been used extensively in the obesity literature, including recent studies estimating the burden of all-cause mortality attributable to overweight and obesity (7, 8).
Given that obesity is unlikely to be eliminated from society, as assumed in calculations of the AF, a more realistic and meaningful calculation for estimating the impact of weight reduction on disease incidence is the generalized impact fraction (GIF), also known as the potential impact fraction and the generalized AF (9, 10). It estimates the proportional reduction in disease incidence given a graded reduction in the prevalence of a risk factor; therefore, the AF is simply a special case of the GIF in which complete elimination of the risk factor is assumed. For common risk factors and diseases, the impact of a hypothetical reduction in the exposure may reveal an important effect on disease incidence even when risk factor-disease associations are relatively weak (11).
The GIF was originally described by Walter (12) in 1980 and then further elaborated on by Morgenstern and Bursic (11) in 1982. Specifically, it is “the proportional reduction in the total number of new (incident) cases of a certain disease, resulting from a specific change in the distribution of a risk factor in the population at risk” (11, p. 295). Despite its introduction over 25 years ago, it has not caught on as either a replacement for or a complement to the AF. Recent examples of its use come from research on the global burden of disease (13), health policy (14), environmental epidemiology (15), and nutritional epidemiology (16).
Our goal in this study was to estimate the population burden of incident heart failure that would be prevented from a feasible reduction in the prevalence of obesity and overweight, through calculation of the GIF. We considered several scenarios of reduced prevalence of obesity and overweight. In addition, we calculated the AF, using the same method used to calculate the GIF, to compare this more commonly used measure with the GIF.
MATERIALS AND METHODS
Study population
The Atherosclerosis Risk in Communities (ARIC) cohort (n = 15,792) was recruited between 1987 and 1989 using probability sampling of persons aged 45–64 years from 4 US communities: Forsyth County, North Carolina; Jackson, Mississippi; the northwestern suburbs of Minneapolis, Minnesota; and Washington County, Maryland. The distribution of blacks and whites from each field center was representative of the area (mostly whites in Minneapolis and Washington County, 15% blacks in Forsyth County), except in Jackson, where only blacks were sampled. Response to the baseline examination was 46% in Jackson and 65%–67% in the other communities. Three subsequent examinations were conducted at approximately 3-year intervals through 1996–1998. The design and rationale of the ARIC Study (17) and comparisons between responders and nonresponders (18) have been previously published. The institutional review boards from each study site approved the ARIC Study. Participants provided written informed consent at each examination.
Racial groups not classified as white or black (n = 48) and blacks not from the city of Jackson or Forsyth County (n = 120) were excluded from the analyses because of their limited numbers. Persons missing anthropometric data at baseline were excluded (n = 33). Prevalent heart failure was excluded by means of the following criteria: 1) persons reporting medication use for heart failure (n = 83); 2) persons with a stage 3 Gothenburg score (n = 699) (19); and 3) persons missing data on criteria used to define prevalent heart failure (n = 289). After these exclusions, the total sample size was 14,399.
Anthropometric and study population characteristics
Body mass index was calculated as weight (kg) divided by height squared (m2). Height and weight were measured using standardized methods (20). All measurements and characteristics were from the baseline visit. Race, gender, educational level, alcohol use, and smoking status were obtained by participant self-report. A history of coronary heart disease included prior myocardial infarction (either a self-report of physician-diagnosed myocardial infarction or silent myocardial infarction as identified by electrocardiography) or a prior coronary revascularization procedure or coronary artery bypass surgery. Hypertension was defined as either a measured diastolic blood pressure ≥90 mm Hg or a measured systolic blood pressure ≥140 mm Hg or recent use of antihypertensive medication. Diabetes mellitus was defined as any of the following: self-reported history of physician-diagnosed diabetes, recent use of medication for diabetes, fasting blood glucose concentration ≥126 mg/dL, or nonfasting blood glucose concentration ≥200 mg/dL.
Ascertainment of heart failure events
The following methods were used for ascertainment of heart failure events: 1) participants were contacted annually by telephone and interviewed about interim hospitalizations; 2) local hospitals provided lists of hospital discharges with cardiovascular diagnoses, and these were reviewed to identify cohort hospitalizations; and 3) health department death certificate files were continuously surveyed. All discharge codes for cohort hospitalizations and listed causes of death from death certificates were recorded (underlying cause of death or contributory causes).
Criteria for an incident heart failure event
Incident heart failure was defined according to International Classification of Diseases codes for a hospitalization (n = 1,329) or death (n = 76) (International Classification of Diseases, Ninth Revision, Clinical Modification, code 428.x or International Classification of Diseases, Tenth Revision, code I50), as previously described (20). Follow-up for incident heart failure events was defined as time from the baseline examination to the incident event, with follow-up through December 31, 2003. The end of follow-up for persons without heart failure was the first occurrence of either 1) December 31, 2003, 2) the date of last contact, or 3) the date of death.
Estimates for reduced prevalence of obesity and overweight
To determine feasible goals for weight reduction, we considered the goals set by the US Department Health and Human Services in the Healthy People 2010 report (21). Healthy People 2010 is a set of recommended health objectives that were meant to serve as a basis from which to develop plans for health improvement by the year 2010. Obesity and overweight are listed as high-priority public health issues. Specifically, their aim is to reduce the proportion of obese adults aged 20 years or older to 15% from 23%, which is approximately a 35% reduction in the proportion of adults who are obese. For this study, several scenarios were selected for a reduction in obesity and overweight, for which the maximum achievable goal was a 30% reduction in both obesity and overweight. Reductions of 30% for each subgroup were targeted, rather than a 15% prevalence of obesity for all subgroups, since certain groups with high rates of obesity, such as black women, would require an impractical amount of widespread weight reduction to meet this goal.
Statistical methods
The GIF and the AF were estimated using Appendix equations 1 and 2 (GIF) and Appendix equations 2 and 3 (AF), respectively (11). Specifically, the GIF and AF were calculated for each age-, race-, and gender-stratified group (equation 1 or 2 in the Appendix) and then combined using a case-load weighted sum method for an overall GIF and AF (equation 2 in the Appendix). Cox proportional hazards regression was used to model the associations between obesity (body mass index ≥30), overweight (body mass index 25–29.9), and normal weight (body mass index <25) and time to incident heart failure (22). All statistical analyses were performed using SAS software, version 9.1 (SAS Institute Inc., Cary, North Carolina).
Bootstrapping was used to estimate 95% simulation intervals for the GIF and AF (23). Ten thousand bootstrapped simulations (with replacement) were performed for each subgroup of race, gender, and age. Each sampled data set was the same size as the subgroup in the original data set. The overall GIF for each scenario was determined for each bootstrapped sample using equation 2 (10).
RESULTS
There were 3,887 obese, 5,787 overweight, and 4,968 normal-weight participants in the ARIC cohort at baseline (Table 1). Obese participants were more often black or female, more often had less than a high school education, and were more likely to have diabetes or hypertension. Furthermore, they were less likely to be smokers or current drinkers of alcohol. Prevalent coronary heart disease was less common among normal-weight participants than among those who were overweight or obese.
Table 1.
Characteristics of the Study Population (n = 14,642) at Baseline, by Category of Body Mass Index, Atherosclerosis Risk in Communities Study, 1987–1989
| Characteristic | BMIa Category |
||
| Normal Weight (BMI <25) (n = 4,968) | Overweight (BMI 25–29.9) (n = 5,787) | Obese (BMI ≥30) (n = 3,887) | |
| Mean BMI (SD) | 22.5 (1.8) | 27 (1.4) | 34 (4.3) |
| Mean age, years (SD) | 54 (6) | 54 (6) | 54 (6) |
| Male gender, % | 37 | 56 | 39 |
| Black race, % | 18 | 25 | 39 |
| Study center, % | |||
| Jackson, Mississippi | 15 | 22 | 36 |
| Forsyth County, North Carolina | 34 | 25 | 17 |
| Minneapolis, Minnesota | 27 | 28 | 21 |
| Washington County, Maryland | 24 | 25 | 26 |
| Educational level, % | |||
| Less than high school | 18 | 23 | 30 |
| High school graduate | 34 | 31 | 32 |
| More than high school | 48 | 46 | 38 |
| Smoking status, % | |||
| Never smoker | 39 | 40 | 48 |
| Former smoker | 28 | 36 | 33 |
| Current smoker | 33 | 24 | 19 |
| Alcohol consumption, % | |||
| Never drinker | 21 | 23 | 34 |
| Former drinker | 16 | 18 | 21 |
| Current drinker | 63 | 59 | 45 |
| Diabetes mellitus, % | 5 | 10 | 21 |
| Hypertension, % | 21 | 32 | 49 |
| History of coronary heart disease, % | 3 | 5 | 5 |
Abbreviations: BMI, body mass index; SD, standard deviation.
Weight (kg)/height (m)2.
The main components of the GIF equation, along with heart failure incidence rates, are shown by subgroup in Table 2. Across all race and gender groups, the incidence rates of heart failure were at least 2 times larger for older subgroups than for younger subgroups. Older black women and men had particularly high heart failure incidence rates (14.0/1,000 person-years and 15.2/1,000 person-years for women and men, respectively). For all strata, the unadjusted hazard ratios and their 95% confidence intervals for obesity as compared with normal weight were above 1.0, representing a harmful association of obesity with incidence of heart failure. Hazard ratios for heart failure were particularly high among young white women (hazard ratio (HR) = 4.14, 95% confidence interval (CI): 2.70, 6.36). In most cases, the hazard ratios for overweight showed an intermediate adverse association with heart failure. However, 2 of the hazard ratios for the comparison of overweight persons with the referent group were less than 1.0 (for young black men, HR = 0.93, 95% CI: 0.49, 1.73; for young black women, HR = 0.94, 95% CI: 0.52, 1.69).
Table 2.
Incidence Rates of Heart Failure and Unadjusted Hazard Ratios for Incident Heart Failure According to Body Mass Index Category, by Race, Gender, and Age Group, Atherosclerosis Risk in Communities Study, 1987–2003
| Race, Gender, and Age Group, years | No. of Participants | Heart Failure Incidence Rate per 1,000 Person-Years | BMIa Category |
|||||
| Overweight (BMI 25–29.9) |
Obese (BMI ≥30) |
|||||||
| Proportion of Participants | HR | 95% CI | Proportion of Participants | HR | 95% CI | |||
| White women | ||||||||
| <55 | 3,079 | 2.59 | 0.29 | 1.52 | 0.92, 2.51 | 0.21 | 4.14 | 2.70, 6.36 |
| ≥55 | 2,580 | 6.54 | 0.32 | 1.56 | 1.31, 2.14 | 0.23 | 2.58 | 1.89, 3.53 |
| Black women | ||||||||
| <55 | 1,423 | 6.07 | 0.35 | 0.94 | 0.52, 1.69 | 0.47 | 1.63 | 0.96, 2.76 |
| ≥55 | 927 | 14.04 | 0.34 | 1.04 | 0.62, 1.72 | 0.48 | 1.75 | 1.10, 2.77 |
| White men | ||||||||
| <55 | 2,476 | 4.19 | 0.51 | 1.65 | 1.03, 2.64 | 0.22 | 2.64 | 2.01, 3.25 |
| ≥55 | 2,659 | 11.59 | 0.51 | 1.09 | 0.85, 1.40 | 0.22 | 1.98 | 1.51, 2.59 |
| Black men | ||||||||
| <55 | 830 | 6.46 | 0.44 | 0.93 | 0.49, 1.73 | 0.28 | 2.10 | 1.16, 3.80 |
| ≥55 | 669 | 15.23 | 0.39 | 1.12 | 0.72, 1.76 | 0.26 | 1.58 | 1.00, 2.49 |
Abbreviations: BMI, body mass index; CI, confidence interval; HR, hazard ratio.
Weight (kg)/height (m)2.
The Healthy People 2010 goal of reducing obesity to 15% among the US adult population is similar to our goal here of a 30% reduction in the proportion obese (Appendix Table 1). In most subgroups, a hypothetical 30% reduction in obesity resulted in a prevalence of obesity of 15%–19% in the population of interest. Black women were the exception, since there would be a prevalence of obesity of 33%–34% for black women even after a 30% reduction in obesity.
The median GIF (with 95% simulation intervals) for a 30% reduction in obesity from 10,000 bootstrapped data sets ranged from 4% to 11% for the 8 subgroups (Appendix Table 1). The 2.5% tail of the distribution of median GIF was actually negative for older black men.
The overall median GIFs (with 95% simulation intervals) for 10 different scenarios of weight reduction are shown in Figure 1 and Appendix Table 2. The overall median GIF for the scenario of a 30% reduction in the proportion obese (scenario 6) was 6.7% (95% simulation interval: 5.4, 8.0). This can be interpreted to mean that 6.7% of incident heart failure could be prevented in this population with a 30% reduction in obesity, assuming weight loss down to the normal weight category. The most aggressive weight reduction scenario assumed here, other than complete elimination of obesity/overweight as required in calculation of the AF, was a 30% reduction in obesity and overweight down to the normal weight category (scenario 8, Figure 1). We predict that scenario 8 would result in the prevention of 8.5% (95% simulation interval: 6.1, 10.7) of incident heart failure events. The last 2 scenarios represent the AF, which assumes complete elimination of obesity and overweight in the case of the 10th scenario, whereas the ninth scenario assumes complete elimination of obesity only. The AF (scenario 10) is approximately 3 times larger than the GIF from the other most aggressive scenario of weight reduction presented here (scenario 8). As would be expected, there are increases in the GIF when persons who are obese and have lost weight are shifted to normal weight (scenarios 2 and 6) rather than overweight (scenarios 1 and 5).
Figure 1.

The median generalized impact fraction and attributable fraction (with 2.5%–97.5% simulation intervals) derived from 10,000 bootstrap data sets using the case-load weighted-sum method, given 10 scenarios of reduced prevalence of obesity and overweight, Atherosclerosis Risk in Communities Study, 1987–2003. Scenarios for the reduced prevalence of overweight and obesity are as follows: 1) 15% reduction in obesity, shift obese to overweight; 2) 15% reduction in obesity, shift obese to normal weight; 3) 15% reduction in obesity and overweight, shift down 1 category; 4) 15% reduction in obesity and overweight, down to normal weight; 5) 30% reduction in obesity, shift obese to overweight; 6) 30% reduction in obesity, shift obese to normal weight; 7) 30% reduction in obesity and overweight, shift down 1 category; 8) 30% reduction in obesity and overweight, shift to normal weight; 9) attributable fraction, complete elimination of obesity; 10) attributable fraction, complete elimination of obesity and overweight. Bars, 95% simulation interval.
DISCUSSION
We examined the possible public health impact on heart failure incidence given multiple hypothetical and feasible reductions in obesity and/or overweight, and found that the practical level of impact appears important. We estimated that a 30% reduction in obesity with presumed weight loss to the normal weight category, the goal most similar to the Healthy People 2010 goal of 15% prevalence of obesity, would hypothetically result in 6.7% fewer incident heart failure events. It is estimated that there are approximately 660,000 incident heart failure events annually in the United States (1). The average cost per hospital discharge for heart failure (estimated from 2003 data) is $6,577 (1). To extrapolate our findings to the entire United States using these estimates, a 6.7% reduction in heart failure would result in 44,220 fewer incident heart failure events expected annually, with an estimated annual cost savings of $477,674,356. Because of the high prevalence of heart failure and the frequent need for rehospitalization, such an impact would offer important reductions in disease burden and health-care utilization. Although not accounted for in these calculations, population-wide weight reduction should also have a preventive effect on common heart failure risk factors, such as hypertension (24) and diabetes (25), resulting in further reductions in health-care cost and utilization.
Caution should be taken in assuming a causal association for obesity determined from observational studies (26). Although this measure clearly has limitations in assuming a causal association between exposure and disease, as well as the presumed impact of a hypothetical intervention, we pose this method as a comparison with the common practice of estimating the AF, for which these assumptions are the same.
Another goal from Healthy People 2010 is to increase the percentage of the population that is normal weight to 60% (21). Even with a 30% reduction in overweight and obesity, this goal will not be achieved (data not shown); instead the percentage of normal weight after a 30% reduction in obesity and overweight would be 43%–54% per subgroup, except among white women, in whom it would be 61%–65%. Currently, more widespread weight reduction than 30% would be needed to accomplish this goal among race and gender groups other than white women.
The GIF estimates shown here are relatively small compared with the much higher estimate of 28% for the AF. As compared with the AF, the GIF is a measure of the preventable burden of disease that can be based on multiple hypothetical changes in the exposure distribution. Although not shown here, the GIF can also be used to predict the effect of a given shift in the distribution of a continuous exposure measurement (27). The AF can be thought of as simply the maximum GIF (11). To date, the GIF has not been used elsewhere to describe the preventable burden of heart failure due to obesity. However, researchers in 2 other studies have calculated the AF (5, 28). First, in the Framingham Heart Study, Kenchaiah et al. (28) estimated that the AF for heart failure was 14% for overweight women, 13.9% for obese women, 8.8% for overweight men, and 10.9% for obese men. They used an equation for the AF that is appropriate when the relative risk has been adjusted for confounders. The Framingham population has a lower prevalence of obesity than the ARIC population; furthermore, Kenchaiah et al. adjusted for factors lying along the causal pathway between obesity and heart failure (causal intermediates), which lowers the magnitude of the effect estimate. Secondly, in the First National Health and Nutrition Examination Survey, He et al. (5) calculated the AF of heart failure for overweight persons (5.6% in men, 9.6% in women); however, they dichotomized body mass index at 27.8 for men and 27.3 for women. In both studies, confidence intervals for AF were not estimated. These estimates of AF are lower than those estimated here. This is partly due to differences in the prevalence of obesity and overweight in the populations and the magnitude of the relative estimate of effect. In addition, the method used here was based on stratified analysis; therefore, we were unable to control for numerous confounders, as would be possible from a regression-based approach.
There are several assumptions of the GIF and the AF (11). The relative risk, or in this case hazard ratio, must be a valid estimate of the causal relation between an exposure and a disease for the desired target population and not be biased by confounding or misclassification. In this case, we estimated the relation between obesity and heart failure from a longitudinal observational study, and clearly there was potential for unmeasured confounding. In addition, we extrapolated from our study population, the ARIC cohort, to the US general population, our target. Although it was not done here, we could have standardized the data to the US general population by using the exposure distribution from the US population. In addition, we assumed that persons who were hypothetically shifted (obese) to a different risk group (normal weight or overweight) after intervention would have the same level of risk that their new risk group had before intervention. We assumed that persons who lost weight would have the same risk of heart failure as those who were normal weight without intervention. When this condition is not met, the GIF and the AF may overestimate the impact of an intervention. Hernán and Taubman (26) discussed issues related to assuming a hypothetical intervention for obesity without specifying the intervention; although we do not specify the type of hypothetical intervention here, neither do most other investigators in estimating the AF. In addition, it is assumed that there are not secular trends in disease risk that are not due to the intervention and there are not secular trends in intermediary diseases, such as diabetes, that would affect the relation between the exposure and disease. Secular trends clearly show increasing incidence of heart failure, obesity, and diabetes (1), which is one reason primary prevention has become vital. Although all of these criteria are not easily met, these are the same assumptions made when estimating the often-used AF.
Limitations of this analysis and the GIF in general include the fact that an adjusted effect measure cannot be used in the GIF formula; rather, one must stratify by important confounders and use the crude effect measure for each stratum. Therefore, strata with small sample sizes can be a problem. This is not the case for the AF, as there are formulas using an adjusted relative measure of effect (29). This is less likely to have been a problem in the current study, as there were few statistical confounders identified using a 10% change-in-estimate criterion (20). In addition, it is difficult to determine feasible goals for population-wide weight reduction (30); however, a spectrum of weight loss goals was considered here, with the Healthy People 2010 goals (21) being the most optimistic. The GIF is subject to the same limitations as the AF. Discretion should be used when applying and interpreting both measures. Furthermore, Greenland and Robins (31) recognized 3 distinct quantities known as the AF: the etiologic fraction of the exposed cases, the excess fraction of the exposed risk or cases, and the incidence density fraction. The AF quantity estimated here is akin to the incidence density fraction. More precisely, it is the hazard fraction, the hazard being the theoretical limit of the incidence density as the follow-up period approaches zero. It should be recognized that all of these AF measures may differ in magnitude. The incidence density fraction may approximate the excess fraction for rare diseases and therefore the hazard fraction, if the hazard remains approximately constant within covariate strata over the follow-up period. Without very strong, usually untestable, and often implausible assumptions, none of these measures approximates the etiologic fraction (32).
For the special cases in which a percentage of both overweight and obese persons is shifted to normal weight, the GIF could be calculated as that percentage of the AF. For example, with a 30% reduction in obesity and overweight with weight loss down to normal weight (scenario 8), the GIF is 8.4, which is the same as 30% of the AF of 28% (scenario 10). This is not surprising here, as the same formula and stratification variables were used to calculate both AF and GIF. More commonly, the AF is calculated with an equation allowing inclusion of a multivariable-adjusted effect estimate, whereas there is no such equation for GIF. Therefore, GIF calculation using the percentage of AF will not be accurate for most published estimates of the AF.
In 1982, Morgenstern and Bursic illustrated the use of the GIF with an example of the impact of a hypothetical weight loss program on the incidence of coronary heart disease (11). Similarly, we estimated the effect of reduction in obesity on the burden of heart failure. These examples show how the GIF could be used in the epidemiologic literature for risk factors that are unlikely to be completely eradicated. For common risk factors such as obesity and overweight, the impact of intervention may reveal important changes in the burden of disease even when risk factor-disease associations are relatively weak. We suggest that investigators consider estimating the GIF instead of, or alongside of, the AF, in order to avoid estimates of population impact based on goals that are unlikely to be achieved given available prevention or treatment methods. Such evaluations are vital in order to inform and prioritize future prevention programs regarding the possible impact of intervention efforts.
Acknowledgments
Author affiliations: Department of Epidemiology, Gillings School of Global Public Health, University of North Carolina at Chapel Hill, Chapel Hill, North Carolina (Laura R. Loehr, Wayne D. Rosamond, Charles Poole, Gerardo Heiss); Division of Cardiology, School of Medicine, University of North Carolina at Chapel Hill, Chapel Hill, North Carolina (Patricia P. Chang); Merck Research Laboratories, Rahway, New Jersey (Ann Marie McNeill); Section of Cardiology, Michael E. DeBakey Veterans Affairs Medical Center, Houston, Texas (Anita Deswal); Section of Cardiology, Baylor College of Medicine, Houston, Texas (Anita Deswal); and Division of Epidemiology and Community Health, School of Public Health, University of Minnesota, Minneapolis, Minnesota (Aaron R. Folsom).
The Atherosclerosis Risk in Communities (ARIC) Study is carried out as a collaborative study supported by National Heart, Lung, and Blood Institute contracts N01-HC-55015, N01-HC-55016, N01-HC-55018, N01-HC-55019, N01-HC-55020, N01-HC-55021, and N01-HC-55022.
The authors thank the staff of the ARIC Study for their important contributions.
Dr. Ann Marie McNeill is employed by and owns stock in Merck, Inc.
Glossary
Abbreviations
- AF
attributable fraction
- ARIC
Atherosclerosis Risk in Communities
- CI
confidence interval
- GIF
generalized impact faction
- HR
hazard ratio
APPENDIX
Equation 1: GIF per stratum
The generalized impact fraction (GIF) for a given bootstrap sample and stratum a, b, c is a,b,c is
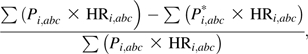 |
where
GIF = generalized attributable fraction for 1 bootstrap sample, from a given stratum of a, b, c;
Pi = proportion of the population in exposure category i;
HR = hazard ratio;
Pi* = proportion of the population in exposure category i after an intervention or other change;
HRi = crude hazard ratio in exposure category i as compared with the reference level;
i = normal weight, overweight, or obese status as defined by body mass index (weight (kg)/height (m)2) category; and
abc = stratum of age (<55 years or ≥55 years), race (black or white), and gender (male or female).
Specifically,
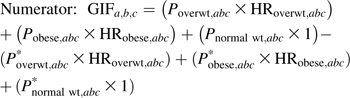 |
and
Equation 2: case-load weighted sum method for GIFoverall
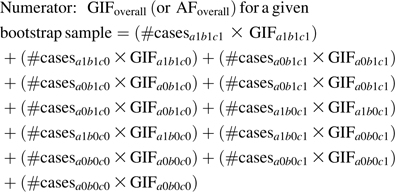 |
and
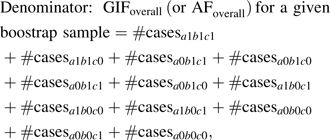 |
where AF = attributable fraction.
Equation 3: AF, or maximum GIF, per stratum
The AF (or maximum GIF) for a given bootstrap sample from stratum a, b, c is
where pdi = proportion of total cases arising from the ith exposure category and HRi = unadjusted HR for the ith exposure category in comparison with the reference category (i = overweight or obese vs. normal).
Appendix Table 1.
Median Proportion of Subjects in Each Body Mass Index Category and Median Generalized Impact Fraction (With 2.5%–97.5% Simulation Intervals) for Heart Failure Derived From 10,000 Bootstrapped Data Sets Under 2 Different Weight Reduction Scenarios, by Race, Gender, and Age Group, Atherosclerosis Risk in Communities Study, 1987–2003
| Race, Gender, and Age Group, years | Median Proportion of
Participants |
Scenario 1a |
Scenario 2b |
||||
| Overweight (BMIc 25–29.9) | Obese (BMI ≥30) | Obese After a 30% Reduction | Median GIF, % | 95% SI | Median GIF, % | 95% SI | |
| White women | |||||||
| <55 | 0.29 | 0.21 | 0.15 | 11 | 8, 15 | 13.5 | 8.6, 18.3 |
| ≥55 | 0.32 | 0.23 | 0.16 | 7 | 5, 10 | 10.5 | 6.7, 14.4 |
| Black women | |||||||
| <55 | 0.35 | 0.47 | 0.33 | 7 | 0.5, 13 | 6.7 | −4.4, 16.4 |
| ≥55 | 0.34 | 0.48 | 0.34 | 8 | 2, 13 | 8.2 | −1.1, 16.1 |
| White men | |||||||
| <55 | 0.51 | 0.22 | 0.16 | 8 | 5, 11 | 13.6 | 7.2, 20.0 |
| ≥55 | 0.51 | 0.22 | 0.15 | 5 | 3, 7 | 6.1 | 1.6, 10.4 |
| Black men | |||||||
| <55 | 0.44 | 0.28 | 0.19 | 7 | 2, 13 | 6.6 | −4.4, 16.0 |
| ≥55 | 0.39 | 0.26 | 0.18 | 4 | −0.1, 8 | 5.0 | −2.6, 11.9 |
Abbreviations: BMI, body mass index; GIF, generalized impact fraction; SI, simulation interval.
A 30% reduction in obesity to normal weight, shift all to normal weight.
A 30% reduction in obesity and overweight with reduction to normal weight, shift all to normal weight.
Weight (kg)/height (m)2.
Appendix Table 2.
Median Generalized Impact Fraction and Attributable Fraction (With 2.5%–97.5% Simulation Intervals) for Heart Failure Derived From 10,000 Bootstrapped Data Sets Using the Case-Load Weighted-Sum Method, Given 10 Scenarios of Reduced Prevalence of Obesity and Overweight, Atherosclerosis Risk in Communities Study, 1987–2003
| Scenario No. | Hypothetical Weight Reduction Scenario | Median Generalized Impact Fraction (× 100) | 95% Simulation Interval |
| 1 | 15% reduction in obesity, shift obese to overweight | 2.9 | 2.3, 3.5 |
| 2 | 15% reduction in obesity, shift obese to normal weight | 3.4 | 2.7, 4.0 |
| 3 | 15% reduction in obesity and overweight, shift both down 1 category | 3.7 | 3.0, 4.5 |
| 4 | 15% reduction in obesity and overweight, shift both to normal weight | 4.2 | 3.0, 5.4 |
| 5 | 30% reduction in obesity, shift obese to overweight | 5.7 | 4.6, 7.0 |
| 6 | 30% reduction in obesity, shift obese to normal weight | 6.7 | 5.4, 8.0 |
| 7 | 30% reduction in obesity and overweight, shift both down 1 category | 7.4 | 6.0, 9.0 |
| 8 | 30% reduction in obesity and overweight, shift both to normal weight | 8.5 | 6.1, 10.7 |
| 9 | Complete elimination of obesity, shift to normal weight | 22.0 | 18.0, 27.0 |
| 10 | Complete elimination of obesity and overweight, shift to normal weight | 28.0 | 20.0, 36.0 |
References
- 1.Rosamond W, Flegal K, Furie K, et al. Heart disease and stroke statistics—2008 update: a report from the American Heart Association Statistics Committee and Stroke Statistics Subcommittee. Circulation. 2008;117(4):e25–e146. doi: 10.1161/CIRCULATIONAHA.107.187998. [DOI] [PubMed] [Google Scholar]
- 2.Hunt SA, Abraham WT, Chin MH, et al. ACC/AHA 2005 Guideline Update for the Diagnosis and Management of Chronic Heart Failure in the Adult: a report of the American College of Cardiology/American Heart Association Task Force on Practice Guidelines (Writing Committee to Update the 2001 Guidelines for the Evaluation and Management of Heart Failure): developed in collaboration with the American College of Chest Physicians and the International Society for Heart and Lung Transplantation: endorsed by the Heart Rhythm Society. Circulation. 2005;112(12):e154–e235. doi: 10.1161/CIRCULATIONAHA.105.167586. [DOI] [PubMed] [Google Scholar]
- 3.Schocken DD, Benjamin EJ, Fonarow GC, et al. Prevention of heart failure: a scientific statement from the American Heart Association Councils on Epidemiology and Prevention, Clinical Cardiology, Cardiovascular Nursing, and High Blood Pressure Research; Quality of Care and Outcomes Research Interdisciplinary Working Group; and Functional Genomics and Translational Biology Interdisciplinary Working Group. Circulation. 2008;117(19):2544–2565. doi: 10.1161/CIRCULATIONAHA.107.188965. [DOI] [PubMed] [Google Scholar]
- 4.Kenchaiah S, Narula J, Vasan RS. Risk factors for heart failure. Med Clin North Am. 2004;88(5):1145–1172. doi: 10.1016/j.mcna.2004.04.016. [DOI] [PubMed] [Google Scholar]
- 5.He J, Ogden LG, Bazzano LA, et al. Risk factors for congestive heart failure in US men and women: NHANES I Epidemiologic Follow-up Study. Arch Intern Med. 2001;161(7):996–1002. doi: 10.1001/archinte.161.7.996. [DOI] [PubMed] [Google Scholar]
- 6.Benichou J. Biostatistics and epidemiology: measuring the risk attributable to an environmental or genetic factor. C R Biol. 2007;330(4):281–298. doi: 10.1016/j.crvi.2007.02.015. [DOI] [PubMed] [Google Scholar]
- 7.Flegal KM, Graubard BI, Williamson DF. Methods of calculating deaths attributable to obesity. Am J Epidemiol. 2004;160(4):331–338. doi: 10.1093/aje/kwh222. [DOI] [PubMed] [Google Scholar]
- 8.Flegal KM, Graubard BI, Williamson DF, et al. Excess deaths associated with underweight, overweight, and obesity. JAMA. 2005;293(15):1861–1867. doi: 10.1001/jama.293.15.1861. [DOI] [PubMed] [Google Scholar]
- 9.Vander Hoorn S, Ezzati M, Rodgers A, et al. Estimating attributable burden of disease from exposure and hazard data. In: Ezzati M, Lopez AD, Rodgers A, et al., editors. Comparative Quantification of Health Risks: Global and Regional Burden of Disease Attributable to Selected Major Risk Factors. Geneva, Switzerland: World Health Organization; 2004. pp. 2129–2140. [Google Scholar]
- 10.Benichou J. A review of adjusted estimators of attributable risk. Stat Methods Med Res. 2001;10(3):195–216. doi: 10.1177/096228020101000303. [DOI] [PubMed] [Google Scholar]
- 11.Morgenstern H, Bursic ES. A method for using epidemiologic data to estimate the potential impact of an intervention on the health status of a target population. J Community Health. 1982;7(4):292–309. doi: 10.1007/BF01318961. [DOI] [PubMed] [Google Scholar]
- 12.Walter SD. Prevention for multifactorial diseases. Am J Epidemiol. 1980;112(3):409–416. doi: 10.1093/oxfordjournals.aje.a113007. [DOI] [PubMed] [Google Scholar]
- 13.Murray CJ, Lopez AD. On the comparable quantification of health risks: lessons from the Global Burden of Disease Study. Epidemiology. 1999;10(5):594–605. [PubMed] [Google Scholar]
- 14.Nilunger L, Diderichsen F, Burström B, et al. Using risk analysis in health impact assessment: the impact of different relative risks for men and women in different socio-economic groups. Health Policy. 2004;67(2):215–224. doi: 10.1016/s0168-8510(03)00122-2. [DOI] [PubMed] [Google Scholar]
- 15.Semenza JC, Rubin CH, Falter KH, et al. Heat-related deaths during the July 1995 heat wave in Chicago. N Engl J Med. 1996;335(2):84–90. doi: 10.1056/NEJM199607113350203. [DOI] [PubMed] [Google Scholar]
- 16.Graham P. Bayesian inference for a generalized population attributable fraction: the impact of early vitamin A levels on chronic lung disease in very low birthweight infants. Stat Med. 2000;19(7):937–956. doi: 10.1002/(sici)1097-0258(20000415)19:7<937::aid-sim395>3.0.co;2-v. [DOI] [PubMed] [Google Scholar]
- 17.The ARIC Investigators. The Atherosclerosis Risk in Communities (ARIC) Study: design and objectives. Am J Epidemiol. 1989;129(4):687–702. [PubMed] [Google Scholar]
- 18.Jackson R, Chambless L, Yank K, et al. Differences between respondents and nonrespondents in a multicenter community-based study vary by gender ethnicity. The Atherosclerosis Risk in Communities (ARIC) Study Investigators. J Clin Epidemiol. 1996;49(12):1441–1446. doi: 10.1016/0895-4356(95)00047-x. [DOI] [PubMed] [Google Scholar]
- 19.Eriksson H, Caidahl K, Larsson B, et al. Cardiac and pulmonary causes of dyspnoea—validation of a scoring test for clinical-epidemiological use: the Study of Men Born in 1913. Eur Heart J. 1987;8(9):1007–1014. doi: 10.1093/oxfordjournals.eurheartj.a062365. [DOI] [PubMed] [Google Scholar]
- 20.Loehr LR, Rosamond WD, Poole C, et al. Association of multiple anthropometrics of overweight and obesity with incident heart failure: the Atherosclerosis Risk in Communities Study. Circ Heart Fail. 2009;2(1):18–24. doi: 10.1161/CIRCHEARTFAILURE.108.813782. [DOI] [PMC free article] [PubMed] [Google Scholar]
- 21.US Department of Health and Human Services . Healthy People 2010: Understanding and Improving Health. Washington, DC: US GPO; 2000. [Google Scholar]
- 22.National Institutes of Health Clinical Guidelines on the Identification, Evaluation, and Treatment of Overweight and Obesity in Adults—the Evidence Report. Obes Res. 1998;6(suppl 2):51S–209S. [PubMed] [Google Scholar]
- 23.Greenland S. Interval estimation by simulation as an alternative to and extension of confidence intervals. Int J Epidemiol. 2004;33(6):1389–1397. doi: 10.1093/ije/dyh276. [DOI] [PubMed] [Google Scholar]
- 24.Levy D, Larson MG, Vasan RS, et al. The progression from hypertension to congestive heart failure. JAMA. 1996;275(20):1557–1562. [PubMed] [Google Scholar]
- 25.Masoudi FA, Inzucchi SE. Diabetes mellitus and heart failure: epidemiology, mechanisms, and pharmacotherapy. Am J Cardiol. 2007;99(4A):113B–132B. doi: 10.1016/j.amjcard.2006.11.013. [DOI] [PubMed] [Google Scholar]
- 26.Hernán MA, Taubman SL. Does obesity shorten life? The importance of well-defined interventions to answer causal questions. Int J Obes (Lond) 2008;32(suppl 3):S8–S14. doi: 10.1038/ijo.2008.82. [DOI] [PubMed] [Google Scholar]
- 27.Barendregt JJ, Veerman JL. Categorical versus continuous risk factors and the calculation of potential impact fractions. J Epidemiol Community Health. 2010;64(3):209–212. doi: 10.1136/jech.2009.090274. [DOI] [PubMed] [Google Scholar]
- 28.Kenchaiah S, Evans JC, Levy D, et al. Obesity and the risk of heart failure. N Engl J Med. 2002;347(5):305–313. doi: 10.1056/NEJMoa020245. [DOI] [PubMed] [Google Scholar]
- 29.Rockhill B, Newman B, Weinberg C. Use and misuse of population attributable fractions. Am J Public Health. 1998;88(1):15–19. doi: 10.2105/ajph.88.1.15. [DOI] [PMC free article] [PubMed] [Google Scholar]
- 30.Veerman JL, Barendregt JJ, van Beeck EF, et al. Stemming the obesity epidemic: a tantalizing prospect. Obesity (Silver Spring) 2007;15(9):2365–2370. doi: 10.1038/oby.2007.280. [DOI] [PubMed] [Google Scholar]
- 31.Greenland S, Robins JM. Conceptual problems in the definition and interpretation of attributable fractions. Am J Epidemiol. 1988;128(6):1185–1197. doi: 10.1093/oxfordjournals.aje.a115073. [DOI] [PubMed] [Google Scholar]
- 32.Robins JM, Greenland S. Estimability and estimation of excess and etiologic fractions. Stat Med. 1989;8(7):845–859. doi: 10.1002/sim.4780080709. [DOI] [PubMed] [Google Scholar]