Understanding the mechanisms of coronary drug-eluting stent (DES) failure remains relevant in light of concerns brought on by clinical reports of life-threatening late and very late stent thrombosis and by autopsy studies showing delayed and incomplete healing inside the stents, which may be related to underlying necrotic lipid core.1 Frequency-domain optical coherence tomography, also known as optical frequency-domain imaging (OFDI), is a new intracoronary imaging technology that enables 3-dimensional visualization of coronary structure in vivo at a resolution (≈6 μm) sufficient to identify many microscopic features of the coronary wall and stents.2 Here, we present a case of late DES failure that was imaged by OFDI at the time of stent implantation and 15 months later on presentation with unstable angina.
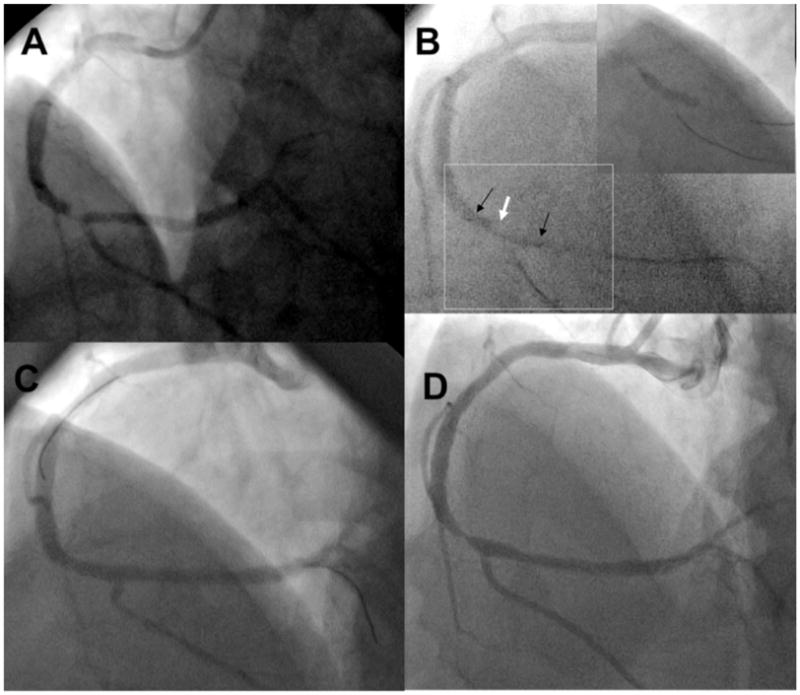
The patient was a 52-year-old man with hypertension, dyslipidemia, a family history of coronary artery disease, and prior myocardial infarction in 1998. The patient presented again to the Lahey Clinic in 2007 (baseline), complaining of rest and exertional chest pain and with a positive stress test.2 Angiography revealed a 99% stenosis in the right coronary artery near the bifurcation of the posterior descending artery (Figure 1A). Deployment of a 3×18-mm sirolimus DES (Cypher Cordis, Miami, Fla) was performed with a good result (Figure 1B and 1C). The operators were blinded to the results of OFDI imaging. The patient was maintained on dual antiplatelet therapy (aspirin and clopidogrel) and a statin. The patient returned 15 months later with symptoms of unstable angina. Diagnostic angiography was performed, followed by OFDI of the right coronary artery. The angiogram revealed a 95% right coronary artery stenosis at the proximal edge of the DES (Figure 1D). There was also a new 60% to 70% left main ostial lesion. The patient underwent coronary artery bypass grafting with a successful outcome.
Figure 1.

Angiogram of the right coronary artery in a left anterior oblique cranial angulation obtained at initial presentation (A) reveals a distal lesion just before the origin of the posterior descending artery (arrow). In the same angulation (B), the markers of the stent deployment balloon (black arrows) are shown covering the lesion (white arrow). There are 2 guide wires, 1 in the posterior descending artery and the other in the posterolateral branch. The stent deployment balloon is inflated (inset), confirming position and coverage of the angiographic stenosis. Angiogram after stent placement (C) shows a good angiographic result with coverage of the lesion. Angiogram acquired at 15 months (D) demonstrates a severe stenosis in the distal vessel, which is slightly more proximal than the original lesion and involves the proximal edge of the stent (arrow).
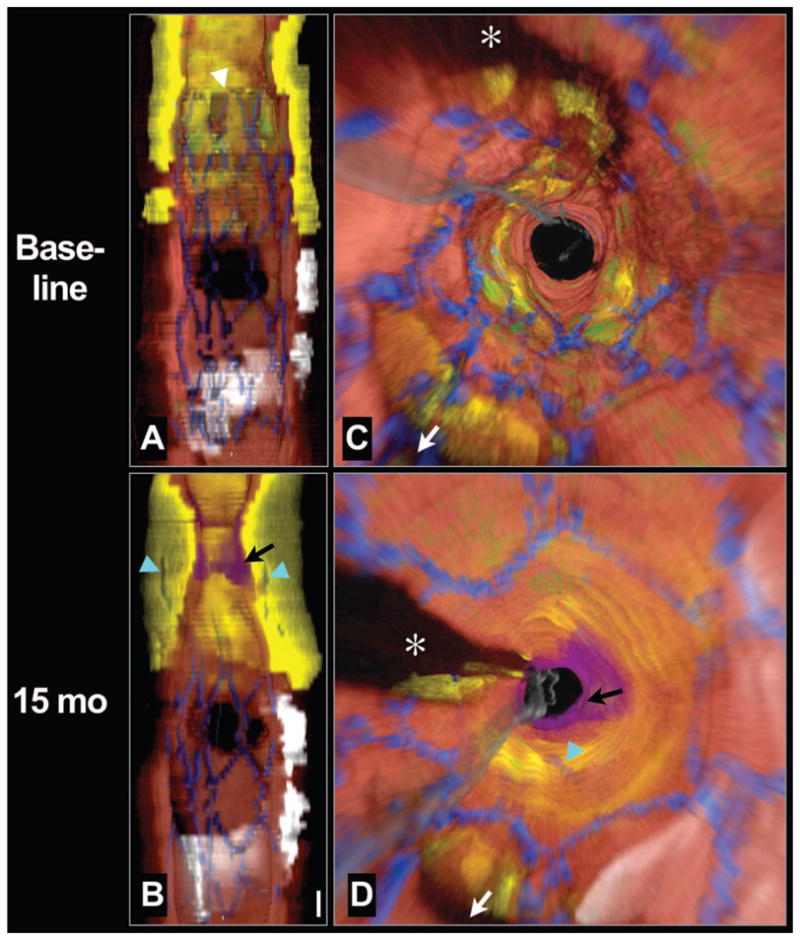
Three-dimensional cutaway and fly-through views of the intracoronary OFDI data at baseline showed a large, circumferential, lipid-rich, necrotic core lesion incompletely covered by the proximal edge of the DES (Figure 2A and 2C). The stent margin was located near the center of the plaque (Figure 2A, white arrowhead). At 15 months, luminal plaque growth at the proximal stent margin was evident; the struts were embedded deep within the necrotic core (Figure 2B and 2D, cyan arrows). An overlying nonocclusive thrombus was also identified near the proximal margin (Figure 2B and 2D, black arrow), which resulted in an additional lumen loss (86% instent percent area obstruction).
Figure 2.

Longitudinal cutaway view (A) and fly-through view (C) at baseline demonstrates that the stent was deployed over a large circumferential lipid core and that the proximal stent margin was placed in the center of the lesion (white arrowhead). Longitudinal cutaway view (B) and fly-through view (D) at 15 months shows that the necrotic core had grown or prolapsed into the lumen, leaving the struts embedded deep within the plaque (cyan arrows). A thrombus formed near the stent edge (black arrows). Red color indicates artery wall; green, macrophages; yellow, lipid core; blue, stent; white, calcium; purple, thrombus; gray, guide wire. White arrow denotes side branch in (C) and (D).
*Guide wire shadow. Scale bar in (B), 1 mm (for both A and B). Fly-through views are presented from a distal to proximal perspective.
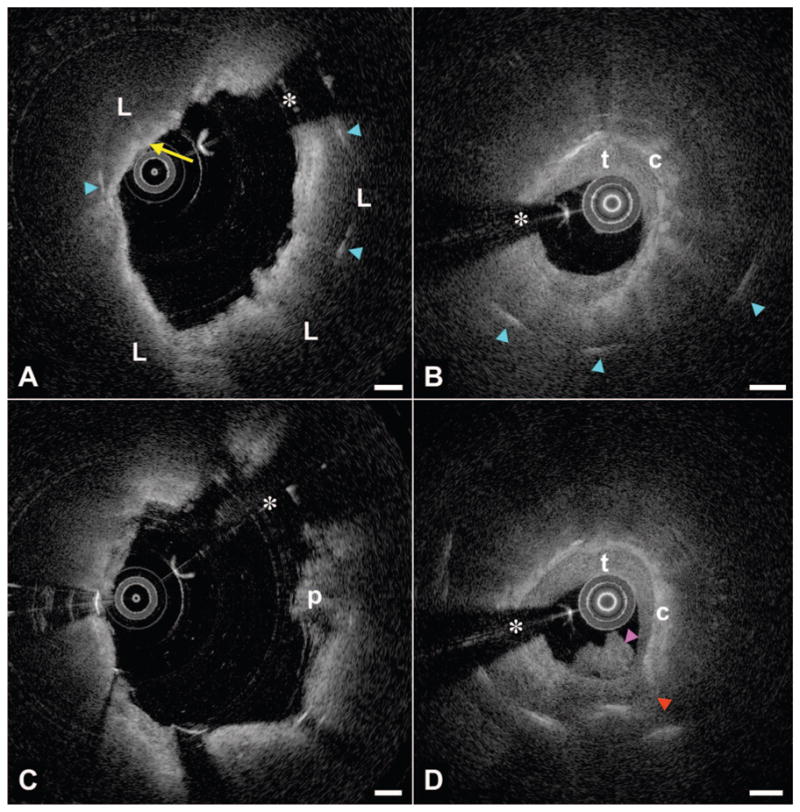
Cross-sectional baseline OFDI images at the proximal stent edge demonstrated that the stent’s margin was located on a portion of the plaque, consistent with a lipid-core lesion covered by an inflamed thin, fibrous cap (Figure 3A, yellow arrow), with stent struts seen within the necrotic core. The minimal luminal area by OFDI just outside the proximal stent margin was 6.3 mm2. Minimal luminal area of the reference segment (5 mm proximal to the stent margin) was 8.6 mm2. At 15 months (Figure 3B), there was further plaque growth into the lumen, causing significant luminal narrowing. Stent struts were visible deep (>1.0 mm) within the lipid core. The circumferential thin-capped fibroatheroma had a mottled, irregular cap, suggestive of fibrin deposits, and was covered by thrombus.
Figure 3.

Registered cross-sectional OFDI images from the 2 imaging time points. A, Baseline image at the stent’s proximal margin demonstrates a circumferential lipid core (L) with a thin cap (yellow arrow) with stent struts (cyan arrowheads) penetrating into the core. B, At 15 months, the lumen at the proximal margin showed significant narrowing; struts can be visualized deep within the lipid core. The fibrous cap (c) was covered by homogeneous tissue with low attenuation, consistent with thrombus (t) or possibly neointima. C, Approximately 1.2 mm from the proximal stent edge inside the stent, the baseline image is notable for circumferential lipid with a thick fibrous cap and minor tissue pro-lapse (p). D, The 15-month image at this same location shows evidence of cap rupture (red arrowhead) and a thrombus protruding into the lumen (magenta arrowhead), communicating with the necrotic core at the rupture site. Scale bars, 500 μm. *Guide wire shadow.
Within the DES, ≈1.2 mm from the proximal stent margin, the baseline image (Figure 3C) was remarkable for a thick-capped fibroatheroma, minor plaque prolapse (p), and some luminal irregularity. The 15-month image from the same location (Figure 3D) again showed significant plaque growth and deeply embedded struts. At this location, the cap demonstrated evidence of rupture (red arrowhead), with the necrotic core apparently in communication with an irregular thrombus (magenta arrowhead) that occluded the lumen further.
Discussion
This report illustrates a case of incomplete stent coverage of a necrotic-core plaque mass, despite adequate coverage of the angiographic stenosis. This has been termed by some as “longitudinal geographic miss” and is supported by studies utilizing quantitative angiography and intravascular ultrasound radiofrequency analysis,3 which consistently demonstrate the limitations of standard angiography to delineate the borders of the culprit plaque. In this case, incomplete coverage of the lipid-core lesion was likely associated with plaque progression leading to stent failure due to angiographic edge restenosis, which is reported to be the most common pattern of DES restenosis.4 Imaging with OFDI demonstrated that the mechanism of restenosis was progression of the necrotic core rather than neointimal hyperplasia.
Necrotic-core plaque rupture and thrombus formation months after stent implantation, either instent or at the edge of a stent placed over an incompletely covered lipid-core plaque, have been reported in rare autopsy cases but never before documented longitudinally in vivo. Clinically and angiographically indistinguishable from typical restenosis due to neointimal hyperplasia, stent failure due to necrotic-core plaque progression and rupture may occur in the setting of incomplete stent coverage of the plaque, may occur more frequently than previously recognized, and may be a precursor to stent thrombosis. The use of adjunct imaging modalities capable of performing plaque characterization, such as OFDI, at the time of percutaneous intervention could potentially optimize stent placement and minimize the risk of stent failure in selected cases; however, use of OFDI for this clinical application requires further study.
Acknowledgments
We thank Mireille Rosenberg, Judith Pendleton, and Patricia Baum for their invaluable assistance in this study.
Sources of Funding
This study was funded by the National Institutes of Health contract 5R01HL076398.
Footnotes
Clinical Trial Registration—URL: http://www.clinicaltrials.gov. Unique identifier: NCT00540761.
Disclosures
Drs Tearney and Bouma have received nonclinical research funding related to the development of OFDI technology from Terumo Corporation.
References
- 1.Nakazawa G, Finn AV, Joner M, Ladich E, Kutys R, Mont EK, Gold HK, Burke AP, Kolodgie FD, Virmani R. Delayed arterial healing and increased late stent thrombosis at culprit sites after drug-eluting stent placement for acute myocardial infarction patients: an autopsy study. Circulation. 2008;118:1138–1145. doi: 10.1161/CIRCULATIONAHA.107.762047. [DOI] [PubMed] [Google Scholar]
- 2.Tearney GJ, Waxman S, Shishkov M, Vakoc BJ, Suter MJ, Freilich MI, Desjardins AE, Oh WY, Bartlett LA, Rosenberg M, Bouma BE. Three-dimensional coronary artery microscopy by intracoronary optical frequency domain imaging. JACC Cardiovasc Imaging. 2008;1:752–761. doi: 10.1016/j.jcmg.2008.06.007. [DOI] [PMC free article] [PubMed] [Google Scholar]
- 3.Konig A, Margolis MP, Virmani R, Holmes D, Klauss V. Technology insight: in vivo coronary plaque classification by intravascular ultrasonography radiofrequency analysis. Nat Clin Pract Cardiovasc Med. 2008;5:219–229. doi: 10.1038/ncpcardio1123. [DOI] [PubMed] [Google Scholar]
- 4.Corbett SJ, Cosgrave J, Melzi G, Babic R, Biondi-Zoccai GG, Godino C, Morici N, Airoldi F, Michev I, Montorfano M, Sangiorgi GM, Bonizzoni E, Colombo A. Patterns of restenosis after drug-eluting stent implantation: insights from a contemporary and comparative analysis of sirolimus- and paclitaxel-eluting stents. Eur Heart J. 2006;27:2330–2337. doi: 10.1093/eurheartj/ehl229. [DOI] [PubMed] [Google Scholar]


