

Abstract
Urinary biomarkers, such as albumin and other markers of kidney injury, are frequently reported as a normalized ratio to urinary creatinine (UCr) concentration [UCr] to control for variations in urine flow rate. The implicit assumption is that UCr excretion is constant across and within individuals, such that changes in the ratio will reflect changes in biomarker excretion. Using computer simulations of creatinine kinetics, we found that normalized levels of a biomarker reflecting tubular injury can be influenced by dynamic changes in the UCr excretion rate when the glomerular filtration rate changes. Actual timed urine collections from hospitalized patients with changing glomerular filtration rates and/or critical illness exhibited variability in UCr excretion rates across and within individuals. Normalization by [UCr] may, therefore, result in an underestimation or overestimation of the biomarker excretion rate depending on the clinical context. Lower creatinine excretion in the setting of acute kidney injury or poor renal allograft function may amplify a tubular injury biomarker signal, thereby increasing its clinical utility. The variability of creatinine excretion, however, will complicate the determination of a threshold value for normalized biomarkers of acute or chronic kidney disease, including albumin. Thus, we suggest that the most accurate method to quantify biomarkers requires the collection of timed urine specimens to estimate the actual excretion rate, provided that the biomarker is stable over the period of collection. This ideal must be balanced, however, against practical considerations.
Keywords: acute kidney injury, acute renal failure, creatinine, creatinine clearance
Urinary biomarkers may provide sensitive and specific diagnostic tools for the identification of acute kidney injury (AKI). Urinary kidney injury molecule-1 (KIM-1), neutrophil gelatinase-associated lipocalin, N-acetyl-β-D-glucos-aminidase, interleukin-18, L-type fatty acid-binding protein, and a number of other markers are promising for early and accurate diagnosis of AKI1–3 and for the prediction of clinical outcomes.4–6
The kidney has the capacity to regulate water reabsorption over more than an order of magnitude range; hence, the urinary concentration of any putative biomarker is dependent not only on the biomarker excretion rate but also on the urinary flow rate. Owing to the effects of water reabsorption on urinary solute concentrations, urinary biomarker concentrations are commonly expressed as a ratio to the urinary creatinine (UCr) concentration—for example, albuminuria is expressed as the albumin-to-creatinine ratio.7 The underlying assumptions for this approach are that the UCr excretion rate is constant within an individual over time and across individuals, or that biomarker production or excretion has a linear relationship with UCr excretion across individuals. Although AKI biomarkers of tubular injury are often normalized to urine creatinine,1–4,8–12 the assumption of constant UCr excretion is not correct when renal function is rapidly changing or when comparing across individuals.
It is useful to consider the determinants of [UCr]. Creatinine is freely filtered at the glomerulus and secreted by tubules to varying degrees;13 in the case of AKI, creatinine may also backleak across the injured tubular epithelium back into the systemic circulation.14 Therefore, the amount excreted in the urine can be described as:
| (1) |
where [SCr] is ‘serum creatinine concentration,’ GFR ‘glomerular filtration rate,’ TScr ‘tubular secretion rate of creatinine,’ Bcr ‘backleak rate of creatinine,’ [UCr] ‘urinary creatinine concentration,’ and UFR ‘urinary flow rate.’ Neglecting tubular secretion and backleak, [UCr] is inversely proportional to UFR under steady-state conditions. As the urinary concentration of any biomarker is also inversely proportional to UFR for a given amount of total excreted biomarker, normalizing to [UCr] under steady-state conditions accounts for variations in UFR, assuming no effect of UFR on biomarker or creatinine excretion rate.
In at least four clinical settings, normalization to [UCr] may be misleading for urinary biomarkers: when comparing urinary biomarker excretion among individuals with (1) different creatinine generation rates or extrarenal degradation rates; (2) when GFR is changing and a steady state has not yet been achieved; (3) when creatinine secretion differs; and (4) when tubular backleak of creatinine differs.
These analyses were performed to explore the potential biases introduced by normalization to [UCr] due to changes in GFR both empirically in patients with or at risk of AKI, and from a theoretical perspective using a computer simulation of creatinine kinetics. We use the term creatinine clearance (CrCl) to encompass changes in GFR and tubular secretion and backleak of creatinine.
RESULTS
Simulations of AKI
To clarify the effects of changes in [UCr] alone on urinary biomarker determinations, we first assumed that there is no change in urinary biomarker excretion; we assumed an arbitrary biomarker excretion rate of 60 ng/h, a urinary flow rate of 0.6 dl/h, and an UCr excretion rate of 60 mg/h. The baseline concentration of the urinary biomarker is 60 ng/dl (absolute) and 1 ng/mg creatinine (normalized). Figure 1 shows the effects of severe AKI (abrupt reduction in CrCl from 100 to 10 ml/min) on SCr and the normalized urinary biomarker concentration, assuming no change in excretion of the biomarker. (It is noteworthy that changes in the biomarker concentration normalized to [UCr] are independent of changes in urine output, assuming that the concentrations of UCr and the biomarker are equally affected by changes in urine output.) Immediately after severe AKI, the UCr excretion rate decreases in proportion to the magnitude of the decrease in CrCl, thereby abruptly increasing the normalized biomarker level from 1 to 10 ng/ mg, despite a constant production and excretion rate of the biomarker. If urine samples are collected 4, 12, and 24 h later, the normalized urinary biomarker concentration remains elevated at 6.7, 4.2, and 2.8 ng/mg, respectively. An apparent 50% increase in the urinary biomarker level (that is, from 1.0 to 1.5 ng/mg) is still present 74 h after initiation of severe AKI.
Figure 1. Change in serum creatinine concentration (gray) and urine creatinine-normalized biomarker concentration (black) after severe acute kidney injury (acute decrease in creatinine clearance at time 0 from 100 to 10 ml/min).

The urinary biomarker production and excretion rates are assumed not to change; the effect on the normalized biomarker level is due to changes in urinary creatinine excretion rate.
In the case of less severe AKI (abrupt reduction in CrCl from 100 to 40 ml/min), increases in SCr and UCr-normalized biomarker concentrations are less pronounced but nevertheless significant (Figure 2). The immediate increase in the biomarker level to 2.5 ng/mg is again proportional to the magnitude of the reduction in CrCl. At 4, 12, and 24 h later, the normalized urinary biomarker concentration is 1.9, 1.4, and 1.2 ng/mg, respectively.
Figure 2. Change in serum creatinine concentration (gray) and urine creatinine-normalized biomarker concentration (black) after mild acute kidney injury (acute decrease in creatinine clearance at time 0 from 100 to 40 ml/min).

The urinary biomarker production and excretion rates are assumed not to change; the effect on the normalized biomarker level is due to changes in urinary creatinine excretion rate.
Recovery from AKI
Urinary biomarkers may be used to predict the duration of AKI or the probability of recovery. Therefore, we simulated recovery from severe AKI and the corresponding effects on a normalized urinary biomarker, the production rate of which does not change. Figure 3 shows results from a simulation in which severe AKI (abrupt reduction in CrCl from 100 to 10 ml/min) is followed 5 days later by recovery (linear increase in CrCl from 10 to 100 ml/min over 24 h). At the time that recovery begins, the normalized urinary biomarker levels decrease due to the increase in UCr excretion. Twelve hours after recovery begins, the normalized urinary biomarker concentration is 0.3 ng/mg, which is a 70% reduction from baseline values. Forty-eight hours after recovery has begun, the normalized urinary biomarker concentration approaches baseline values as steady state is approached.
Figure 3. Change in serum creatinine concentration (gray) and urine creatinine-normalized biomarker concentration (black) after severe acute kidney injury (acute decrease in creatinine clearance at time 0 from 100 to 10 ml/min, followed 5 days later by a linear increase to 100 ml/min over 24 h (diagonal arrow)).

The urinary biomarker production and excretion rates are assumed not to change; the effect on the normalized biomarker level is due to changes in urinary creatinine excretion rate.
Simulation of rapid recovery of renal function after kidney transplantation
Immediately after kidney transplantation, the UCr excretion rate increases in proportion to the increase in CrCl. The effect on an UCr-normalized biomarker is opposite to that seen after AKI and similar to that seen in recovery from AKI: the greater the improvement in CrCl, the lower the apparent normalized urinary biomarker level. Figure 4 shows changes in biomarker concentration normalized to [UCr] in prompt graft function (PGF), and delayed graft function (DGF). Estimates for model parameters such as urinary flow rate, creatinine clearance, and changes in volume of distribution in PGF and DGF up to 72 h following transplantation were taken from the physiological studies of Alejandro et al.15 In PGF, CrCl is assumed to increase linearly from 30 to 60 ml/min over 72 h. In DGF, CrCl is assumed to remain steady at 6 ml/min. For both, creatinine generation rate was set at 36 mg/h to approximate a pre-transplantation [SCr] of 10 mg/dL; urinary biomarker excretion was assumed to be 36 ng/h. Volume of distribution increased by 2.1l in PGF and 4l for DGF, accounting for the slight increase in the normalized urinary biomarker concentration in DGF despite a constant CrCl, in which CrCl increases from 10 to 12 ml/min. Despite equal excretion rates of a urinary biomarker, a patient with DGF will appear to have a higher urinary biomarker level than a patient with PGF in the first several hours after transplantation. If urine samples are collected at 4 h after transplant, a patient with DGF will have an UCr-normalized biomarker concentration more than five times higher than that of a patient with PGF (1.0 versus 0.2 ng/mg), despite no actual change or difference in kidney production of the biomarker. At 12 and 24 h after transplantation, the urinary biomarker level remains higher in DGF than in PGF (1.0 versus 0.3 ng/mg at 12 h; 1.0 versus 0.4 ng/mg at 24 h).
Figure 4. Changes in the urine creatinine-normalized biomarker concentration after prompt graft function and delayed graft function.

The urinary biomarker production and excretion rates are assumed not to change; the effect on the normalized biomarker level is due to changes in urinary creatinine excretion rate.
Timed urine collections
A straightforward method to eliminate many of the quantitative biases introduced by rapid changes in UCr is to collect timed samples of urine. Timed urine collections were performed in 12 kidney transplant recipients during the immediate postoperative period and 24 patients admitted to the intensive care unit. In 11 of the 24 intensive care unit patients, serial daily collections were performed. As shown in Table 1, extrapolated UCr excretion rates (assuming constant excretion rate over a period of 24 h) in the post-kidney transplant period varied substantially across patients, ranging from 238 mg/day in subject 6 (a recipient with DGF) to 2327 mg/day in subject 8 (a recipient with PGF). The low [UCr] in the patient with DGF led to a nearly four-fold higher urinary KIM-1/creatinine ratio (UKIM−1/Cr) compared with the 24 h extrapolated UKIM−1 excretion rate, predictably determined by the fact that UKIM−1/Cr is in units of nanogram KIM-1 per milligram of creatinine. Conversely, in the patient with PGF, the high [UCr] led to a more than two-fold lower [UKIM−1/Cr] compared with the 24 h UKIM−1 excretion rate. Substantial variability in extrapolated UCr excretion rates was also observed among intensive care unit patients (Table 2), ranging from 139 mg/day in subject 13, a 22-year-old, 61 kg patient with cystic fibrosis and respiratory failure, to 7198 mg/day in subject 15, a 72-year-old, 110 kg patient recovering from AKI. The comparisons between the [UKIM−1/Cr] and the extrapolated 24 h UKIM−1 excretion rate are also shown in Table 2. In Table 3, the results from serial urine collections are shown for five intensive care unit patients, three of whom had AKI and increasing SCr during the course of collection. In the three patients with AKI (subjects 27, 28, and 31), UCr excretion rates were low (< 700 mg/day) but relatively constant over the collection period. By contrast, subject 26 showed a more than three-fold increase in UCr excretion over a 4-day period, over which time the SCr level decreased from 1.0 to a nadir of 0.6 mg/dl. The comparisons between the UKIM−1/Cr and the extrapolated 24 h UKIM−1 excretion rate are shown graphically in Figure 5.
Table 1.
Timed urine collections for creatinine and KIM-1 measurement from patients undergoing kidney transplantation
| Subject | Age (years)/ sex/race | Weight (kg) | Original kidney disease, type of transplant | [SCr] (mg/dl) |
Renal function | Duration of collection (h), volume (ml) | [UCr], mg/ml | [UKIM−1], pg/ml | UCr excretion rate, mg/24 h | UKIM−1 excretion rate, μg/24 h | [UKIM−1/Cr], μg/g | |||
|---|---|---|---|---|---|---|---|---|---|---|---|---|---|---|
| POD 0 | POD 1 | POD 2 | POD 3 | |||||||||||
| 1 | 54/M/C | 68 | Polycystic kidney disease, LURT | 9.1 | 6.8 | 5.2 | 3.7 | PGF | 4.75, 1000 | 0.32 | 79.1 | 1607 | 0.40 | 0.25 |
| 2 | 64/M/C | 82 | FSGS, LURT | 5.6 | 3.5 | 1.9 | 1.7 | PGF | 6, 675 | 0.81 | 185 | 2198 | 0.50 | 0.23 |
| 3 | 25/F/C | 42 | Renal dysplasia, LRRT | 4.2 | 2.3 | 0.9 | 0.8 | PGF | 6, 850 | 0.26 | 59.4 | 887 | 0.20 | 0.23 |
| 4 | 55/M/C | 84 | Diabetic nephropathy, LURT | 9.4 | 5.3 | 5.0 | 4.8 | SGF | 6, 1450 | 0.19 | 180 | 1125 | 1.04 | 0.93 |
| 5 | 50/M/C | 84 | Polycystic kidney disease, LURT | 7.3 | 6.7 | 6.7 | 5.2 | SGF | 6, 1375 | 0.37 | 175 | 2046 | 0.96 | 0.47 |
| 6 | 65/F/AA | 84 | Diabetic nephropathy, LURT | 10.3 | 8.5 | 9.3 | 9.2 | DGF | 6, 50 | 1.19 | 5075 | 238 | 1.02 | 4.26 |
| 7 | 47/F/C | 57 | IgA nephropathy, LURT | 4.1 | 3.0 | 1.3 | 0.9 | PGF | 6, 475 | 0.57 | 965 | 1077 | 1.83 | 1.70 |
| 8 | 58/M/AA | 79 | Hypertension, LRRT | 7.8 | 5.3 | 2.4 | 1.6 | PGF | 6, 2300 | 0.25 | 362 | 2327 | 3.33 | 1.43 |
| 9 | 55/M/C | 107 | Renal hypoplasia, LRRT | 5.9 | 6.6 | 7.4 | 4.6 | DGF | 6, 300 | 0.36 | 834 | 431 | 1.00 | 2.32 |
| 10 | 43/F/C | 72 | Lupus nephritis, pre-emptive LRRT | 2.2 | 1.3 | 0.9 | 0.8 | PGF | 6, 1200 | 0.25 | 501 | 1176 | 2.40 | 2.04 |
| 11 | 63/F/C | 72 | Polycystic kidney disease, LRRT | 5.0 | 4.3 | 2.0 | 1.2 | PGF | 6, 775 | 0.60 | 147 | 1845 | 0.46 | 0.25 |
| 12 | 50/F/C | 66 | Hypertension, LURT | 4.3 | 2.5 | 1.9 | 1.3 | PGF | 6, 300 | 1.46 | 4505 | 1746 | 5.41 | 3.10 |
Abbreviations: AA, African American; C, Caucasian; DGF, delayed graft function; FSGS, focal segmental glomerulosclerosis; KIM-1, kidney injury molecule-1; LRRT, living related renal transplant; LURT, living unrelated renal transplant; POD, postoperative day; PGF, prompt graft function; SCr, serum creatinine; SGF, slow graft function; UCr, urinary creatinine; UKIM−1, urinary KIM-1; UKIM−1/cr, urinary KIM-1/creatinine.
Date of urine sample collection is denoted by underlined serum creatinine concentration.
Table 2.
Timed urine collections for creatinine and KIM-1 measurement from patients admitted to the intensive care unit
| Subject | Age (years)/ sex/race | Wt (kg) | Clinical details | SCr (mg/dl) |
AKI diagnosis | Duration of collection (h), volume (ml) | [UCr], mg/ml | [UKIM−1], pg/ml | UCr excretion rate, mg/24 h | UKIM−1 excretion rate, μg/24 h | [UKIM−1/cr], μg/g | |||
|---|---|---|---|---|---|---|---|---|---|---|---|---|---|---|
| Day-1 | Day 0 | Day 1 | Day 2 | |||||||||||
| 13 | 22/F/C | 61 | Cystic fibrosis, s/p lung transplant, admitted with pneumonia and respiratory failure | 1.0 | 1.0 | 1.0 | 0.8 | No AKI | 4, 125 | 0.19 | 307 | 139 | 0.23 | 1.66 |
| 14 | 64//F/C | 53 | Tumor lysis syndrome from AML blast crisis; sepsis | 1.0 | 0.9 | 0.9 | — | No AKI | 4, 575 | 0.12 | 664 | 400 | 2.29 | 5.72 |
| 15 | 72/M/C | 110 | Sepsis syndrome from Group B strep infection of prosthetic knee | 1.6 | 1.4 | 1.1 | 1.1 | Recovering from AKI | 4, 700 | 1.71 | 268 | 7198 | 1.13 | 0.16 |
| 16 | 69/F/C | 81 | Myasthenia gravis crisis, pyelonephritis | 1.7 | 1.4 | 1.1 | 1.1 | Recovering from AKI | 6, 275 | 0.83 | 1015 | 916 | 1.12 | 1.22 |
| 17 | 65/M/C | 72 | Burkitt’s lymphoma, AKI from sepsis | 2.5 | 1.9 | 1.9 | 1.9 | Established AKI | 6, 1130 | 0.31 | 1926 | 1405 | 8.71 | 6.19 |
| 18 | 45/F/C | 45 | Metastatic breast cancer, perforated duodenal ulcer | 0.5 | 0.6 | 0.6 | 0.6 | No AKI | 6, 575 | 0.20 | 186 | 469 | 0.43 | 0.91 |
| 19 | 79/M/C | 67 | Aspiration pneumonia and sepsis after bowel surgery | 1.2 | 1.3 | 1.1 | 1.0 | No AKI | 6, 300 | 1.30 | 1093 | 1559 | 1.31 | 0.84 |
| 20 | 60/F/C | 89 | Metastatic endometrial cancer, ventilatory failure, and sepsis | 0.6 | 0.6 | — | No AKI | 6, 245 | 0.90 | 4793 | 886 | 4.70 | 5.30 | |
| 21 | 21/M/A | 68 | Septic pulmonary emboli from jugular vein suppurative thrombophlebitis | 0.6 | 0.6 | 0.6 | 0.5 | No AKI | 6, 375 | 1.08 | 5938 | 1620 | 8.91 | 5.50 |
| 22 | 54/F/C | 68 | Post-op from bilateral lung transplant for idiopathic pulmonary fibrosis | 0.9 | 0.9 | 1.1 | 1.0 | No AKI | 6, 900 | 0.23 | 741 | 824 | 2.67 | 3.24 |
| 23 | 65/F/C | 50 | Chronic obstructive pulmonary disease exacerbation | 0.6 | 0.6 | 0.7 | 0.9 | No AKI | 6, 1075 | 0.14 | 411 | 611 | 1.77 | 2.89 |
| 24 | 60/M/C | 68 | Respiratory failure from acute interstitial pneumonitis | 0.5 | 0.7 | 0.6 | 1.2 | AKI | 6, 300 | 0.80 | 1953 | 961 | 2.34 | 2.43 |
| 25 | 75/F/C | 113 | Chronic obstructive pulmonary disease exacerbation | 1.6 | 1.4 | 1.1 | 0.8 | Recovering from AKI | 6, 550 | 0.58 | 2480 | 1283 | 5.46 | 4.25 |
Abbreviations: A, Asian; AKI, acute kidney injury; AML, acute myelogenous leukemia; C, Caucasian; KIM-1, kidney injury molecule-1; SCr, serum creatinine; UCr, urinary creatinine; UKIM−1, urinary KIM-1; UKIM−1/cr, urinary KIM-1/creatinine.
Day 0 for serum creatinine measurement corresponds to the date of urine sample collection. (−) denotes date of death.
Table 3.
Serial urine collections in patients admitted to the intensive care unit
| Subject | Age (years)/ sex/ race | [SCr] (mg/dl) | Duration of collection (h), volume (ml) | [UCr], mg/ml | [UKIM−1], pg/ml | UCr excretion rate, mg/24 h | UKIM−1 excretion rate, lg/24 h | [UKIM−1/Cr], lg/g |
|---|---|---|---|---|---|---|---|---|
| 26 | 71/M/C, subdural hematoma; weight 90 kg | |||||||
| Day 31 | 1.0 | — | ||||||
| Day 0 | 0.8 | 6, 350 | 0.61 | 527 | 857 | 0.74 | 0.86 | |
| Day 1 | 0.7 | 6, 300 | 1.88 | 3028 | 2251 | 3.63 | 1.61 | |
| Day 2 | 0.6 | 6, 775 | 1.12 | 1580 | 3460 | 4.89 | 1.41 | |
| Day 3 | 0.7 | 6, 600 | 1.09 | 1111 | 2604 | 2.67 | 1.02 | |
| 27 | 46/F/AA, cirrhosis, septic shock, AKI; weight 50 kg | |||||||
| Day 31 | 0.8 | — | ||||||
| Day 0 | 1.2 | 4, 100 | 0.55 | 1765 | 328 | 1.06 | 3.23 | |
| Day 1 | 1.7 | 6, 150 | 0.44 | 1051 | 262 | 0.63 | 2.41 | |
| Day 2 | 2 | 6, 150 | 0.41 | 987 | 247 | 0.59 | 2.40 | |
| 28 | 62/F/C, lung transplant recipient, hypoxemic respiratory failure, pneumonia, AKI; weight 58 kg | |||||||
| Day 31 | 1.6 | — | ||||||
| Day 0 | 2.4 | 4, 80 | 1.09 | 1046 | 523 | 0.50 | 0.96 | |
| Day 1 | 2.6 | 5, 250 | 0.40 | 225 | 475 | 0.27 | 0.57 | |
| Day 2 | 3.3 | 4, 200 | 0.57 | 295 | 682 | 0.35 | 0.52 | |
| 29 | 59/M/C; CLL, hypoxemic respiratory failure, pneumonia; weight 69 kg | |||||||
| Day 31 | 0.8 | — | ||||||
| Day 0 | 0.8 | 6, 475 | 0.41 | 2440 | 771 | 4.63 | 6.01 | |
| Day 1 | 0.8 | 4, 1050 | 0.15 | 1091 | 945 | 6.87 | 7.27 | |
| 30 | 56/M/C, morbid obesity, postoperative from surgical revision of gastric bypass; weight 158 kg | |||||||
| Day 31 | 0.8 | — | ||||||
| Day 0 | 0.7 | 6, 275 | 1.68 | 3636 | 1844 | 4.0 | 2.17 | |
| Day 1 | 0.7 | 6, 375 | 1.41 | 2282 | 2112 | 3.4 | 1.62 | |
| 31 | 48/M/C; myelodysplastic syndrome, hypoxemic respiratory failure, pneumonia, sepsis; weight 82 kg | |||||||
| Day 31 | 1.1 | — | ||||||
| Day 0 | 1.8 | 6, 450 | 0.10 | 3258 | 175 | 5.87 | 33.59 | |
| Day 1 | 2.2 | 6, 100 | 0.08 | 4607 | 32 | 1.84 | 57.58 | |
| Day 2 | 2.8 | 6, 20 | 0.06 | 6620 | 5 | 0.53 | 106.78 | |
| 32 | 69/F/C; hypoxemic respiratory failure and septic shock; weight 58 kg | |||||||
| Day 31 | 0.6 | — | ||||||
| Day 0 | 0.8 | 6, 315 | 0.56 | 2174 | 702 | 2.74 | 3.90 | |
| Day 1 | 0.7 | 4, 150 | 0.49 | 1246 | 442 | 1.12 | 2.54 | |
| Day 2 | 0.8 | 6, 310 | 0.50 | 2954 | 615 | 3.66 | 5.95 | |
| 33 | 75/F/C; NSTEMI, hypoxemic and hypercarbic respiratory failure; weight 76 kg | |||||||
| Day 31 | 1.0 | — | ||||||
| Day 0 | 0.9 | 5, 550 | 0.42 | 413 | 1106 | 1.09 | 0.99 | |
| Day 1 | 1.2 | 6, 400 | 0.83 | 941 | 1333 | 1.51 | 1.13 | |
| 34 | 64/F/AA; cardiac arrest from ventricular fibrillation from unclear cause, also anoxic brain injury; weight 145 kg | |||||||
| Day 31 | 1.6 | — | ||||||
| Day 0 | 1.2 | 6, 400 | 0.61 | 1814 | 974 | 2.90 | 2.98 | |
| Day 1 | 1.2 | 6, 275 | 0.99 | 1095 | 1087 | 1.20 | 1.11 | |
| 35 | 48/F/C; cardiopulmonary arrest after choking on foreign object; weight 60 kg | |||||||
| Day 31 | 0.7 | |||||||
| Day 0 | 0.7 | 6, 410 | 0.61 | 2547 | 1005 | 4.18 | 4.16 | |
| Day 1 | 0.7 | 6, 775 | 0.38 | 879 | 1187 | 2.72 | 2.29 | |
| Day 2 | 0.7 | 6, 950 | 0.35 | 329 | 1326 | 1.24 | 0.94 | |
| Day 3 | 0.6 | 6, 350 | 0.78 | 784 | 1089 | 1.10 | 1.01 | |
| 36 | 61/M/C; small bowel resection for obstruction, also TTP with renal failure; weight 86 kg | |||||||
| Day 31 | 4.4 | — | ||||||
| Day 0 | 3.6 | 6, 20 | 1.77 | 4961 | 141 | 0.40 | 2.81 | |
| Day 1 | 3.7 | 5, 30 | 1.24 | 13,824 | 179 | 1.66 | 11.11 | |
| Day 2 | 3.8 | 6, 175 | 1.18 | 10,400 | 823 | 7.28 | 8.84 | |
Abbreviations: AA, African American; AKI, acute kidney injury; C, Caucasian; CLL, chronic lymphocytic leukemia; NSTEMI, non-ST-elevation myocardial infarction; SCr, serum creatinine; TTP, thrombotic thrombocytopenic purpura; UCr, urinary creatinine; UKIM−1, urinary KIM-1; UKIM−1/cr, urinary KIM-1/creatinine.
Daily urine sample collection began on day 0.
Figure 5. Graphical comparison of extrapolated 24 h urinary KIM-1 excretion rate (y axis) versus normalized urinary KIM-1/ creatinine ratio.
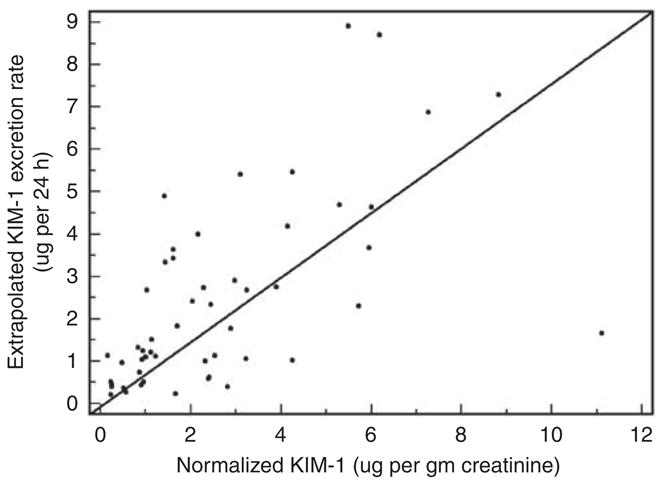
The solid diagonal line represents the line of identity. Three outlier measurements from subject #31 are excluded (see Table 3). KIM-1, kidney injury molecule-1.
DISCUSSION
We have addressed quantitatively the implications of using UCr to normalize urinary biomarker levels. The pitfalls of reporting absolute concentrations of a urinary biomarker are easy to appreciate: oliguria will cause an increase, and polyuria a decrease, in the absolute concentration of a biomarker, the production and excretion rates of which are constant. Normalizing a urinary biomarker concentration to UCr takes into account differences in urinary flow rate. However, when normalizing, one must also take into consideration the other determinant of [UCr]: the rate of creatinine excretion by the kidney. Under nonsteady-state conditions such as AKI and kidney transplantation, the UCr excretion rate changes over time; unless the biomarker under consideration behaves exactly like creatinine (that is, filtered, secreted to some extent, not normally reabsorbed), the normalized level will be affected by differences in UCr excretion. The phenomena depicted in our simulation studies were supported by the results obtained from timed urine samples in patients with AKI and after kidney transplantation. Furthermore, baseline levels of UCr excretion may vary considerably across individuals, as demonstrated in our timed samples obtained from patients with stable SCr.
The implicit assumptions underlying the practice of reporting ‘normalized’ urinary biomarkers deserve to be highlighted. Assuming that the UCr excretion rate in healthy individuals is ~1 g/day, the ratio between a urinary biomarker and the [UCr] is considered clinically to approximate the 24 h excretion rate of the biomarker (in this example, ng/day).16 UCr excretion is in fact not uniformly 1 g/day across individuals and even within the same individual over time. Dynamic changes in UCr excretion and baseline differences in UCr excretion—as demonstrated in our timed samples—will proportionally influence the normalized level of a urinary biomarker even if the actual biomarker excretion rate (per 24 h or any unit of time) is unchanged. It is worthwhile to consider how normalization may complicate the interpretation of urinary biomarker levels under steady-state conditions (for example, when comparing levels in those with stable SCr levels) and under nonsteady-state conditions (for example, in AKI and after kidney transplantation).
In the steady state, UCr excretion is constant but may differ from one individual to the next. Unless the expected normal biomarker excretion rate is assumed to be linearly related to the UCr excretion rate (for example, if it is a proxy for renal mass), differences in UCr excretion will bias the normalized level of a urinary biomarker. For example, if two individuals each have a normalized biomarker level of 1 ng/mg, but one excretes 500 mg and the other 2000 mg of creatinine per day, the actual extrapolated biomarker excretion rate will be 0.5 and 2.0 ng/day, respectively. The critical issue in this instance is which determination is more believable: do the two individuals differ by fourfold (as would be predicted by a 24-h timed collection) or are they equivalent (as predicted by the normalized value) in whatever biological process is being estimated by the biomarker? The answer to this question may vary depending on the biomarker tested and the population in which it is being tested. For the purpose of comparing urinary biomarker levels in children versus adults, for example, normalization to [UCr] may be reasonable, if biomarker excretion capacity is believed to have some linear relationship with body size (which in turn has a rough relationship with UCr excretion rate). However, when comparing adults, the answer may not be as straightforward. UCr excretion is variable across individuals and even within the same individual. For example, African Americans have generally higher SCr levels than do Whites across the spectrum of kidney disease,17,18 believed to be due to differences in creatinine generation rate, and therefore higher UCr excretion rates. In addition, patients with chronic kidney disease (CKD) have lower rates of UCr excretion than do those without CKD,19 and creatinine excretion rates may decline during progression of kidney disease,20 due to an increase in extrarenal degradation of creatinine. Furthermore, UCr excretion also shows within-person variability, with estimates for intra-individual coefficients of variation (CVs) for repeated 24 h urine collections ranging from 10.5 to 14.4%.21,22 Other studies have also suggested diurnal variation in creatinine excretion and/or variability hour to hour and day to day.21,23–27 One study28 of 12 individuals (including the authors of the study), admitted to a research ward for six 24 h urine collections, demonstrated intra-individual CVs ranging from 3.7 to 14.3% for 24 h collections, and 9.4–27.1% for 4- and 8-h collections. (A 10% CV around a mean of 1 g/day corresponds to 95% confidence interval of 804–1196 mg/day, whereas a 20% CV corresponds to a 95% confidence interval of 608–1392 mg/day.)
Even the interpretation of urinary albumin:creatinine concentration may be confounded by inter-individual differences in creatinine generation rate: although a small amount of albumin may be filtered by the glomerulus, its metabolism in the tubules differs from that of creatinine (that is, albumin is catabolized, whereas creatinine is secreted), and its plasma levels do not depend mainly on kidney excretion as is the case for creatinine.29 Cirillo et al.30 reported that high urinary albumin:creatinine ratio in individuals with low muscle mass more commonly indicates low UCr excretion rather than true microalbuminuria and cardiovascular disease. Even in the case of filtered biomarkers (such as the toxin 1-hydroxypyrene, for which creatinine normalization has been argued to be valid31), differences in tubular secretion of creatinine across individuals may confound comparisons of normalized biomarker levels.
Under nonsteady-state conditions, the differences in UCr excretion can be even more marked, as shown in our timed collections in patients with AKI and after kidney transplantation. The extrapolated UCr excretion rates ranged from under 100 mg/day in a patient with oliguric AKI from septic shock to more than 7000 mg/day in a patient recovering from AKI. Among the kidney transplant recipients, the extrapolated UCr excretion rates ranged from under 300 mg/day in a patient with DGF to more than 2100 mg/day in a patient with PGF. Extremely low [UCr], such as the measurement of 0.06 mg/mL in subject #31, may arise from significant tubular backleak and result in a distortion of normalized biomarker levels.
Limitations of our simulation studies include the use of constant creatinine generation rates across individuals and not modeling tubular secretion of creatinine or its backleak across the injured tubular epithelium. To model creatinine handling more precisely would require knowledge of extrarenal degradation rate (which can be substantial in CKD32), generation rate (which likely varies in CKD and acute illness33), rate of tubular secretion (which increases proportionally as GFR decreases34 and which may be impaired in the posttransplanted ischemic allograft35), and the rate of tubular backleak of creatinine in the case of ischemic injury. Values for these parameters may vary from one individual to another and in different clinical states. Nevertheless, simulation studies have provided a depiction of the dynamic changes in UCr excretion due to changing CrCl, and how those changes in [UCr] can influence the normalized level of a urinary biomarker. Our urine sample collection in hospitalized individuals was performed from indwelling urinary catheters, thereby limiting errors in collecting the entirety of the urine sample. Although some urine in the tubing may have been inadvertently omitted from the timed collection, the inaccuracies are unlikely to be large enough to qualitatively affect our results, which demonstrate a wide range in UCr excretion rates.
A single normalized urinary biomarker measurement from an individual needs to be seen as a point estimate of a range of probable values for the actual excretion rate. The range derives not just from analytical variability in biomarker measurement and biological variability in biomarker production and excretion but also from variability in creatinine excretion rate, which can be substantial. If it was possible to accurately predict UCr excretion rates based on clinical variables such as age, weight, sex, and race, then creatinine-normalized biomarker values could be appropriately adjusted. This area deserves further investigation. In critically ill patients and in those expected not to be in the steady state, dynamic changes in creatinine excretion are superimposed upon baseline differences. Therefore, it may be useful to examine changes in normalized biomarker levels compared with baseline, to account for inter-individual differences in baseline UCr excretion rates. Dynamic changes within individuals may still affect the normalized values due to changes in CrCl. On the basis of our results, we suggest that a reasonable minimum threshold for validation in AKI studies may be a two-fold change from baseline in normalized biomarker values: lower changes from baseline may arise from dynamic changes in UCr excretion, particularly if samples are obtained during the early period when GFR is changing rapidly.
We have confirmed that the implicit assumption of constant UCr excretion is deeply flawed in hospitalized individuals. We have demonstrated marked variability across and within individuals in the settings of AKI, kidney transplantation, and critical illness. In some clinical settings, the effect of the denominator ([UCr]) on normalized biomarker levels may serve the clinically useful purpose of amplifying the signal of an injury biomarker: in AKI and DGF, for example, the normalized ratio increases as [UCr] decreases. As the concentrations of urinary biomarkers of injury and [UCr] are expected to move in opposite directions in renal recovery and renal injury, the normalized ratio does have the potentially added benefit of amplifying a biomarker signal. However, in hospitalized individuals, particularly in the determination of reference ranges in critically ill patients with and without kidney injury, timed collections would seem to be justified on the basis of the considerations presented in this study. Another reasonable approach would be normalizing to the observed urinary flow rate at the time of collection to determine the biomarker excretion rate.
How, then, should investigators and clinicians report and interpret the levels of kidney injury biomarkers? Absolute concentrations may be misleading because of differences in urinary flow rate, whereas creatinine normalization may be misleading because of differences in UCr excretion rate. Timed collections—as performed in this study—provide an estimate of biomarker excretion rate, which is probably the most comparable value from one individual to the next, or over time within an individual, if the biomarker under investigation is known to be stable over the time period of collection (as has been shown for KIM-136 and creatinine37). There are obvious practical limitations to timed collections, however, especially in the ambulatory setting. However, in biomarker studies of CKD, investigators should consider the possible effect of decreased UCr excretion if normalized biomarker levels are found to be higher in those with more advanced CKD.
In conclusion, investigators should consider that normalized values of urinary biomarkers may be profoundly affected by variability in UCr excretion rates. In some scenarios, normalization may amplify the signal of a biomarker, potentially enhancing its utility as a diagnostic tool. In others, spurious and misleading interpretations may develop from an uncritical acceptance of a normalized value.
MATERIALS AND METHODS
Simulation studies
According to basic mass balance principles, the change in the amount of creatinine in the body over time Δt is equal to the amount of creatinine generated over time Δt minus the amount of creatinine excreted over time Δt. Let G be the generation rate of creatinine; C, the serum creatinine concentration; V, the volume of distribution of creatinine; and K, creatinine clearance. (For simplicity, we have omitted tubular secretion of creatinine, extrarenal degradation of creatinine, and possible backleak of creatinine across the injured tubular epithelium.) In a single compartment model, as Δt approaches 0, the following differential equation can be written:
Applying the product rule:
Rearranging this equation:
| (2) |
The creatinine excretion rate (KC) divided by the urinary flow rate is equal to the instantaneous UCr concentration at any time t. To investigate the effect of normalizing urinary biomarker concentrations to [UCr], we assumed the null hypothesis—that is, that a theoretical biomarker was excreted at a constant rate, irrespective of CrCl, urinary flow rate, or the development of AKI. The biomarker excretion rate divided by the urinary flow rate is equal to the urinary biomarker concentration. Dividing the urinary biomarker concentration by [UCr] is the ‘normalized’ urinary concentration of the urinary biomarker, which is not affected by the urinary flow rate.
We used the software packages Matlab and Simulink (The Mathworks, Natick MA, USA), a graphical environment that enables simulation of time-varying systems. The simulations permitted independent adjustment of all of the determinants of serum and urinary creatinine concentrations: clearance rate, volume of distribution and its change over time, generation rate, and urinary flow rate. With this simulation, we were able to investigate the effects of normalizing or not normalizing the urinary concentration of a secreted biomarker in simulations of changing CrCl, volume of distribution, and urinary flow rate. We used a variable step continuous solver using the fourth-order integration technique of Runge–Kutta to simulate creatinine kinetics. The maximum step size was set at 6 min. We confirmed that the model simulated in Simulink produced identical results for serum creatinine (to the fourth decimal place) compared with directly calculated values from the solution of differential equation (2), assuming no change in volume of distribution: C(t) = G/K + [C0 − G/K] × e−Kt/V.
Timed urine collections in hospitalized patients
Timed urine samples were obtained from hospitalized patients with indwelling Foley catheters. Individuals provided written informed consent, and the protocol was approved by the BWH (Brigham and Women’s Hospital) Institutional Review Board. For each collection, the Foley catheter and tubing was emptied of urine before the timed collection. At the end of the timed collection, the entire volume of urine in the Foley catheter and tubing was drained. The volume of collected urine was noted and an aliquot from the entire volume was obtained for biomarker analyses. Urine samples were centrifuged at 3200 r.p.m. and the supernatant was stored at −80°C in 1.8 ml Eppendorf tubes. Within 3 months of collection, urine samples were thawed, vortexed, and centrifuged at 14,000 r.p.m. at 4°C and 30–100 μl of the supernatant was pipetted for biomarker measurements. UCr was measured in the BWH clinical laboratory by the Jaffe assay using the Roche/Hitachi Cobas C system (Roche Diagnostics, Indianapolis, IN, USA). Urinary KIM-1 concentration was measured using a microbead assay as described previously.38 For each timed collection, we calculated the extrapolated 24 h excretion rate of creatinine and KIM-1 (concentration × volume × 24 h/time of collection), as well as the creatinine-normalized KIM-1 concentration (KIM-1 concentration/urine creatinine concentration). AKI was defined as a ≥ 50% increase in SCr over baseline or admission values. DGF was defined as a < 10% decrease in SCr per day for the first 3 days after transplantation. PGF was defined as a > 50% decrease in SCr within 3 days after transplantation. SGF was defined as a < 50% decrease in SCr within 3 days after transplantation, excluding those who met the criteria for DGF.
Acknowledgments
This work is funded by NIH Grants R33DK074099, K23075941, and U01DK085660.
Footnotes
DISCLOSURE
JVB is a co-inventor on KIM-1 patents which Partners HealthCare has licensed to Biogen Idec, Genzyme, and Johnson and Johnson.
References
- 1.Han WK, Bailly V, Abichandani R, et al. Kidney injury molecule-1 (KIM-1): a novel biomarker for human renal proximal tubule injury. Kidney Int. 2002;62 :237–244. doi: 10.1046/j.1523-1755.2002.00433.x. [DOI] [PubMed] [Google Scholar]
- 2.Mishra J, Dent C, Tarabishi R, et al. Neutrophil gelatinase-associated lipocalin (NGAL) as a biomarker for acute renal injury after cardiac surgery. Lancet. 2005;365:1231–1238. doi: 10.1016/S0140-6736(05)74811-X. [DOI] [PubMed] [Google Scholar]
- 3.Parikh CR, Jani A, Melnikov VY, et al. Urinary interleukin-18 is a marker of human acute tubular necrosis. Am J Kidney Dis. 2004;43:405–414. doi: 10.1053/j.ajkd.2003.10.040. [DOI] [PubMed] [Google Scholar]
- 4.Liangos O, Perianayagam MC, Vaidya VS, et al. Urinary N-acetyl-beta-(D)-glucosaminidase activity and kidney injury molecule-1 level are associated with adverse outcomes in acute renal failure. J Am Soc Nephrol. 2007;18:904–912. doi: 10.1681/ASN.2006030221. [DOI] [PubMed] [Google Scholar]
- 5.Washburn KK, Zappitelli M, Arikan AA, et al. Urinary interleukin-18 is an acute kidney injury biomarker in critically ill children. Nephrol Dial Transplant. 2008;23:566–572. doi: 10.1093/ndt/gfm638. [DOI] [PubMed] [Google Scholar]
- 6.Ferguson MA, Vaidya VS, Waikar SS, et al. Urinary liver-type fatty acid-binding protein predicts adverse outcomes in acute kidney injury. Kidney Int. 2010;77:708–714. doi: 10.1038/ki.2009.422. [DOI] [PMC free article] [PubMed] [Google Scholar]
- 7.Levey AS, Eckardt KU, Tsukamoto Y, et al. Definition and classification of chronic kidney disease: a position statement from Kidney Disease: Improving Global Outcomes (KDIGO) Kidney Int. 2005;67:2089–2100. doi: 10.1111/j.1523-1755.2005.00365.x. [DOI] [PubMed] [Google Scholar]
- 8.Parikh CR, Jani A, Mishra J, et al. Urine NGAL and IL-18 are predictive biomarkers for delayed graft function following kidney transplantation. Am J Transplant. 2006;6:1639–1645. doi: 10.1111/j.1600-6143.2006.01352.x. [DOI] [PubMed] [Google Scholar]
- 9.Zappitelli M, Washburn KK, Arikan AA, et al. Urine neutrophil gelatinase-associated lipocalin is an early marker of acute kidney injury in critically ill children: a prospective cohort study. Crit Care. 2007;11 :R84. doi: 10.1186/cc6089. [DOI] [PMC free article] [PubMed] [Google Scholar]
- 10.Blaikley J, Sutton P, Walter M, et al. Tubular proteinuria and enzymuria following open heart surgery. Intensive Care Med. 2003;29:1364–1367. doi: 10.1007/s00134-003-1876-y. [DOI] [PubMed] [Google Scholar]
- 11.Eijkenboom JJ, van Eijk LT, Pickkers P, et al. Small increases in the urinary excretion of glutathione S-transferase A1 and P1 after cardiac surgery are not associated with clinically relevant renal injury. Intensive Care Med. 2005;31:664–667. doi: 10.1007/s00134-005-2608-2. [DOI] [PubMed] [Google Scholar]
- 12.Herget-Rosenthal S, Poppen D, Husing J, et al. Prognostic value of tubular proteinuria and enzymuria in nonoliguric acute tubular necrosis. Clin Chem. 2004;50:552–558. doi: 10.1373/clinchem.2003.027763. [DOI] [PubMed] [Google Scholar]
- 13.Brenner BM, Rector FC. Brenner & Rector’s the Kidney. Saunders Elsevier; Philadelphia: 2008. [Google Scholar]
- 14.Myers BD, Hilberman M, Spencer RJ, et al. Glomerular and tubular function in non-oliguric acute renal failure. Am J Med. 1982;72:642–649. doi: 10.1016/0002-9343(82)90475-2. [DOI] [PubMed] [Google Scholar]
- 15.Alejandro V, Scandling JD, Jr, Sibley RK, et al. Mechanisms of filtration failure during postischemic injury of the human kidney: a study of the reperfused allograft. J Clin Invest. 1995;95:820–831. doi: 10.1172/JCI117732. [DOI] [PMC free article] [PubMed] [Google Scholar]
- 16.Ginsberg JM, Chang BS, Matarese RA, et al. Use of single voided urine samples to estimate quantitative proteinuria. N Engl J Med. 1983;309:1543–1546. doi: 10.1056/NEJM198312223092503. [DOI] [PubMed] [Google Scholar]
- 17.Jones CA, McQuillan GM, Kusek JW, et al. Serum creatinine levels in the US population: third National Health and Nutrition Examination Survey. Am J Kidney Dis. 1998;32:992–999. doi: 10.1016/s0272-6386(98)70074-5. [DOI] [PubMed] [Google Scholar]
- 18.Hsu J, Johansen KL, Hsu CY, et al. Higher serum creatinine concentrations in black patients with chronic kidney disease: beyond nutritional status and body composition. Clin J Am Soc Nephrol. 2008;3:992–997. doi: 10.2215/CJN.00090108. [DOI] [PMC free article] [PubMed] [Google Scholar]
- 19.Mitch WE, Collier VU, Walser M. Creatinine metabolism in chronic renal failure. Clin Sci (Lond) 1980;58:327–335. doi: 10.1042/cs0580327. [DOI] [PubMed] [Google Scholar]
- 20.Levey AS, Berg RL, Gassman JJ, et al. Creatinine filtration, secretion and excretion during progressive renal disease. Modification of Diet in Renal Disease (MDRD) Study Group. Kidney Int Suppl. 1989;27:S73–S80. [PubMed] [Google Scholar]
- 21.Greenblatt DJ, Ransil BJ, Harmatz JS, et al. Variability of 24-h urinary creatinine excretion by normal subjects. J Clin Pharmacol. 1976;16:321–328. doi: 10.1002/j.1552-4604.1976.tb01527.x. [DOI] [PubMed] [Google Scholar]
- 22.Newman DJ, Pugia MJ, Lott JA, et al. Urinary protein and albumin excretion corrected by creatinine and specific gravity. Clin Chim Acta. 2000;294:139–155. doi: 10.1016/s0009-8981(00)00181-9. [DOI] [PubMed] [Google Scholar]
- 23.Paterson N. Relative constancy of 24-h urine volume and 24-h creatinine output. Clin Chim Acta. 1967;18:57–58. doi: 10.1016/0009-8981(67)90245-8. [DOI] [PubMed] [Google Scholar]
- 24.Singh R, Singh RK, Mahdi AA, et al. Circadian periodicity of urinary volume, creatinine and 5-hydroxyindole acetic acid excretion in healthy Indians. Life Sci. 2000;66:209–214. doi: 10.1016/s0024-3205(99)00582-2. [DOI] [PubMed] [Google Scholar]
- 25.Greenberg GN, Levine RJ. Urinary creatinine excretion is not stable: a new method for assessing urinary toxic substance concentrations. J Occup Med. 1989;31:832–838. doi: 10.1097/00043764-198910000-00008. [DOI] [PubMed] [Google Scholar]
- 26.Chattaway FW, Hullin RP, Odds FC. The variability of creatinine excretion in normal subjects, mental patients and pregnant women. Clin Chim Acta. 1969;26:567–576. doi: 10.1016/0009-8981(69)90089-8. [DOI] [PubMed] [Google Scholar]
- 27.Albanese AA, Wangerin DM. The creatine and creatinine excretion of normal adult males. Science. 1944;100:58–60. doi: 10.1126/science.100.2586.58. [DOI] [PubMed] [Google Scholar]
- 28.Curtis G, Fogel M. Creatinine excretion: diurnal variation and variability of whole and part-day measures. A methodologic issue in psychoendocrine research. Psychosom Med. 1970;32:337–350. doi: 10.1097/00006842-197007000-00001. [DOI] [PubMed] [Google Scholar]
- 29.Katz J, Rosenfeld S, Sellers AL. Role of the kidney in plasma albumin catabolism. Am J Physiol. 1960;198:814–818. doi: 10.1152/ajplegacy.1960.198.4.814. [DOI] [PubMed] [Google Scholar]
- 30.Cirillo M, Laurenzi M, Mancini M, et al. Low muscular mass and overestimation of microalbuminuria by urinary albumin/creatinine ratio. Hypertension. 2006;47:56–61. doi: 10.1161/01.HYP.0000197953.91461.95. [DOI] [PubMed] [Google Scholar]
- 31.Viau C, Lafontaine M, Payan JP. Creatinine normalization in biological monitoring revisited: the case of 1-hydroxypyrene. Int Arch Occup Environ Health. 2004;77:177–185. doi: 10.1007/s00420-003-0495-9. [DOI] [PubMed] [Google Scholar]
- 32.Hankins DA, Babb AL, Uvelli DA, et al. Creatinine degradation I: the kinetics of creatinine removal in patients with chronic kidney disease. Int J Artif Organs. 1981;4:35–39. [PubMed] [Google Scholar]
- 33.Doi K, Yuen PS, Eisner C, et al. Reduced production of creatinine limits its use as marker of kidney injury in sepsis. J Am Soc Nephrol. 2009;20:1217–1221. doi: 10.1681/ASN.2008060617. [DOI] [PMC free article] [PubMed] [Google Scholar]
- 34.Shemesh O, Golbetz H, Kriss JP, et al. Limitations of creatinine as a filtration marker in glomerulopathic patients. Kidney Int. 1985;28:830–838. doi: 10.1038/ki.1985.205. [DOI] [PubMed] [Google Scholar]
- 35.Corrigan G, Ramaswamy D, Kwon O, et al. PAH extraction and estimation of plasma flow in human postischemic acute renal failure. Am J Physiol. 1999;277:F312–F318. doi: 10.1152/ajprenal.1999.277.2.F312. [DOI] [PubMed] [Google Scholar]
- 36.Han WK, Wagener G, Zhu Y, et al. Urinary biomarkers in the early detection of acute kidney injury after cardiac surgery. Clin J Am Soc Nephrol. 2009;4 :873–882. doi: 10.2215/CJN.04810908. [DOI] [PMC free article] [PubMed] [Google Scholar]
- 37.Spierto FW, Hannon WH, Gunter EW, et al. Stability of urine creatinine. Clin Chim Acta. 1997;264:227–232. doi: 10.1016/s0009-8981(97)00080-6. [DOI] [PubMed] [Google Scholar]
- 38.Vaidya VS, Waikar SS, Ferguson MA, et al. Urinary biomarkers for sensitive and specific detection of acute kidney injury in humans. Clin Transl Sci. 2008;1:200–208. doi: 10.1111/j.1752-8062.2008.00053.x. [DOI] [PMC free article] [PubMed] [Google Scholar]