

Abstract
Motivation: High-throughput protein interaction data, with ever-increasing volume, are becoming the foundation of many biological discoveries, and thus high-quality protein–protein interaction (PPI) maps are critical for a deeper understanding of cellular processes. However, the unreliability and paucity of current available PPI data are key obstacles to the subsequent quantitative studies. It is therefore highly desirable to develop an approach to deal with these issues from the computational perspective. Most previous works for assessing and predicting protein interactions either need supporting evidences from multiple information resources or are severely impacted by the sparseness of PPI networks.
Results: We developed a robust manifold embedding technique for assessing the reliability of interactions and predicting new interactions, which purely utilizes the topological information of PPI networks and can work on a sparse input protein interactome without requiring additional information types. After transforming a given PPI network into a low-dimensional metric space using manifold embedding based on isometric feature mapping (ISOMAP), the problem of assessing and predicting protein interactions is recasted into the form of measuring similarity between points of its metric space. Then a reliability index, a likelihood indicating the interaction of two proteins, is assigned to each protein pair in the PPI networks based on the similarity between the points in the embedded space. Validation of the proposed method is performed with extensive experiments on densely connected and sparse PPI network of yeast, respectively. Results demonstrate that the interactions ranked top by our method have high-functional homogeneity and localization coherence, especially our method is very efficient for large sparse PPI network with which the traditional algorithms fail. Therefore, the proposed algorithm is a much more promising method to detect both false positive and false negative interactions in PPI networks.
Availability: MATLAB code implementing the algorithm is available from the web site http://home.ustc.edu.cn/∼yzh33108/Manifold.htm.
Contact: dshuang@iim.ac.cn
Supplementary information: Supplementary data are available at Bioinformatics online.
1 INTRODUCTION
Over the last decade, the development of novel high-throughput techniques has resulted in a rapid accumulation of data that provide a global description of the whole network of protein–protein interaction (PPI) for many organisms (Chua and Wong, 2008). Many essential cellular processes such as cellular metabolism, controlling the function of enzymes, transport and most regulatory mechanisms rely on physical interactions between proteins. Therefore, the interactome analysis is expected to obtain biological insights and enable us to collect comprehensive knowledge for the control mechanism and organization of a living cell (Rual et al., 2005).
This motivates researchers to utilize the interactome to study the disease mechanisms at a system level. However, the high-throughput methods are prone to a high rate of false-positives and false-negatives, i.e. protein interactions which are identified by the experiment do not take place in the cell or interacting protein pairs can not be identified by current experiment technology. For example, it has shown that the false positive (FP) rate of high-throughput yeast two-hybrid assays is ∼50% (Sprinzak et al., 2003). The rate of false negative (FN) is also very high (Chua et al., 2006). Thus it is highly desired to develop computational techniques to assess the reliability of protein interactions and predict new interactions of PPI network. Many such techniques have emerged recently (Albert and Albert, 2004; Chua et al., 2006; Saito et al., 2003; Valencia and Pazos, 2002).
Currently, the available methods for assessing and predicting protein interactions can be divided into four categories: (i) functional homogeneity or localization coherence based methods. The main idea of these approaches is to utilize the supporting evidence from the biological perspective to assess the reliability of an interacting protein pair (Chua et al., 2006). For example, if two proteins are localized in the same cellular component or have a common cellular role, the reliability that these two proteins interact with each other is high. (ii) Methods based on information integration (Bader et al., 2004; Patil and Nakamura, 2005). For example, via using Bayesian network approach, Li et al. combined multiple heterogeneous biological evidences, including gene expression, genome context, functional annotation, interaction domain and network topology structure, to assign reliability scores to the human PPIs identified by high-throughput experiments (Li et al., 2008). (iii) Experiment reproducibility-based methods. These methods are based on the reasonable assumption that an interaction that is observed in two or more independent experiments is more reliable than one that is observed in just one experiment (Chua et al., 2006; Hart et al., 2007).
However, the aforementioned methods cannot be implemented if the prior knowledge about the individual proteins, such as the information of sequence, structure or chemical properties, is not available. In order to overcome the weakness of these methods, some researchers developed the network topology based methods (the fourth category) (Albert and Albert, 2004; Deng et al., 2003; Liu, et al., 2008; Saito et al., 2003; Sharan et al., 2007). The main idea of these approaches is to rank the reliability of an interaction between a pair of proteins primarily using the topology of the interactions between that protein pair and their neighbors within a short ‘radius’ (Chua and Wong, 2008). The methods for the repurification of the experimentally derived interactomes from the topology of PPI networks utilize the observation that a pair of genuine interacting proteins is generally expected to have a common cellular role and proteins that have common interaction partners have a high chance of sharing a common function.
More specifically, Saito et al. developed two indices called IG1 and IG2 which use the local topology of a pair of proteins to rank their interaction probability (Saito et al., 2003). Chen et al. introduced a novel measure called IRAP for assessing the reliability of protein interaction based on the underlying topology of the PPI network (Chen et al., 2005). Similarly, an index called Functional Similarity Weight Index (FSWeight) was first introduced by Chua et al. to predict protein functions. It can be used to assess protein interactions and it usually outperformed IG and IRAP on large-scale protein interaction networks (Chua et al., 2006). Another simple measure is the Czekanowski-Dice distance (CD-DIST) which was originally introduced to predict the protein function (Brun et al., 2003). Although these measures assess the reliability of an interaction between protein pairs by relying purely on the topology of PPI networks, they are very effective (Chen et al., 2005; Chua et al., 2006; Saito et al., 2003).
However, the major shortcoming of using indices like IG, IRAP, CD-DIST and FSWeight to assess and predict protein interactions is that their performance will deteriorate rapidly when they are applied to the sparse PPI network (Chua and Wong, 2008). It is well known that PPI networks are typically very sparse, with average degree of 7 or less (Colak et al., 2009). Therefore, computational analysis techniques for assessing and predicting protein interactions, whose performance is independent on the sparseness of the PPI network, are highly desired.
As is well known, proteins interact with other proteins based on their limited number of biochemical and structural properties (Terradot et al., 2004). These properties can be represented mathematically as the dimensions of some abstract metric space. Therefore, PPI networks may lie on or near some low-dimensional manifold embedded in the high-dimensional unorganized observation space.
Our aim in this paper is to develop a technology based on manifold learning theory (Belkin and Niyogi, 2003; Donoho and Grimes, 2003; Law and Jain, 2006; Lin et al., 2006; Roweis and Saul, 2000; Saul and Roweis, 2004; Tenenbaum et al., 2000; Weinberger and Saul, 2006; Xiang et al., 2009) to seek a low-dimensional embedding of the nodes of PPI network (graph), which recasts the problem of assessing and predicting protein interactions into the form of measuring similarity between points in its metric space. The embedding is reasonable if it assigns to nodes of a PPI network a set of point in a low-dimensional space such that adjacent nodes in the PPI network correspond to points that are close in the low-dimensional space, whereas non-adjacent nodes correspond to points that are further away in the low-dimensional space. Given such an embedding, we assign an interacting score which indicates the reliability of two proteins to interact with each other, to each protein pair in the PPI networks based on the similarity between the points in the embedded space.
We compare our method with a couple of existing approaches and show that our method is able to achieve a satisfied performance in both densely connected and sparse PPI network, especially it is very efficient for large sparse PPI network with which the traditional algorithms fail. The success at detecting both new and spurious interactions confirms that the proposed model is able to uncover the structural features of the true PPI network.
2 ALGORITHM
In this section, we outline the main idea behind the algorithm. The flowchart of our method is shown in Figure 1. First we described the embedding algorithm ISOMAP (isometric feature mapping) (Roweis and Saul, 2000; Tenenbaum et al., 2000), which is responsible for finding a network null model for PPI networks. Then we show how to make the identification of both FP interactions and FN interactions by calculating the reliability index (RI) of each protein pair based on the similarity between the points in the embedded space.
Fig. 1.

Schematic diagram for assessing and predicting protein interactions from high-throughput PPI data using manifold embedding.
2.1 Manifold embedding
Finding a well-fitting null model for PPI networks is a fundamental problem and such null model will provide insights into the interplay between network structure and biological function (Higham et al., 2008). Many researches show that geometric random graphs are a good model for PPI networks (Przulj, 2007; Przulj et al., 2004). In a geometric random graph, nodes of PPI network can be represented by uniformly randomly distributed points in a metric space and the connection information in PPI network can be indicated by the distance in the metric space, i.e. if two nodes are adjacent in the PPI network, the corresponding points are close enough in the metric space. We take an alternative view of manifold embedding to develop an efficient algorithm that models PPI networks. It is based on ISOMAP (Tenenbaum et al., 2000). Our algorithm only utilizes the connectivity information between the nodes of PPI network and embeds the nodes of the network into a metric space so that the topological structure of the network can be faithfully preserved. That is, the spatial proximity of the points in the embedded space corresponds to the PPI network connectivity information.
ISOMAP attempts to find a low-dimensional embedding where the distances between points is approximately equal to the shortest path distances (on a neighborhood graph in the original input space). The power of ISOMAP can be demonstrated by the 3D ‘Swiss roll’ dataset (Fig. 2). Although ISOMAP is originally designed for non-linear dimensionality reduction, here we show that it is suitable for applying to the low-distortion PPI network (graph) embedding problem. The framework of manifold embedding algorithm based on ISOMAP is described as follows.
Fig. 2.

ISOMAP on ‘Swiss roll’ with 1000 points, using KNN neighborhood with k = 8. (A) Points are colored according to their positions on the manifold. (B) When ISOMAP co-ordinates are used, a clear trend of the color is observed, indicating that the structure of the manifold is recovered.
Although real-world PPI networks are generally non-fully connected, they have one largest connected sub-network, which contains most of the networks, nodes and edges (>90%, for details see Supplementary Material). For example, the PPI network of yeast deposited in BioGrid database has 4927 proteins with 4895 of them belonging to the largest fully connected sub-network (∼99%). On the other hand, the ISOMAP algorithm requires the analyzed manifold is a convex subset of RD. Then, the dataset must be an open connected subset of RD (Donoho and Grimes, 2003). Therefore, the ISOMAP algorithm can only handle fully connected PPI networks or the largest connected component of the non-fully connected ones (Donoho and Grimes, 2003). Finally, embedding non-fully connected components of a PPI network into low-dimensional space will result in meaningless spatial overlap. It is difficult to see how any previous technology which only uses PPI data can predict new interactions between members of non-fully connected components. Therefore, in this study, the embedding methods require a fully connected network and only the largest connected component of the PPI network is used.
2.1.1 Constructing neighborhood graph
A PPI network can be naturally modeled as a neighborhood graph G = (V, E), where the set of vertices V = {x1, x2,…, xN} are the proteins, and the set of edges E = {eij} indicate neighborhood relationships between the proteins. We introduce the weight matrix W for the graph where the elements are
| (1) |
This indicates that the edge eij that joins the neighboring points xi and xj has a weight Wij = 1 associated with it. If there is no edge present between a pair of proteins, the corresponding weight is zero. The justification for choosing {0, 1} weight matrix is that real PPI networks contain only the connectivity information between the nodes, and each edge in the neighborhood graph should be treated equally. By constructing neighborhood graph, the connectivity information of PPI network can be naturally inherited and the topological structure of PPI network can be faithfully kept.
2.1.2 Computing geodesic distances
We estimate the geodesic distances dij between pairs of nodes by graph distances dijG with respect to the neighborhood graph G. The graph distances are the shortest path distances between all pairs of points in the graph G. Points that are not neighbors of each other are connected by a sequence of neighbor-to-neighbor links, and the length of this path (sum of the link weights) is taken to approximate the distance between its endpoints on the manifold. If the data points are sampled from a probability distribution that is supported by the entire manifold, then, as the density of data points tend to infinity, it turns out that the estimated dijG converges to dij if the manifold is flat. The shortest path between every pair of vertices in a graph can be computed by means of the Dijkstra's or the Floyd's algorithm (Gall and Pallottino, 1988).
2.1.3 Manifold embedding
Let DG = {dijG} denote the symmetric N × N-matrix of graph distances. We apply Multidimensional Scaling (MDS) to the matrix of graph distances DG with the purpose of finding an embedding of the PPI network in a d-dimensional feature space Y, so that the geodesic distances between nodes are preserved as much as possible.
Form the doubly centered matrix of squared graph distances τ(DG) = −HSGH/2, where
 and H = IN − 11T/N is the centering matrix.
The low-dimensional embedding locations are chosen to minimize the cost function E = ‖τ (DG) − τ(DY)‖, where τ(DY) = −HSYH/2 is the doubly centered matrix of squared embedding Euclidean distances,
 denotes the matrix of Euclidean distances, and dijY = ‖yi − yj‖. The optimal solution is given by the eigenvectors v1,…, vd corresponding to the d largest eigenvalues, λ1 > ··· > λd, of τ(DG).
- The graph G is embedded into Y by the d × N-matrix
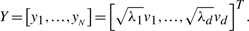
(2)
The i-th column of Y yields the embedding coordinates of the i-th node.
2.2 Calculating the interacting RI of protein pairs
We assign RI, a likelihood indicating the interaction of two proteins, to each protein pair in the PPI networks on the basis of the similarity between the points in the embedded space. The RI for protein interactions is formulated based on the observation that a pair of proteins having many common neighbors is more likely to have similar physical and biochemical properties and thus the two proteins are more likely to interact with each other. This seems to make biological sense since two proteins will require some similar biochemical properties to dock to a particular binding site on a common neighbor, and are likely to participate in similar pathways if they interact with similar type of proteins. This means the larger the proportion of interaction partners which two proteins have in common, the higher the RI is. A criterion of such an index is the FSWeight, originally designed for the purpose of protein function prediction from interaction network (Chua et al., 2006). The FSWeight FS(x, y) of a pair of proteins x and y is defined as
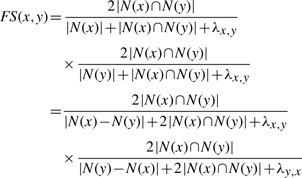 |
(3) |
where N(x) is the set of neighbors of node x. N(x)∩N(y) is the interaction partners that proteins x and y have in common. λ x,y = max (0, NAVG − (|Nx − Ny| + |Nx ∩ Ny|)) is a parameter to modify similarity weights of protein pairs when the proteins have very few neighbors. We can see the larger the RI is, the more likely the two proteins interact with each other.
It is reasonable to use this definition in our study. First, the common interaction partners are positively correlated with the real interaction probability between a pair of proteins. The FSWeight measure also utilizes the proportion of interaction partners that two proteins have for protein function prediction. Second, it has been proven that protein pairs which have high-FSWeight values are more likely to have a common Gene Ontology (GO) terms (Chua et al., 2006). This is likely to be a consequence of the protein interaction. More importantly, FSWeight makes it possible to take into account the topology information carried not only by the nearest neighbors in the embedded space, but also by points two edges away. The procedure of calculating RI consists of the following steps.
Transform a PPI network into a metric space of dimension d ≥ 2 using manifold embedding.
Set the similarity cutoff as ε.
For each pair of points u and v in the embedded space, calculate the similarity value Su,v.
If Sx,y ≤ ε, we set the points u and v have connection, and vice versa.
Compute the RI for the pair of points (u, v) based on Equation (3).
3 RESULTS
In this section, we first quantify the success of embedding the PPI network into the low-dimensional metric space through Receiver Operator Characteristic (ROC) curve and the probability density function learned from the data given by the manifold embedding. Then we evaluate the performance of the proposed approach by carrying out experiments on the densely connected and sparse PPI networks respectively.
3.1 PPI networks
We verify the proposed approach on the model organism Saccharomyces cerevisiae. The PPI datasets of S.cerevisiae are downloaded from the Krogan Lab Interactome Database (http://interactome-cmp.ucsf.edu/). The database contains many protein interactions curated from Krogan et al. (2006), Gavin et al. (2006) and Collins et al. (2007) combined. We assessed only heterodimers and considered the interactions of protein A (bait)–protein B (prey) and of protein B (bait)–protein A (prey) to represent a single interaction (these represent bidirectional interactions in a two-hybrid experiment). Two yeast protein interaction datasets are used in this study for computational validation. One is the densely connected protein interaction network which comprises of 29 922 non-redundant interactions between 3883 of yeast proteins and the other is the sparse protein interaction network which comprises of 12 934 non-redundant interactions between 3645 of yeast proteins.
3.2 The distribution of pair-wise distance in embedded space for interactions and non-interactions
In order to quantify the success of embedding the PPI network into the low-dimensional metric space, we build two probability density functions based on the densely connected PPI networks and its embedded space: p(Similarity|Interaction) and p(Similarity|Non-interaction). The p(Similarity|Interaction) is the probability density function which describes the distribution of pair-wise similarities (i.e. the reciprocal of Euclidean distance in the embedded space) between pairs of proteins which are known to interact. The p(Similarity|Non-interaction) is the probability density function which describes the distribution of pair-wise similarities between pairs of proteins which do not interact with each other.
We can see from Figure 3 that the functions p(Similarity|Interaction) and p(Similarity|Non-interaction) have different distribution and the difference between them is significant. More importantly, we find that the interacting protein pairs in the original PPI network are usually very close in its corresponding embedded space while the non-interacting protein pairs in original PPI network are usually far away in the embedded space (for details see Supplementary Materials: S1–S9). It means that the PPI networks are well represented by embedding them into a low-dimensional metric space and the topological structure of the network can be faithfully preserved. Also the difference between these two functions proves it is reasonable to classify pairs of nodes into interactions and non-interactions based on the similarity between them in the embedded spaces.
Fig. 3.

The probability density functions p(Similarity|Interaction) and p(Similarity|Non-interaction) learned from embedding the components of the S.Cerevisiae PPI network into 3D metric space. The x-axis denotes the distance between pairs of points in the embedded space. The y-axis denotes the value of probability density function. In the Supplementary Materials, we showed the probability density functions when the components of PPI network are embedded into 2 ∼ 10-dimensional metric spaces.
3.3 The ROC curves for embedding PPI network into metric space
To measure the ability of the proposed manifold embedding method to recover the densely connected PPI network, we draw a ROC curve shown in Figure 4. The x-axis of ROC curve is defined as 1-specificity and the y-axis is defined as sensitivity. Specificity and sensitivity are two commonly used measures of the performance of a binary classification test, and they are defined as follows
| (4) |
where TP (true positive) is the number of true interacting protein pairs which are predicted to be interacting (the distance between point pair in embedded space is less than a given threshold). TN (true negative) is the number of non-interacting protein pairs that are predicted to be non-interacting (the distance between point pair in embedded space is larger than a given threshold). FP is the number of non-interacting protein pairs which are predict to be interacting, and FN is the number of interacting protein pairs which are predicted to be non-interacting. The ROC curves are obtained by varying the threshold ε from 0 to the maximum distance between the points in the embedded space.
Fig. 4.

The ROC curves show the performance of sensitivity and specificity when PPI network is embedded into 2 ∼ 10-dimensional metric spaces. The x-axis is 1-Specificity and the y-axis is the corresponding Sensitivity.
In Figure 4, we present nine ROC curves for the cases where the original PPI network is embedded into different dimensional embedded space. A ROC curve is considered as having good performance if it rises rapidly, containing points close to x = 0, y = 1 and the area under it is close to 1. From Figure 3, we can see that the performances of the ROC curves are excellent, which means that the structure of the original PPI network is faithfully preserved by its corresponding low-dimensional space. For example, the sensitivity and specificity of ROC curve can reach 93% and 92%, respectively, when PPI network is embedded into 10-dimensional spaces. This corresponds to the FN rate β = 1 − Sensitivity = 7% and the FP rate α = 1-specificity = 8%. Meanwhile, for dimension 10 of the embedding space, the area under ROC curve is 0.97232 (see Supplementary Materials: S19). Note that here we regard only those protein interactions in our used PPI dataset as true interactions. However, TAP and Y2H FP and FN rates are believed to be at ∼64% and 50% correspondingly (Edwards et al., 2004), so using the PPI dataset as the golden standard may underrate the performance of ROC curve. The actual performance of the embedding should be better than what we reported here.
As can be seen from Figure 4, with the decreasing of the embedded space dimension the performance of the ROC curve is only slightly worse, which means the choice of dimension is not crucial for the manifold embedding (for details see Supplementary Materials: S21). Therefore, the PPI network is well modeled by low-dimensional embedding metric space and the value of dimensionality does not change the performance much.
3.4 Assessing the reliability of interactions in densely connected PPI networks
In this section, we evaluate the performance of the proposed method in the case of embedding into the 10-dimensional space, and compare it with IG2 (Saito et al., 2003), IRAP (Chen et al., 2005), FSWeight (Chua et al., 2006), CD-DIST (Brun et al., 2003) approaches in term of functional homogeneity and localization coherence in a densely connected PPI networks.
By the ‘guilt-by-association’ principle (Oliver, 2000), we expect that as the TP interactions increase in the resulting interactome processed by the proposed method, the proportion of interacting proteins with functional homogeneity and localization coherence should increase correspondingly. Here we use cellular component annotations in GO (see http://www.geneontology.org/) for the localization coherence annotation and the GO terms of biological process and molecular function for functional homogeneity annotation. Among the 3883 proteins in our densely connected yeast dataset, 3775 proteins have functional annotations and 3770 proteins have cellular component annotations (for details see Supplementary Material).
We rank interactions according to their RI values from the highest to the lowest, and measure the functional homogeneity and localization coherence by computing the rate of interacting protein pairs with common function roles and cellular localization. Figure 5 shows the functional homogeneity and localization coherence performance of the interactions in our densely connected yeast dataset ranked using aforementioned five methods. It can be seen that the proportion of interacting proteins with a common functional role increases in RI-filtered interaction data. The similar effect is observed for common cellular localization too. We notice that all of the five methods can achieve a significant improvement although they just use the topological information of networks instead of annotation or repeatability information. As can be seen, the CD-DIST identified more interactions that have common functional role and cellular localization than any other methods did in the top 40%. FSWeight shows a comparable performance in the top 40%, but its performance is the best after the top 40%. The IG2 performs the worst among the five methods. Our method significantly outperforms the IG2 and IRAP methods in the comparison and achieves comparable performance with the CD-DIST and FSWeight methods.
Fig. 5.

Comparison of Our method, IG, IRAP, FSWeight and CD-Dist indices on their correlation with (a) functional homogeneity and (b) localization coherence in assessing reliability of interactions. The vertical axis is the proportion of interacting protein pairs which share a common function or cellular localization. The horizontal axis is the coverage of the PPI network comparing the original network.
3.5 Assessing the reliability of interactions in sparse PPI networks
In densely connected PPI networks, the proposed method outperformed the IG2 and IRAP, but a little bit weaker than the CD-DIST and FSWeight methods. As is well known, one main drawback of using indices like IG2, IRAP, CD-DIST and FSWeight to assess the reliability of protein interactions is that the performance of these approaches deteriorate when the input interaction network gets sparse (Chua and Wong, 2008). In other words, all of these methods have inherent limitation when they are applied to a sparse PPI network.
However, the real PPI networks are typically very sparse, with average degree of 7 or less (Colak et al., 2009) (for details see Supplementary Materials). To deal with this challenge, the approach based on manifold embedding, whose performance is independent on the network sparseness, is developed to assess the reliability of protein interaction and predict new interactions. The proposed approach can overcome aforementioned shortcomings.
We here apply our method to assess the reliability of interactions in the sparse PPI network in the case of embedding into the 10-dimensional space. Then we compare the performance of the proposed method with that of FSWeight, CD-DIST, IG2 and IRAP approach in term of functional homogeneity and localization coherence in sparse PPI networks. We rank interactions according to their RI values in the same manner as we did in the last section, and measure the functional homogeneity and localization coherence by computing the rate of interacting protein pairs with common function roles and cellular localization.
As can be seen in Figure 6, the proposed method is the best in assessing FP interactions in the sparse yeast dataset—as more interactions which were detected as potential FP interaction were removed from the interactions, the degree of functional homogeneity and localization coherence in the resulting interactome increases at a faster rate than using other five methods. The second best approach in the comparison is IG2 method. The IRAP, FSWeight and CD-DIST methods seem to be less effective with the sparse interaction datasets.
Fig. 6.

Comparison of Our method, IG, IRAP, FSWeight and CD-Dist indices on their correlation with (a) functional homogeneity and (b) localization coherence in assessing reliability of interactions. The vertical axis is the proportion of interacting protein pairs which share a common function or cellular localization. The horizontal axis is the coverage of the PPI network comparing the original network.
Since IG2, IRAP, FSWeight and CD-DIST methods are built on the basis of the topology of the neighbors of the protein pairs and their formulation implicitly requires the protein pairs being considered to have sufficient number of partners (Wong and Liu, 2010), the limited direct and indirect interactions in sparse network lead to their poor performances (Chen et al., 2006). However, in our manifold embedding method, some potential connection information, which is very important for methods based on topology to attain good performance, is discovered by preserving local geometry structure. Therefore, we argue that the proposed method is independent on the network sparseness.
3.6 Predicting new protein interactions in sparse PPI networks
Similarly, for FN detection, we inspect whether the top new interactions predicted by our method exhibit a higher degree of functional homogeneity and localization coherence than those predicted using FSWeigh, CD-DIST, IRAP and IG2 approaches.
In our experiment, the number of possible pairs of nodes that were assigned RI value of 0.952 or higher is ∼1300. We investigated the biological significance of these PPI prediction results using the GO terms. Figure 7 shows the functional homogeneity and localization coherence of the new interactions predicted by our method in the case of embedding into the 10-dimensional space, IG2, IRAP, FSWeight and CD-DIST methods. As can be seen, the new interactions predicted by our method are indeed of better quality than the corresponding sets predicted by IG2, IRAP, FSWeight and CD-DIST. Comparatively speaking, IG2 method performs the worst among the five methods and our method is the best among them. For example, Figure 7 compares the proposed method to the IRAP, IG2, FSWeight and CD-DIST on the sparse interaction dataset. In terms of function homogeneity, it can be seen from Figure 7(A) that ∼58% and 72.5% of the top 1100 predicted interacting pairs ranked according to IG2 and IRAP, respectively, have a common function, and >75% of the top 1100 predicted pairs ranked by FSWeight and CD-DIST share common function. By comparison, over 85% of the top 1200 predicted interacting pairs ranked according to the proposed method have a common function. Therefore, the proposed method outperforms IG2, IRAP, CD-DIST and FSWeight in functional homogeneity. Likewise, as shown in Figure 7(B), the proposed method exhibit better localization coherence than IG2, IRAP, FSWeight and CD-DIST, with CD-DIST further outperforming IG2, FSWeight and IRAP.
Fig. 7.

Comparison of Our method, IG, IRAP, FSWeight and CD-DIST indices on their correlation with (a) functional homogeneity and (b) localization coherence in predicting new interactions. The vertical axis is the proportion of interacting protein pairs which share a common function or cellular localization. The horizontal axis is the number of new predicted interactions.
Note that the probability of two proteins in an edge in the sparse dataset being in the same cellular location is <77.06%. It can be seen from Figure 7 that proteins in the 1300 top-ranked edges by our method have >90.5% probability of being in the same cellular locations and thus they are much more likely to be capable of real interactions in vivo than other edges in the dataset. For the functional homogeneity, the probabilities in the sparse dataset and predicted protein interactions are 85.4% and 85.7%, respectively.
In order to further evaluate the biological significant of the new predicted protein interaction pairs, we compare the 1300 predicted protein pairs with protein pairs in STRING database. STRING is a database of known and predicted protein interactions, which integrate multiple information like sequence, expression and so on. We count how many of 1300 (with RI ≥ 0.95) predicted protein pairs can be found in STRING database. The number of proteins involved in the 1300 predicted protein pairs is 806. There are ∼12 369 PPI pairs for these 806 proteins in the STRING database. We found that out of our 1300 high-confidence predictions, 345 protein pairs (i.e. ∼26.5%) also have interaction in STRING database. Considering the STRING database is one of the most complete known and predicted PPI databases and a huge amount of possible protein pairs between the involved 806 proteins (∼324 415), such overlap between our new predicted protein pairs and STRING database is extremely unlikely to have happened at random. The statistical significance of this result (P-value) is <7.43841964979527E-183 (see Supplementary Materials for details). Therefore, the success rates for predicting such new interactions are particularly encouraging.
4 CONCLUSION
In this article, we have developed a robust technique to assess and predict protein interactions from high-throughput experimental data using manifold embedding. The proposed approach first transformed the PPI network into a low-dimensional metric space based on ISOMAP algorithm, and then a RI which indicates the interacting likelihood of two proteins is assigned to every protein pair in the PPI networks on the basis of the similarity between the points in the embedded space. The experimental results show our method outperforms the existing methods no matter assessing or predicting interactions when a sparse PPI network is used. Our method is better than IG2 and IRAP, and has a comparable performance with CD-DIST and FSWeight method when a densely connected PPI network is used. We demonstrate that the proposed approach might shed more light on assessing and predicting protein interaction in both densely connected and sparse PPI networks. It should be noticed that our method solely use the PPI network topology to assess and predict interactions. It is a complementary to those methods which use other biological information for assessing and predicting protein interactions. In the future work, we will integrate the PPI network topology information with other data source to improve the performance of assessing and predicting the protein interactions. In the scoring section, we use a simple method to calculate the reliable index. However, it is possible to utilize a more sophisticated method to achieve better performance.
ACKNOWLEDGMENTS
We would like to thank the anonymous reviewers' hard work, and thank Dr Zhou for his invaluable comments and advice on this work.
Funding: This work was supported by National Science Foundation of China (NSFC) under Grant No. 30900321, 30700161, 71001072 and 60973153. Dr Zhou is partially supported by NIH R01LM010185-01 and NIHR01CA121225-01A2.
Conflict of Interest: none declared.
REFERENCES
- Albert I, Albert R. Conserved network motifs allow protein-protein interaction prediction. Bioinformatics. 2004;20:3346–3352. doi: 10.1093/bioinformatics/bth402. [DOI] [PubMed] [Google Scholar]
- Bader JS, et al. Gaining confidence in high-throughput protein interaction networks. Nat. Biotechnol. 2004;22:78–85. doi: 10.1038/nbt924. [DOI] [PubMed] [Google Scholar]
- Belkin M, Niyogi P. Laplacian eigenmaps for dimensionality reduction and data representation. Neural Comput. 2003;15:1373–1396. [Google Scholar]
- Brun C, et al. Functional classification of proteins for the prediction of cellular function from a protein-protein interaction network. Genome Biol. 2003;5:R6. doi: 10.1186/gb-2003-5-1-r6. [DOI] [PMC free article] [PubMed] [Google Scholar]
- Chen J, et al. Discovering reliable protein interactions from high-throughput experimental data using network topology. Artif. Intel. Med. 2005;35:37–47. doi: 10.1016/j.artmed.2005.02.004. [DOI] [PubMed] [Google Scholar]
- Chen J, et al. Increasing confidence of protein-protein interactomes. Genome Inform. 2006;17:284–297. [PubMed] [Google Scholar]
- Chua HN, et al. Exploiting indirect neighbours and topological weight to predict protein function from protein-protein interactions. Bioinformatics. 2006;22:1623–1630. doi: 10.1093/bioinformatics/btl145. [DOI] [PubMed] [Google Scholar]
- Chua HN, Wong L. Increasing the reliability of protein interactomes. Drug Discov. Today. 2008;13:652–658. doi: 10.1016/j.drudis.2008.05.004. [DOI] [PubMed] [Google Scholar]
- Colak R, et al. Dense graphlet statistics of protein interaction and random networks. Pac. Symp. Biocomput. 2009:178–189. doi: 10.1142/9789812836939_0018. [DOI] [PubMed] [Google Scholar]
- Collins SR, et al. Toward a comprehensive atlas of the physical interactome of Saccharomyces cerevisiae. Mol. Cell Proteom. 2007;6:439–450. doi: 10.1074/mcp.M600381-MCP200. [DOI] [PubMed] [Google Scholar]
- Deng MH, et al. Prediction of protein function using protein-protein interaction data. J. Comput. Biol. 2003;10:947–960. doi: 10.1089/106652703322756168. [DOI] [PubMed] [Google Scholar]
- Donoho DL, Grimes C. Hessian eigenmaps: locally linear embedding techniques for high-dimensional data. Proc. Natl Acad. Sci. USA. 2003;100:5591–5596. doi: 10.1073/pnas.1031596100. [DOI] [PMC free article] [PubMed] [Google Scholar]
- Edwards AM, et al. Bridging structural biology and genomics: assessing protein interaction data with known complexes. Drug Discov. Today. 2004;9:S32–S40. [PubMed] [Google Scholar]
- Gall G, Pallottino S. Shortest path algorithms. Annals Operations Res. 1988;13:1–79. [Google Scholar]
- Gavin AC, et al. Proteome survey reveals modularity of the yeast cell machinery. Nature. 2006;440:631–636. doi: 10.1038/nature04532. [DOI] [PubMed] [Google Scholar]
- Hart GT, et al. A high-accuracy consensus map of yeast protein complexes reveals modular nature of gene essentiality. BMC Bioinformatics. 2007;8:236. doi: 10.1186/1471-2105-8-236. [DOI] [PMC free article] [PubMed] [Google Scholar]
- Higham DJ, et al. Fitting a geometric graph to a protein-protein interaction network. Bioinformatics. 2008;24:1093–1099. doi: 10.1093/bioinformatics/btn079. [DOI] [PubMed] [Google Scholar]
- Krogan N.J. et al. Global landscape of protein complexes in the yeast Saccharomyces cerevisiae. Nature. 2006;440:637–643. doi: 10.1038/nature04670. [DOI] [PubMed] [Google Scholar]
- Law M.HC, Jain AK. Incremental nonlinear dimensionality reduction by manifold learning. IEEE T Pattern Anal. 2006;28:377–391. doi: 10.1109/TPAMI.2006.56. [DOI] [PubMed] [Google Scholar]
- Li D, et al. PRINCESS, a protein interaction confidence evaluation system with multiple data sources. Mol. Cell Proteom. 2008;7:1043–1052. doi: 10.1074/mcp.M700287-MCP200. [DOI] [PubMed] [Google Scholar]
- Lin T, et al. Riemannian manifold learning for nonlinear dimensionality reduction. Comput. Vision Eccv, Pt 1, Proc. 2006;3951:44–55. [Google Scholar]
- Liu GM, et al. Assessing and predicting protein interactions using both local and global network topological metrics. Genome Inform. Ser. 2008;21:138–149. [PubMed] [Google Scholar]
- Oliver S. Guilt-by-association goes global. Nature. 2000;403:601–603. doi: 10.1038/35001165. [DOI] [PubMed] [Google Scholar]
- Patil A, Nakamura H. Filtering high-throughput protein-protein interaction data using a combination of genomic features. BMC Bioinformatics. 2005;6:100. doi: 10.1186/1471-2105-6-100. [DOI] [PMC free article] [PubMed] [Google Scholar]
- Przulj N. Biological network comparison using graphlet degree distribution. Bioinformatics. 2007;23:E177–E183. doi: 10.1093/bioinformatics/btl301. [DOI] [PubMed] [Google Scholar]
- Przulj N, et al. Modeling interactome: scale-free or geometric? Bioinformatics. 2004;20:3508–3515. doi: 10.1093/bioinformatics/bth436. [DOI] [PubMed] [Google Scholar]
- Roweis ST, Saul LK. Nonlinear dimensionality reduction by locally linear embedding. Science. 2000;290:2323. doi: 10.1126/science.290.5500.2323. [DOI] [PubMed] [Google Scholar]
- Rual JF, et al. Towards a proteome-scale map of the human protein-protein interaction network. Nature. 2005;437:1173–1178. doi: 10.1038/nature04209. [DOI] [PubMed] [Google Scholar]
- Saito R, et al. Construction of reliable protein-protein interaction networks with a new interaction generality measure. Bioinformatics. 2003;19:756–763. doi: 10.1093/bioinformatics/btg070. [DOI] [PubMed] [Google Scholar]
- Saul LK, Roweis ST. Think globally, fit locally: unsupervised learning of low dimensional manifolds. J. Mach. Learn. Res. 2004;4:119–155. [Google Scholar]
- Sharan R, et al. Network-based prediction of protein function. Mol. Syst. Biol. 2007;3:88. doi: 10.1038/msb4100129. [DOI] [PMC free article] [PubMed] [Google Scholar]
- Sprinzak E, et al. How reliable are experimental protein-protein interaction data? J. Mol. Biol. 2003;327:919–923. doi: 10.1016/s0022-2836(03)00239-0. [DOI] [PubMed] [Google Scholar]
- Tenenbaum JB, et al. A global geometric framework for nonlinear dimensionality reduction. Science. 2000;290:2319. doi: 10.1126/science.290.5500.2319. [DOI] [PubMed] [Google Scholar]
- Terradot L, et al. Biochemical characterization of protein complexes from the Helicobacter pylori protein interaction map - strategies for complex formation and evidence for novel interactions within type IV secretion systems. Mol. Cell Proteom. 2004;3:809–819. doi: 10.1074/mcp.M400048-MCP200. [DOI] [PubMed] [Google Scholar]
- Valencia A, Pazos F. Computational methods for the prediction of protein interactions. Curr. Opin. Struc. Biol. 2002;12:368–373. doi: 10.1016/s0959-440x(02)00333-0. [DOI] [PubMed] [Google Scholar]
- Weinberger KQ, Saul LK. Unsupervised learning of image manifolds by semidefinite programming. Int. J. Comput. Vision. 2006;70:77–90. [Google Scholar]
- Wong LS, Liu GM. Protein interactome analysis for countering pathogen drug resistance. J. Comput. Sci. Technol. 2010;25:124–130. [Google Scholar]
- Xiang SM, et al. Nonlinear dimensionality reduction with local spline embedding. IEEE T Knowl. Data En. 2009;21:1285–1298. [Google Scholar]