Abstract
A cell rotation method by using optoelectronic tweezers (OET) is reported. The binary image of a typical OET device, whose light and dark sides act as two sets of parallel plates with different ac voltages, was used to create a rotating electric field. Its feasibility for application to electrorotation of cells was demonstrated by rotating Ramos and yeast cells in their pitch axes. The electrorotation by using OET devices is dependent on the medium and cells’ electrical properties, the cells’ positions, and the OET device’s geometrical dimension, as well as the frequency of the electric field.
INTRODUCTION
In the last few decades, the laboratory methods have been continuously updated by many researches and developments in order to manipulate cells. Recently, optoelectronic tweezers (OETs, also known as optically induced dielectrophoresis) have shown the ability to parallel manipulate a large number of microparticles and living cells.1 In typical OET devices with positive dielectrophoresis (DEP),1, 2, 3, 4, 5, 6, 7, 8, 9 the cell is pulled toward and trapped in an area of high electric field gradient. When the illuminated spot moves, the cell follows it. The gradient force required in OET is mostly generated by DEP mechanism. The light used in such system is only to induce DEP forces. Hence, OET requires much less optical intensities than optical tweezers7 does to trap micrometer-sized cells, which might be damaged by a high optical power intensity.
To acquire more manipulation functions of OET devices, various engineering attempts have been made. However, most OETs are still operated to achieve linear cell transportation, which occurs in an abruptly (stepped) changing electric field. For example, two linear-segment virtual electrodes with two different projected lights have been used to continuously separate particles with different sizes.8 The separation is achieved by a selective transportation between larger and smaller particles. Recently, a grayscale light image was used to pattern vertical electric field strength on an OET to align cells in vertical direction.6 While the alignment can only be categorized as an electro-orientation method, which uses a gradually changing field. Using OET to perform electrorotation, which requires a rotating electric field, is still not found.
In this work, we reveal the electrorotation of cells about their pitch axes performed by OET, which innately contains rotating electric fields. A simplified model has been derived to display that the voltages across the illuminated and unilluminated media have a phase difference. Then, the OET device can be modeled as two sets of parallel plates with different ac voltages. The numerical simulations have been made to show that the rotating electric fields exist in the area around the border between the illuminated and unilluminated areas. Based on DEP theories, parameters that affect the electrorotation in OET were analyzed. To demonstrate the application of this technology, we manipulated Ramos and yeast cells.
THEORY
OET devices
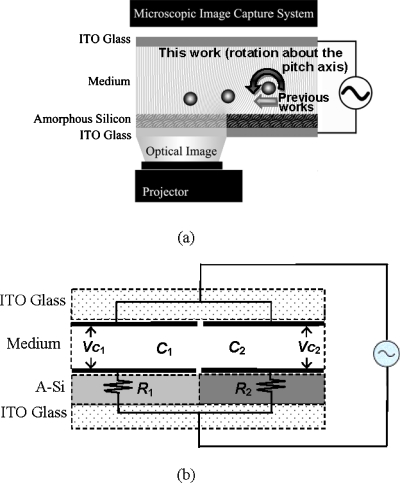
The schematic configuration of a typical setup of the OET is shown in Fig. 1a. The work presented herein focuses on the boundary between illuminated and unilluminated areas. The photoconductive (bottom) layer of the OET device is made of an indium-tin-oxide (ITO)-coated glass substrate and an amorphous silicon (a-Si) photoconductive layer. The photoconductive layer and the ground (top) layer sandwiches a cell-containing solution between them. The upper and lower surfaces are separated by a spacer to form a gap (in this study, 100 μm). An ac bias across the device is applied on the top and bottom ITO layers. Finally, the binary image is projected by a projector onto the bottom layer to form an OET device. As the binary image is created, the cell near the boundary would be pulled toward and then stop at the illuminated area, as shown in Fig. 1a. Based on the phenomenon, transportation, separation, and even electro-orientation of cells were achieved.1, 2, 3, 4, 5, 6, 7, 8, 9 In the following subsections, another phenomenon (the rotating electric fields), which innately exists near the boundary, will be modeled and simulated. Then, its application in electrorotation of cells [see Fig. 1a] will be analyzed.
Figure 1.
(a) The structure and (b) the corresponding circuit model of a typical OET device.
Modeling
The OET device could be considered as the combination of two sheet capacitors in parallel, C1andC2, in series with resistors, R1andR2, as shown in Fig. 1b. The sheets can be considered as “virtual electrodes.” Traditional DEP systems use microfabricated electrodes to build the nonuniform electrical field that causes DEP force. OET devices use virtual electrodes to create the similar field, then, DEP force.1, 9 Assuming that the impedance of conjunction between the illuminated and unilluminated regions in the a-Si layers is very large indicates no current flows across the boundary. Comparing R1 andR2, the resistance existing in the liquid medium is small and can be neglected for simplicity. In Fig. 1b, when the applied voltage isA⋅sin(ωt), the ac voltages across capacitors C1 andC2, i.e., VC1andVC2, can be determined as follows:
| (1) |
| (2) |
where R is the inverse of the total effective resistance and γ is its phase shift, α1, α2, β1, β2, and T are the functions ofR1, R2, andω. Please refer to the Appendix0 for the detailed expressions forR, γ, α1, α2, β1, β2, andT.
Rotating fields
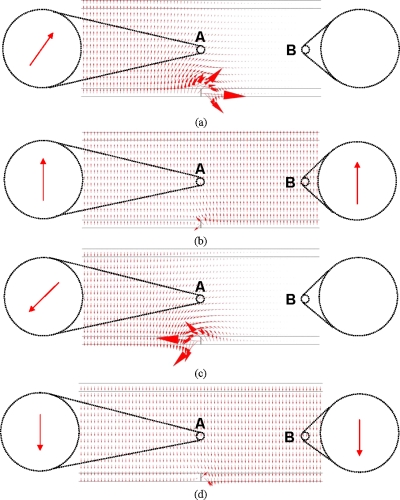
The foregoing two ac voltages are of the same amplitude and frequency but out of phase. For example, if the applied ac voltage is 4 V and its frequency is 1 kHz, theVC1, VC2, and their phase difference can be calculated as 7.4 V, 5.5 V, and 50° by using Eqs. 1, 2. Applying these two voltages onto the OET device, the electric field in the sandwiched solution was predicted by using the software COMSOL. In the simulation model, as shown in Fig. 2, the gap between the top and bottom sheets is 100 μm. The top sheet is always grounded. VC1and VC2 were respectively applied on the left and right sides of the bottom sheet, which was isolated by a tiny gap in the middle. The cell-containing solution is assumed to be de-ionized water. Then, VC1and VC2 with a series of phase angles, i.e., (a) 0°, (b) 90°, (c) 180°, and (d) 270°, were applied, and the model was simulated to observe the variation of the electric fields around the boundary in a period.
Figure 2.
The electric field distribution varies in the sandwiched medium through a series of phase angles, i.e., (a) 0°, (b) 90°, (c) 180°, and (d) 270°. The rotating fields can be observed in the middle portion which is around the illuminated boundary. The size of the arrow represents the amplitude of the electric field.
The results demonstrate that the field that exists nearby the boundary between the illuminated and unilluminated regions is rotating. As shown in Fig. 2, two areas with a diameter of 10 μm (similar to the diameter of a cell), A1andA2, are circled, and the fields in the areas are compared. In areaA1, the fields are continuously rotating, while in areaA2, the fields are only switching. Namely, in OET devices, the creation of a virtual electrode upon localized illumination inherently results in the rotating electric fields around the boundaries of virtual electrodes. Using this rotating electric field, cells can be continuously rotated.
Electrorotation of cells
The interior of biological cells behaving like single-shell spheres can be well approximated by a homogeneous medium. Subjected to an electric field, an polarization would be induced in a cell.10 The polarization tends to align with the field. When the electric field rotates, the polarization follows it, so does the cell. Moreover, the cell, as shown in Fig. 1a, undergoes a rotational torque due to the electrorotation mechanism,11 given by
| (3) |
where r is the cell radius, εmis the permittivity of the media surrounding the cell, K(ω)is the Clausius–Mossotti factor, Ermsis the root-mean-square value of the electric field, and denotes the unit vector of the pitch axis. Equation 3 is affected by the complex permittivity of the cell, εp*,11 because
| (4) |
Namely, the rotation mechanism is dependent on the electrical properties of the cells. Besides, the magnitude of Im[K(ω)] varies with frequency.
Assumed under constant angular velocity, Ω, of a cell, the rotational torque, , is balanced by the oppositely directed torque arising from the fluidic frictional torque, , given by
| (5) |
where η is the viscosity of the medium.11
In equilibrium,
| (6) |
Substitute Eqs. 3, 5 into Eq. 6, yielding the rotational velocity Ω
| (7) |
Equation 7 indicates that the cell rotational velocity Ω is the function of the electric field frequencyω. The rotational spectrum for a homogeneous sphere has a single peak at the Maxwell–Wagner frequency.12
Based on the foregoing discussions, the rotating velocity is dependent on the medium and cells’ electrical properties, the cells’ positions, the OET device’s geometrical dimension, as well as the frequency of the electric field.
RESULTS
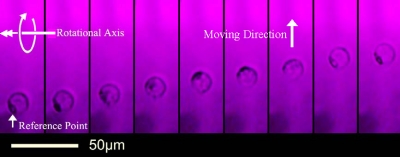
For qualitative verification, various cells have been tested. Figure 3 illustrates the electrorotation of a Ramos cell in its pitch axis. Take an occasional spot on the cell surface as the reference point, it shows that the cell rotates along the axis which is perpendicular to the moving direction. Other kinds of cells, e.g., yeast cells, have the same test results, as shown in Fig. 4.
Figure 3.
Electrorotation of a Ramos cell about its pitch axis.
Figure 4.
Electrorotation of yeast cells using OET. Every cell and cell cluster was rotating about its pitch axis, e.g., the cell cluster pointed by the arrow (enhanced online).
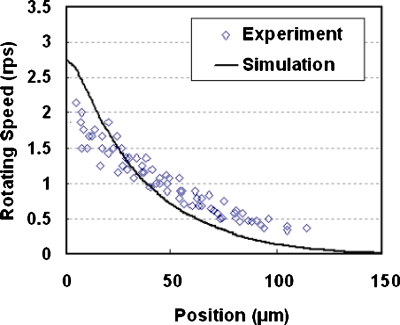
Besides, an electric signal of 5 V at 10 kHz was applied to an OET device, which contains yeast cells. A circular area with a radius of 50 μm was illuminated. The rotation speeds at different positions (position=0 μm indicating the illumination boundary) were observed, as shown in Fig. 5. The theoretical prediction agrees well with the experimental results. The yeast cell at the illumination boundary has the largest rotating speed, whereas at the position far enough away from the illumination boundary (in this case, position=150 μm), it has no rotating speed.
Figure 5.
The experimental and simulated results of the electrorotation of a yeast cell in an OET device.
The most significant differences between electrorotations induced by DEP and OET devices are listed as follows. First, cells rotate about their yaw axes in most DEP devices, but about their pitch axes in OET devices, due to the typical configurations of both devices. Second, depending on electrodes layout and operation method, transportation and electrorotation of cells in DEP devices can be integrated or isolated. In OET devices, because the rotating electric fields exist nearby the illumination boundary where the highest electric field gradient also exists, electrorotation of cells always couple with transportation. However, electrorotation of a cell can be easily confined in a well; as long as the well can stop the moving of the cell, as shown in Fig. 6. Third, OET devices are more flexible than DEP devices due to the feature of virtual electrodes. These three differences mean different applications can be developed by using OET induced electrorotation.
Figure 6.
Electrorotation of a Ramos cell in a well using OET (enhanced online).
CONCLUSION
This work demonstrates the phenomenon of rotating electric field in OET devices and electrorotation of cells in the pitch axis due to the light-induced dielectrophoresis (LIDEP) effect. A simplified model has been proposed to illustrate the configuration of virtual electrodes which is able to create rotating electric fields. Simulations were performed to verify the generation of rotating electric fields. Ramos and yeast cells were rotated by using the proposed method about their pitch axes. The results show that the electrorotation of cells by using OET devices is very promising for a wide variety of cell manipulation applications.
ACKNOWLEDGMENTS
This work was partly supported by the National Science Council in Taiwan through Project Nos. NSC 98-3011-P-007-001 and NSC 97-3114-E-007-002.
APPENDIX: DETAILS OF PARAMETER EXPRESSIONS
The detailed expressions forR, γ, α1, α2, β1, β2, and T are given in this section. These components are derived by analyzing the circuit in Fig. 1b. The following expressions can be used to calculate the effective ac voltages, VC1andVC2, by substituting into Eqs. 1, 2:
| (A1) |
| (A2) |
where
| (A3) |
| (A4) |
| (A5) |
| (A6) |
| (A7) |
References
- Chiou P. Y., Ohta A. T., and Wu M. C., Nature (London) 436, 370 (2005). 10.1038/nature03831 [DOI] [PubMed] [Google Scholar]
- Lu Y. S., Huang J. Y., Yeh J. A., and Lee C., Opt. Quantum Electron. 37, 1385 (2005). 10.1007/s11082-005-4218-1 [DOI] [Google Scholar]
- Huang J. Y., Lu Y. S., and Yeh J. A., Opt. Express 14, 10779 (2006). 10.1364/OE.14.010779 [DOI] [PubMed] [Google Scholar]
- Choi W., Kim S. H., Jang J., and Park J. K., Microfluid. Nanofluid. 3, 217 (2007). 10.1007/s10404-006-0124-5 [DOI] [Google Scholar]
- Jamshidi A., Pauzauskie P. J., Schuck P. J., Ohta A. T., Chiou P. -Y., Chou J., Yang P., and Wu M. C., Nat. Photonics 2, 86 (2008). 10.1038/nphoton.2007.277 [DOI] [PMC free article] [PubMed] [Google Scholar]
- Choi W., Nam S. W., Hwang H., Park S., and Park J. K., Appl. Phys. Lett. 93, 143901 (2008). 10.1063/1.2996277 [DOI] [Google Scholar]
- Ashkin A., Dziedzic J. M., Bjorkholm J. E., and Chu S., Opt. Lett. 11, 288 (1986). 10.1364/OL.11.000288 [DOI] [PubMed] [Google Scholar]
- Lin W. Y., Lin Y. H., and Lee G. B., Microfluid. Nanofluid. 8, 217 (2010). 10.1007/s10404-009-0457-y [DOI] [Google Scholar]
- Ohta A. T., Chiou P. Y., Han T. H., Liao J. C., Bhardwaj U., McCabe E. R. B., Yu F., Sun R., and Wu M. C., J. Microelectromech. Syst. 16, 491 (2007). 10.1109/JMEMS.2007.896717 [DOI] [Google Scholar]
- Cen E. G., Dalton C., Li Y., Adamia S., Pilarski L. M., and Kaler K. V. I. S., J. Microbiol. Methods 58, 387 (2004). 10.1016/j.mimet.2004.05.002 [DOI] [PubMed] [Google Scholar]
- Jones T. B., Electromechanics of Particles (Cambridge University Press, Cambridge, 1995). 10.1017/CBO9780511574498 [DOI] [Google Scholar]
- Pohl H. A., Dielectrophoresis (Cambridge University Press, Cambridge, 1978). [Google Scholar]


