

Abstract
Diffusion Tensor Imaging was used to evaluate cerebral white matter in eight patients (ages 10–17) with myotonic dystrophy type 1 (3 congenital-onset, 5 juvenile-onset) compared to eight controls matched for age and sex. Four regions of interest were examined: inferior frontal, superior frontal, supracallosal, and occipital. The myotonic dystrophy group showed white matter abnormalities compared to controls in all regions. All indices of white matter integrity were abnormal: fractional anisotropy, mean diffusivity, axial diffusivity, and radial diffusivity. With no evidence of regional variation, correlations between whole cerebrum white matter fractional anisotropy and neurocognitive functioning were examined in the patients. Strong correlations were observed between whole cerebrum fractional anisotropy and full-scale intelligence and a measure of executive functioning. Results indicate that significant white matter abnormality is characteristic of young patients with myotonic dystrophy type 1 and that the white matter abnormality seen with neuroimaging has implications for cognitive functioning.
1. Introduction
Myotonic dystrophy type 1 (DM1), an autosomal dominant inherited neuromuscular condition, is the most common form of muscular dystrophy with an estimated incidence of approximately 1 in 8000 in the United States. DM1 is the result of mutations on Chromosome 19q13.3, specifically the result of trinucleotide repeat expansion in the 3’-untranslated region of the dystrophia myotonica protein kinase gene (DMPK). The disease is progressive and multi-systemic, frequently involving ocular, gonadal, cardiac, and endocrine abnormalities in addition to muscular abnormalities [1–4]. Central nervous system (CNS) involvement is an important clinical component of the disease [5]. CNS effects have been demonstrated in studies examining cognitive function and also in neuroimaging studies [5–9].
Early-onset DM1, which can come to medical attention either at birth or during childhood, is associated with more severe cognitive impairment than the classic adult-onset form of DM1. Congenital-onset DM1, which often occurs with CTG expansions >1000 and presents prenatally or at birth, is the most severe presentation and is associated with a very high rate of mental retardation, perhaps between 50% and 90% [5, 7, 10, 11]. Juvenile-onset DM1 is less severe and does not result in mental retardation, but lower than average intelligence quotient (IQ) has been reported [12]. There is evidence that, when individuals with the juvenile-onset form of DM1 reach adulthood, deterioration in frontal-executive functioning can occur, followed by deterioration in memory abilities later in life [11]. By adulthood, deterioration is evident on measures of verbal memory, visual memory, naming, and verbal fluency [13]. Numerous cognitive deficits have been reported in adult-onset DM1 including visual-spatial abnormalities, attention deficits, and impaired executive functioning [8, 11, 14–19].
The most common brain changes seen in magnetic resonance imaging (MRI) studies of both early-onset and adult-onset DM1 have been ventricular enlargement, cortical atrophy, and white matter hyperintensities [8, 14, 20–24]. Previous studies have illustrated a very wide range in severity of brain involvement in this disease and some studies, but not all, have shown associations between imaging abnormalities and cognitive function [14, 21, 25].
In patients with DM1, white matter abnormalities are most commonly seen in subcortical [14] and periventricular [9, 26] regions (especially posterior superior trigone) as well as occasionally in other regions including temporal white matter [10, 27, 28]. The abnormalities seen on MRI have been found to correspond to significant neuropathological changes at autopsy including “severe loss and disordered arrangement of myelin sheaths and axons” [29]. However, some have suggested that neuropathological studies may have underestimated the extent of white matter disruption in myotonic dystrophy [27] and that even ‘normal-appearing white matter’ is disturbed. For example, Naka et al. [30] showed abnormalities in normal-appearing white matter using magnetization transfer imaging (MTI) and DiCostanzo et al. [31] demonstrated widespread white matter disturbance using T2-relaxometry in DM1. Thus far, there has not been a clear convergence of neuropathological findings and neuroimaging findings in DM1.
The nature of the white matter abnormalities in DM1 seen on MRI and their role in the neurocognitive deficits has been only minimally described. To date, there have been few diffusion tensor imaging (DTI) studies of white matter in myotonic dystrophy. Fukuda et al. [32] reported lower fractional anisotropy (FA) in patients with myotonic dystrophy compared to healthy controls. This difference was seen in both normal-appearing white matter and in areas of ‘lesion’ as identified by regions of white matter hyperintensity. Ota et al. [33] used DTI tractography to compare corpus callosum integrity in patients with DM1 to controls and reported significantly lower FA for the patients in multiple regions of the callosum. No correlations between FA and CTG expansion in blood, disease duration, or age at disease onset were found.
The goal of the current study was to utilize DTI to characterize white matter status at the microstructural level in early-onset DM1 and to investigate relationships between white matter abnormalities and cognitive deficits in a group of young patients.
2. Patients and Methods
Consent
The informed consent process included a discussion of the study with the patient and a parent, a consent form signed by the parent, and an assent form signed by the patient. All procedures were reviewed and approved by a University institutional review board.
Subjects
Eight children (4 male, 4 female) with congenital-onset (n=3) or juvenile-onset (n=5) myotonic dystrophy type 1 participated in the study. Subject characteristics are listed in Table 1. Patients were recruited from a University-based myotonic dystrophy clinic. Diagnoses were established by polymerase chain reaction (PCR) and southern blot. The mean age of the patients was 13.75 with a range of 10–17. Patients with DM1 were age and gender-matched with 8 healthy control participants (mean age=13.375), who were recruited from the community.
Table 1.
Subject characteristics for eight participants with Myotonic Dystrophy Type 1.
| Subject | Age | Sex | Trans- mission | Onset | CTG Repeats | VCI | PRI | WMI | PSI | FSIQ |
|---|---|---|---|---|---|---|---|---|---|---|
| 1 | 12 | Male | Maternal | Congenital | > 600 | 73 | 92 | 74 | 78 | 74 |
| 2 | 14 | Female | Maternal | Congenital | > 600 | 73 | 73 | 80 | 65 | 67 |
| 3 | 15 | Male | Maternal | Congenital | ≈1700 | 65 | 51 | 52 | 62 | 48 |
| 4 | 10 | Female | Paternal | Juvenile | ≈600 | 85 | 69 | 91 | 85 | 77 |
| 5 | 12 | Female | Paternal | Juvenile | ≈430 | 102 | 104 | 110 | 85 | 102 |
| 6 | 15 | Male | Paternal | Juvenile | ≈590 | 99 | 77 | 80 | 65 | 77 |
| 7 | 15 | Male | Paternal | Juvenile | ≈375–500 | 61 | 69 | 65 | 75 | 60 |
| 8 | 17 | Female | Maternal | Juvenile | ≈200 | 91 | 115 | 86 | 91 | 95 |
Note: Exact CTG repeat counts were not available for subject #1 and #2 due to the inexact nature of southern blot analysis.
Note: VCI = Wechsler Verbal Comprehension Index; PRI = Perceptual Reasoning Index; WMI = Working Memory Index; PSI = Processing Speed Index; FSIQ = Full Scale Intelligence Quotient.
Neuropsychological Assessment
Subjects completed the following neuropsychological measures: the Wechsler Intelligence Scale for Children (3rd or 4th ed.) [34, 35] or the Wechsler Adult Intelligence Scale (3rd ed.) [36], the Wisconsin Card Sorting Test (WCST) [37], and the California Verbal Learning Test (CVLT-II or CVLT-C) [38, 39]. Participants who were age 16 or younger were administered either the 3rd and 4th editions of the Wechsler Intelligence Scale for Children (there was a change in the clinical research protocol midway through the study) while 17 year-olds were administered the Wechsler Adult Intelligence Scale. In addition, the Behavior Rating Inventory of Executive Functioning (BRIEF) [40] was administered to the patients’ primary caregivers to assess the behavioral expressions of executive function deficits. All neuropsychological instruments were administered by a trained research assistant (E.E.W.) under the supervision of a licensed pediatric neuropsychologist (J.R.W.).
MRI acquisition and processing
Subjects were scanned using a Siemens 3T Trio MRI scanner with an 8-channel parallel array head coil. The scan sequences were as follows:
T1-weighted: the images were acquired using a 3D magnetization prepared rapid acquisition gradient (MPRAGE) sequence. Acquisition parameters were: TR=2530ms, TE=3.65ms, TI=1100ms, 224 slices, 1×1×1mm voxel, flip angle=7 degrees, FOV=256×176mm, generalized auto-calibrating partially parallel acquisition (GRAPPA) with acceleration factor=2; 5 minutes.
Proton density (PD) -weighted: the images were acquired using a hyper-echo turbo spin echo (TSE) sequence. Acquisition parameters were: TR=8550ms, TE=14ms, 80 slices, 1×1×2mm voxel, flip angle=120 degrees, field of view (FOV)=256mm; 6 minutes.
Diffusion tensor imaging (DTI): the 30-direction diffusion-weighted acquisition was positioned to cover the cerebrum and as much of the cerebellum as possible. Acquisition parameters for the dual spin echo, single shot, echo planar, diffusion weighted sequence were: TR=8500 ms, TE=90 ms, 64 slices, voxel size=2×2×2 mm, FOV=256 mm2, 1 average, GRAPPA with acceleration factor=2, b=1000 s/mm2. Thirty-six volumes each were collected to compute the tensor: 6 images with b=0 s/mm2 and 30 images with diffusion gradients applied in non-collinear directions; 6 minutes.
Field map: the field map was used to correct the DTI data for geometric distortion. Positioned to match the DTI acquisition. The acquisition parameters were: TR=700ms, TE=4.62 ms /7.08 ms, 64 slices, voxel size=2×2×2 mm FOV=256 mm2; 3 minutes.
Post-processing
Image data was processed using software from the FMRIB Software Library (http://www.fmrib.ox.ac.uk/). The brain was extracted from the T1 and PD acquisitions using the brain extraction tool (BET). The PD brain was aligned to the T1 brain using FMRIB’s linear image registration tool (FLIRT), allowing for translations and rotations but no scaling or shear (6 degrees of freedom (DoF) fit). Dual channel segmentation was performed on T1 and aligned PD brains using FMRIB’s automated segmentation tool (FAST), producing four tissue classes (cerebrospinal fluid, white, gray, and blood). The T1 brain was registered to the Montreal Neurological Institute (MNI) template brain using FLIRT (12 DoF). A cerebrum mask, which consisted of the whole brain excluding the cerebellum and brain stem, was generated for each T1 image by transforming the template mask created on the MNI brain onto the T1 brain. The DTI data were corrected for eddy current distortion, field maps were used to correct the resulting data for geometric distortions caused by susceptibility induced magnetic field inhomogeneity, and the diffusion tensor was then computed using FMRIB’s Diffusion toolbox (FDT). Four scalar measures were derived from the tensor: Fractional Anisotropy (the fraction of the magnitude of the tensor that is due to anisotropic water diffusion [41]); Mean Diffusivity (the mean of the three eigenvalues); Axial Diffusivity (the first eigenvalue); and Radial Diffusivity (the mean of the second and third eigenvalues).
Regions of interest definition
Semi-automated procedures were used to define regions of interest (ROIs) for analysis. A trained operator identified four slices on the MNI aligned T1 image from each subject: the axial slice containing the anterior and posterior commissure (AC-PC), the coronal slice just anterior to the mid-sagittal point of the genu of the corpus callosum, the coronal slice just posterior to the mid-sagittal point of the splenium of the corpus callosum, and the axial slice just superior to the corpus callosum at the longitudinal fissure. Based on these delineations, masks were defined for four regions of interest (ROIs): 1. the inferior frontal mask was anterior to the genu and inferior to and including the AC-PC plane (Figure 1); 2. the superior frontal mask was anterior to the genu and superior to the AC-PC plane (Figure 1); 3. the occipital mask was posterior to the splenium, superior to the AC-PC plane, and inferior to the axial slice just superior to the corpus callosum and; 4. the supracallosal mask was superior to the corpus callosum (Figure 2). The ROI masks were transformed from the MNI image to the dewarped DTI images, and then convolved with the white matter mask to yield the ROI specific the white matter mask. Mean fractional anisotropy, mean diffusivity, axial diffusivity, and radial diffusivity values were computed for the white matter within each of the four ROIs.
Figure 1.
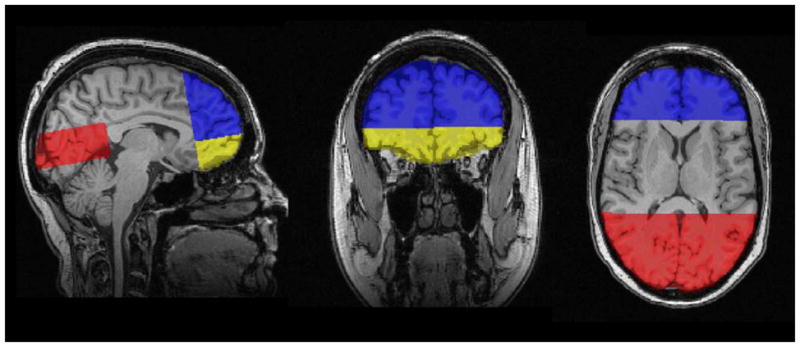
Masks defining three Regions of Interest (ROIs) on T1-weighted images; Blue = superior-frontal mask; Yellow = inferior-frontal mask; Red = occipital mask.
Figure 2.
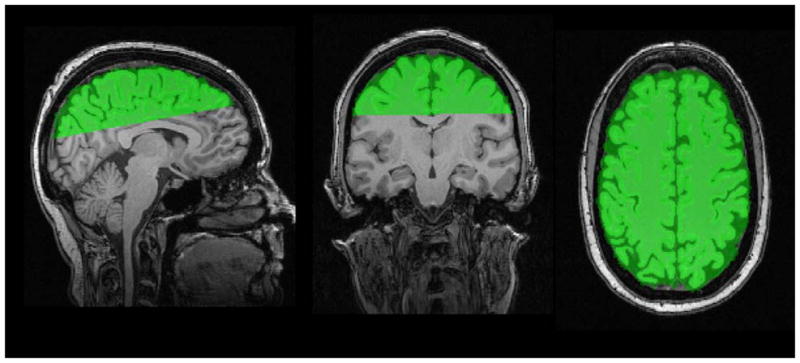
Mask defining the fourth Region of Interest (ROI) on T1-weighted images; Green = supracallosal mask.
3. Results
The groups did not differ in age, F (1, 15) = 1.42, p = .712. Table 2 contains results from analyses of variance (ANOVAs) comparing groups on several measures of neurocognitive performance. As expected, patients with DM1 performed significantly below controls on standardized IQ measures (Wechsler Intelligence Scale for Children – Fourth Edition or Wechsler Adult Intelligence Scale – Third Edition). Full-scale IQ and all of the index scores were lower for patients with DM1, most notably the Processing Speed Index. Group differences were not significant for measures of verbal learning (California Verbal Learning Test – Children’s Edition or 2nd Edition) or executive functioning (Wisconsin Card Sorting Test). However, a parent-report instrument, the Behavior Rating Inventory of Executive Functioning or BRIEF Parent-Report [40], indicated significant “real-world” executive functioning deficits in those with DM1 compared to controls.
Table 2.
Neuropsychological results by group.
| Control | DM1 | ||
|---|---|---|---|
| Measure | Mean (SD) | Mean (SD) | Significance (p) |
| Wechsler Verbal Comprehension | 104.1 (13.9) | 81.1 (15.4) | .007 |
| Wechsler Perceptual Organization | 100.9 (10.8) | 81.2 (20.9) | .034 |
| Wechsler Working Memory | 101.4 (10.4) | 79.8 (17.3) | .009 |
| Wechsler Processing Speed | 102.3 (7.6) | 75.8 (10.9) | <.001 |
| Full-Scale IQ | 103.1 (10.8) | 75.0 (17.6) | .002 |
| California Verbal Learning Test (total) | 51.9 (8.4) | 44.6 (12.7) | .200 |
| Wisconsin Card Sorting Test (total errors) | 97.8 (20.4) | 88.0 (23.2) | .387 |
| BRIEF General Executive Composite | 46.3 (6.2) | 66.4 (8.2) | <.001 |
Note: All tests were administered to all subjects.
Note: SD = Standard Deviation.
For each of the ROIs, a separate multiple analysis of variance (MANOVA) tested for group differences in fractional anisotropy, mean diffusivity, axial diffusivity, and radial diffusivity. A significant group difference was seen in the inferior frontal ROI [Wilks’ lambda = .136, F(4,11) = 17.52, p = .0001]; Univariate tests showed highly significant differences on all white matter indices (Table 3). Similarly, groups were significantly different in the superior frontal ROI [Wilks’ lambda = .188, F(4,11) = 11.86, p = .0006]; Univariate tests showed highly significant differences on all four indices (Table 4). Again, groups were significantly different in the supracallosal ROI [Wilks’ lambda = .186, F(4,11) = 12.06, p = .0005; All four indices differed significantly between the groups (Table 5). Lastly, the groups differed significantly in the occipital ROI [Wilks’ lambda = .236, F(4,11) = 8.92, p = .0018]; All four indices showed significant group differences between the groups (Table 6). In summary, consistent evidence of white matter abnormalities were seen in all four ROIs as reflected by lower fractional anisotropy, higher mean diffusivity, higher axial diffusivity, and higher radial diffusivity in the DM1 group compared to controls.
Table 3.
Inferior frontal white matter group comparisons.
| Control | DM1 | ||
|---|---|---|---|
| Measure | Mean (SD) | Mean (SD) | Significance (p) |
| Fractional Anisotropy | .393 (.017) | .312 (.031) | <.0001 |
| Mean Diffusivity ×10−3 | .825 (.021) | .942 (.054) | <.0001 |
| Radial Diffusivity | .645 (.021) | .784 (.063) | <.0001 |
| Axial Diffusivity | 1.18 (.028) | 1.26 (.044) | .001 |
Note: SD = Standard Deviation.
Table 4.
Superior frontal white matter group comparisons.
| Control | DM1 | ||
|---|---|---|---|
| Measure | Mean (SD) | Mean (SD) | Significance (p) |
| Fractional Anisotropy | .394 (.013) | .312 (.033) | <.0001 |
| Mean Diffusivity ×10−3 | .793 (.019) | .919 (.051) | <.0001 |
| Radial Diffusivity | .619 (.021) | .769 (.062) | <.0001 |
| Axial Diffusivity | 1.14 (.021) | 1.21 (.034) | <.0001 |
Note: SD = Standard Deviation.
Table 5.
Supracallosal white matter group comparisons.
| Control | DM1 | ||
|---|---|---|---|
| Measure | Mean (SD) | Mean (SD) | Significance (p) |
| Fractional Anisotropy | .376 (.019) | .309 (.031) | .0001 |
| Mean Diffusivity ×10−3 | .795 (.020) | .892 (.051) | .0002 |
| Radial Diffusivity | .626 (.025) | .743 (.059) | .0001 |
| Axial Diffusivity | 1.13 (.017) | 1.19 (.050) | .008 |
Note: SD = Standard Deviation.
Table 6.
Occipital white matter group comparisons.
| Control | DM1 | ||
|---|---|---|---|
| Measure | Mean (SD) | Mean (SD) | Significance (p) |
| Fractional Anisotropy | .419 (.019) | .334 (.033) | <.0001 |
| Mean Diffusivity ×10−3 | .792 (.018) | .892 (.056) | .0003 |
| Radial Diffusivity | .596 (.024) | .725 (.062) | <.0001 |
| Axial Diffusivity | 1.18 (.010) | 1.23 (.055) | .04 |
Note: SD = Standard Deviation.
The relationship between white matter integrity and cognitive status was examined with a set of selected exploratory correlations for patients with DM1. Because the ROI data suggested profound white matter abnormalities across the cerebrum rather than a regionally specific effect, correlations were only computed between whole-cerebrum white matter integrity and the neurocognitive measures. To further limit the number of correlations examined, we focused on fractional anisotropy (FA), the most commonly used DTI index of white matter integrity. The results, listed in Table 7, suggest a relationship in the predicted direction between full-scale IQ and whole brain fractional anisotropy. Greater white matter abnormality (as indicated by lower FA) was associated with lower full-scale IQ. The data also suggest that executive functioning may be related to overall whole-cerebrum white matter integrity.
Table 7.
Correlations between whole-brain fractional anisotropy and cognition for patients in the DM1 group (n = 8).
| Measure | Pearson correlation (r) & significance (p) |
|---|---|
| WISC-IV Verbal Comprehension | .55 (.16) |
| WISC-IV Perceptual Organization | .70 (.06) |
| WISC-IV Working Memory | .64 (.09) |
| WISC-IV Processing Speed | .65 (.09) |
| Full-Scale IQ | .74 (.04) |
| California Verbal Learning Test Total | .24 (.57) |
| Wisconsin Card Sorting Test (errors) | .70 (.05) |
| BRIEF exec. functioning (parent report) | −.39 (.34) |
4. Discussion
These results suggest that young patients with early-onset DM1 have significant white matter abnormalities throughout the brain. Low FA was observed in inferior frontal, superior frontal, occipital, and supracallosal regions, indicating that the abnormalities in DM1 are diffuse as opposed to regionally specific. Very few studies have examined white matter microstructure using DTI in patients with myotonic dystrophy and we believe that this is the first study to specifically do so in child and adolescent patients. Takaba et al. [42] first demonstrated widespread white matter diffusion abnormalities in adult patients with myotonic dystrophy. The same group reported lower FA and higher mean diffusivity (MD) in both hyperintense white matter lesions and in the normal-appearing white matter in patients with myotonic dystrophy compared to control subjects [32]. Ota et al. [33] examined white matter in several corpus callosum tracts using DTI and found lower FA and higher MD in the genu, rostral body, anterior midbody, posterior midbody, and splenium tracts. They found evidence of grey matter atrophy specifically in bilateral cortical regions that would be connected by the affected corpus callosum fibers. The authors suggested that the DTI changes could be related to Wallerian degeneration of the white matter following atrophy in the cortical grey matter.
Unfortunately, the biophysical meaning of diffusion abnormalities in white matter is not yet fully understood. Initially, it was thought that myelin was the primary contributor to anisotropy in normal axons and diffusion abnormalities might specifically reflect myelin disruption [43]. However, a number of studies have shown that myelin’s role in anisotropy is minor [44, 45]. A number of other microstructural factors contribute significantly to diffusion anisotropy. The axonal membrane itself and the longitudinally-oriented microtubules and neurofilaments that are part of the structure of axons are known to be important in anisotropy [46, 47]. Also, fast axonal transport within the cell may accentuate diffusion, as measured by DTI, in the long axis direction of the axon [46]. Finally, the diffusion of extra-axonal water between densely packed axons is another important contributing factor to anisotropy. Thus, a number of possible changes to the white matter microstructure could lead to the diffusion abnormalities seen in DM1 in the current study.
Although FA has been the most commonly reported DTI measure, the additional measures of axial, radial, and mean diffusivities are also potentially useful in characterizing different aspects of white matter status. In mice, Song et al. [48] found that dysmyelination was reflected in increased radial diffusivity but no change in axial diffusivity. In a mouse model of ischemia, optic nerve axonal degeneration was associated with a selective decrease in axial diffusivity [49]. Demyelination, which occurred later, was reflected in a subsequent increase in radial diffusivity. Thus, the axial diffusivity measure may be particularly sensitive to damage to the axon itself, whereas radial diffusivity may be sensitive to abnormalities in the myelin sheath surrounding the axon. These studies point out that various DTI measurements may be differentially sensitive to the various points in the sequence of white matter damage. The current finding of abnormalities in all four DTI measures in young patients with DM1 could possibly reflect the accumulated series of changes that have already taken place in the white matter by the time the measurements were taken. Alternatively, significant changes to either intracellular or extracellular water content could also lead to changes in axial and radial diffusivity measures.
Establishing links between neuroimaging findings and cellular changes in DM1 is a major challenge. Neuronal migration errors have been observed in congenital-onset DM1 as have ventricular enlargement, corpus callosum hypoplasia, periventricular leucomalacia, and cortical atrophy [21, 22, 50] but these findings are variable and some studies have shown no specific brain pathology in congenital-onset DM1 [51, 52]. DiCostanzo et al. [27] have suggested that white matter pathology, including myelin abnormalities, may have been historically underestimated in pathological studies of DM1. They have provided evidence of diffusely increased T2 relaxation times in DM1, perhaps resulting from alterations in myelin and changes in inter-axonal water content [31]. Myelin abnormalities in DM1 have also been potentially implicated by evidence of widespread magnetization transfer imaging (MTI) abnormalities (low magnetization ratio) in normal-appearing white matter [30, 53].
Disease progression in DM1 has been associated with widespread cell loss in both subcortical and cortical grey matter [25, 54–57], but this quantification is difficult. MRI voxel-based morphometry studies corroborate these findings of atrophy in multiple brain regions [10, 27, 58–60]. DM1 pathology also involves neuronal inclusions (ribonuclear inclusions with co-aggregated muscleblind protein; intracytoplasmic inclusion bodies) in multiple brain regions that may also play a role in functional cognitive disturbances [61–66]. Specifically relevant to the current study are findings of RNA foci in various locations throughout the brain including subcortical white matter and corpus callosum [63].
The clinical implications of white matter disruption in DM1 have been explored, but the findings have been somewhat inconsistent. Some studies find direct association with cognitive disturbance [14, 26, 67] while others do not [8, 23, 68]. Much of the literature to this point has focused on white matter hyperintensities, which occur in the majority of patients late in the course of the disease, especially in sub-cortical regions, but also elsewhere including temporal lobe [9, 10, 14, 59, 69]. In adults, white matter abnormalities have been shown to be associated with intellectual dysfunction [10, 14, 29], psychomotor speed [70], verbal fluency [67], attention [67] . At least one study has demonstrated that the degree of cognitive deficit may depend on the specific location of the white matter damage in DM1; Damian et al. [71] posit that intellectual impairment is greater in patients with damage to the white matter adjacent to cortex in contrast to patients with primarily sub-cortical white matter changes.
Consistent with the literature on cognitive functioning in DM1 [11], we observed overall IQ deficits in young patients with early onset disease. We did not observe significant executive functioning deficits or memory deficits, which are classically evident in adults [17–19] and which have been seen in adults who had early-onset DM1[13] . However, parent ratings of executive functioning did show evidence of problems with “real world” executive skills such as planning, organizing, and self-monitoring. Both the neurocognitive test data and the imaging data suggest that the neuropathology in these patients was diffuse rather than focal. Cerebral FA correlated significantly with full-scale IQ, which is a global measure of cognitive status. Furthermore, an examination of the correlations between cerebral FA and the individual Wechsler index measures suggests relatively strong associations with all four indexes, although the small sample size precludes these associations from reaching significance. In the future, larger numbers of participants may allow for a more targeted examination of regional white matter abnormalities and specific cognitive deficits.
In conclusion, the current study provides evidence of widespread white matter abnormalities in multiple brain regions in young patients with early-onset DM1. These abnormalities correlate with important aspects of cognitive functioning, most notably intelligence and executive functioning. Several DTI measures were abnormal, suggesting significant microstructural deficits not limited to myelin and, perhaps, reflecting an accumulation of changes that have occurred over time. Future studies could build on these findings by collecting similar measures earlier in the disease process and obtaining the measures at several time points across development.
Footnotes
Publisher's Disclaimer: This is a PDF file of an unedited manuscript that has been accepted for publication. As a service to our customers we are providing this early version of the manuscript. The manuscript will undergo copyediting, typesetting, and review of the resulting proof before it is published in its final citable form. Please note that during the production process errors may be discovered which could affect the content, and all legal disclaimers that apply to the journal pertain.
References
- 1.Sovari AA, Bodine CK, Farokhi F. Cardiovascular manifestations of myotonic dystrophy-1. Cardiol Rev. 2007;15:191–4. doi: 10.1097/CRD.0b013e318070d1a7. [DOI] [PubMed] [Google Scholar]
- 2.Schara U, Schoser BG. Myotonic dystrophies type 1 and 2: a summary on current aspects. Semin Pediatr Neurol. 2006;13:71–9. doi: 10.1016/j.spen.2006.06.002. [DOI] [PubMed] [Google Scholar]
- 3.Anastasopoulos D, Kimmig H, Mergner T, Psilas K. Abnormalities of ocular motility in myotonic dystrophy. Brain. 1996;119 ( Pt 6):1923–32. doi: 10.1093/brain/119.6.1923. [DOI] [PubMed] [Google Scholar]
- 4.Jozefowicz RF, Griggs RC. Myotonic dystrophy. Neurol Clin. 1988;6:455–72. [PubMed] [Google Scholar]
- 5.Meola G, Sansone V. Cerebral involvement in myotonic dystrophies. Muscle Nerve. 2007;36:294–306. doi: 10.1002/mus.20800. [DOI] [PubMed] [Google Scholar]
- 6.D'Angelo MG, Bresolin N. Cognitive impairment in neuromuscular disorders. Muscle Nerve. 2006;34:16–33. doi: 10.1002/mus.20535. [DOI] [PubMed] [Google Scholar]
- 7.Censori B, Danni M, Del Pesce M, Provinciali L. Neuropsychological profile in myotonic dystrophy. J Neurol. 1990;237:251–6. doi: 10.1007/BF00314629. [DOI] [PubMed] [Google Scholar]
- 8.Censori B, Provinciali L, Danni M, Chiaramoni L, Maricotti M, Foschi N, et al. Brain involvement in myotonic dystrophy: MRI features and their relationship to clinical and cognitive conditions. Acta Neurol Scand. 1994;90:211–7. doi: 10.1111/j.1600-0404.1994.tb02708.x. [DOI] [PubMed] [Google Scholar]
- 9.Glantz RH, Wright RB, Huckman MS, Garron DC, Siegel IM. Central nervous system magnetic resonance imaging findings in myotonic dystrophy. Arch Neurol. 1988;45:36–7. doi: 10.1001/archneur.1988.00520250042017. [DOI] [PubMed] [Google Scholar]
- 10.Huber SJ, Kissel JT, Shuttleworth EC, Chakeres DW, Clapp LE, Brogan MA. Magnetic resonance imaging and clinical correlates of intellectual impairment in myotonic dystrophy. Arch Neurol. 1989;46:536–40. doi: 10.1001/archneur.1989.00520410070026. [DOI] [PubMed] [Google Scholar]
- 11.Modoni A, Silvestri G, Pomponi MG, Mangiola F, Tonali PA, Marra C. Characterization of the pattern of cognitive impairment in myotonic dystrophy type 1. Arch Neurol. 2004;61:1943–7. doi: 10.1001/archneur.61.12.1943. [DOI] [PubMed] [Google Scholar]
- 12.Steyaert J, Umans S, Willekens D, Legius E, Pijkels E, de Die-Smulders C, et al. A study of the cognitive and psychological profile in 16 children with congenital or juvenile myotonic dystrophy. Clin Genet. 1997;52:135–41. doi: 10.1111/j.1399-0004.1997.tb02533.x. [DOI] [PubMed] [Google Scholar]
- 13.Modoni A, Silvestri G, Vita MG, Quaranta D, Tonali PA, Marra C. Cognitive impairment in myotonic dystrophy type 1 (DM1): a longitudinal follow-up study. J Neurol. 2008;255:1737–42. doi: 10.1007/s00415-008-0017-5. [DOI] [PubMed] [Google Scholar]
- 14.Bachmann G, Damian MS, Koch M, Schilling G, Fach B, Stoppler S. The clinical and genetic correlates of MRI findings in myotonic dystrophy. Neuroradiology. 1996;38:629–35. doi: 10.1007/s002340050322. [DOI] [PubMed] [Google Scholar]
- 15.Gaul C, Schmidt T, Windisch G, Wieser T, Muller T, Vielhaber S, et al. Subtle cognitive dysfunction in adult onset myotonic dystrophy type 1 (DM1) and type 2 (DM2) Neurology. 2006;67:350–2. doi: 10.1212/01.wnl.0000225180.27833.c1. [DOI] [PubMed] [Google Scholar]
- 16.Malloy P, Mishra SK, Adler SH. Neuropsychological deficits in myotonic muscular dystrophy. J Neurol Neurosurg Psychiatry. 1990;53:1011–3. doi: 10.1136/jnnp.53.11.1011. [DOI] [PMC free article] [PubMed] [Google Scholar]
- 17.Meola G, Sansone V, Perani D, Scarone S, Cappa S, Dragoni C, et al. Executive dysfunction and avoidant personality trait in myotonic dystrophy type 1 (DM-1) and in proximal myotonic myopathy (PROMM/DM-2) Neuromuscul Disord. 2003;13:813–21. doi: 10.1016/s0960-8966(03)00137-8. [DOI] [PubMed] [Google Scholar]
- 18.Rubinsztein JS, Rubinsztein DC, McKenna PJ, Goodburn S, Holland AJ. Mild myotonic dystrophy is associated with memory impairment in the context of normal general intelligence. J Med Genet. 1997;34:229–33. doi: 10.1136/jmg.34.3.229. [DOI] [PMC free article] [PubMed] [Google Scholar]
- 19.Winblad S, Lindberg C, Hansen S. Cognitive deficits and CTG repeat expansion size in classical myotonic dystrophy type 1 (DM1) Behav Brain Funct. 2006;2:16. doi: 10.1186/1744-9081-2-16. [DOI] [PMC free article] [PubMed] [Google Scholar]
- 20.Antonini G, Mainero C, Romano A, Giubilei F, Ceschin V, Gragnani F, et al. Cerebral atrophy in myotonic dystrophy: a voxel based morphometric study. J Neurol Neurosurg Psychiatry. 2004;75:1611–3. doi: 10.1136/jnnp.2003.032417. [DOI] [PMC free article] [PubMed] [Google Scholar]
- 21.Hashimoto T, Tayama M, Miyazaki M, Murakawa K, Kawai H, Nishitani H, et al. Neuroimaging study of myotonic dystrophy. I. Magnetic resonance imaging of the brain. Brain Dev. 1995;17:24–7. doi: 10.1016/0387-7604(94)00096-g. [DOI] [PubMed] [Google Scholar]
- 22.Martinello F, Piazza A, Pastorello E, Angelini C, Trevisan CP. Clinical and neuroimaging study of central nervous system in congenital myotonic dystrophy. J Neurol. 1999;246:186–92. doi: 10.1007/s004150050332. [DOI] [PubMed] [Google Scholar]
- 23.Romeo V, Pegoraro E, Ferrati C, Squarzanti F, Soraru G, Palmieri A, et al. Brain involvement in myotonic dystrophies: neuroimaging and neuropsychological comparative study in DM1 and DM2. J Neurol. 2010 doi: 10.1007/s00415-010-5498-3. [DOI] [PubMed] [Google Scholar]
- 24.Minnerop M, Luders E, Specht K, Ruhlmann J, Schneider-Gold C, Schroder R, et al. Grey and white matter loss along cerebral midline structures in myotonic dystrophy type 2. J Neurol. 2008;255:1904–9. doi: 10.1007/s00415-008-0997-1. [DOI] [PMC free article] [PubMed] [Google Scholar]
- 25.Kassubek J, Juengling FD, Hoffmann S, Rosenbohm A, Kurt A, Jurkat-Rott K, et al. Quantification of brain atrophy in patients with myotonic dystrophy and proximal myotonic myopathy: a controlled 3–dimensional magnetic resonance imaging study. Neurosci Lett. 2003;348:73–6. doi: 10.1016/s0304-3940(03)00740-7. [DOI] [PubMed] [Google Scholar]
- 26.Kuo HC, Hsiao KM, Chen CJ, Hsieh YC, Huang CC. Brain magnetic resonance image changes in a family with congenital and classic myotonic dystrophy. Brain Dev. 2005;27:291–6. doi: 10.1016/j.braindev.2004.09.002. [DOI] [PubMed] [Google Scholar]
- 27.Di Costanzo A, Di Salle F, Santoro L, Bonavita V, Tedeschi G. Brain MRI features of congenital- and adult-form myotonic dystrophy type 1: case-control study. Neuromuscul Disord. 2002;12:476–83. doi: 10.1016/s0960-8966(01)00324-8. [DOI] [PubMed] [Google Scholar]
- 28.Kornblum C, Reul J, Kress W, Grothe C, Amanatidis N, Klockgether T, et al. Cranial magnetic resonance imaging in genetically proven myotonic dystrophy type 1 and 2. J Neurol. 2004;251:710–4. doi: 10.1007/s00415-004-0408-1. [DOI] [PubMed] [Google Scholar]
- 29.Ogata A, Terae S, Fujita M, Tashiro K. Anterior temporal white matter lesions in myotonic dystrophy with intellectual impairment: an MRI and neuropathological study. Neuroradiology. 1998;40:411–5. doi: 10.1007/s002340050613. [DOI] [PubMed] [Google Scholar]
- 30.Naka H, Imon Y, Ohshita T, Honjo K, Kitamura T, Mimori Y, et al. Magnetization transfer measurements of cerebral white matter in patients with myotonic dystrophy. J Neurol Sci. 2002;193:111–6. doi: 10.1016/s0022-510x(01)00652-9. [DOI] [PubMed] [Google Scholar]
- 31.Di Costanzo A, Di Salle F, Santoro L, Bonavita V, Tedeschi G. T2 relaxometry of brain in myotonic dystrophy. Neuroradiology. 2001;43:198–204. doi: 10.1007/s002340000459. [DOI] [PubMed] [Google Scholar]
- 32.Fukuda H, Horiguchi J, Ono C, Ohshita T, Takaba J, Ito K. Diffusion tensor imaging of cerebral white matter in patients with myotonic dystrophy. Acta Radiol. 2005;46:104–9. doi: 10.1080/02841850510015974. [DOI] [PubMed] [Google Scholar]
- 33.Ota M, Sato N, Ohya Y, Aoki Y, Mizukami K, Mori T, et al. Relationship between diffusion tensor imaging and brain morphology in patients with myotonic dystrophy. Neurosci Lett. 2006;407:234–9. doi: 10.1016/j.neulet.2006.08.077. [DOI] [PubMed] [Google Scholar]
- 34.Wechsler D. Wechsler Intelligence Scale for Children. 4. San Antonio, TX: The Psychological Corporation; 2003. [Google Scholar]
- 35.Wechsler D. Wechsler Intelligence Scale for Children. 3. San Antonio, TX: The Psychological Corporation; 1991. [Google Scholar]
- 36.Wechsler D. Wechsler Adult Intelligence Scale. 3. San Antonio: The Psychological Corporation; 1997. [Google Scholar]
- 37.Heaton RK, Chelune GJ, Talley JL, Kay GG, Curtiss G. Wisconsin Card Sorting Test Manual: Revised and Expanded. Odessa, FL: Psychological Assessment Resources, Inc; 1993. [Google Scholar]
- 38.Delis DC, Kramer JH, Kaplan E, Ober BA. California Verbal Learning Test Manual, Children's Version. San Antonio: The Psychological Corporation; 1994. [Google Scholar]
- 39.Delis DC, Kramer JH, Kaplan E, Ober BA. California Verbal Learning Test. 2. San Antonio, TX: The Psychological Corporation; 2000. (CVLT-II) [Google Scholar]
- 40.Gioia GA, Isquith PK, Guy SC, Kenworthy L. Behavior Rating Inventory of Executive Function (BRIEF) Lutz, FL: Psychological Assessment Resources, Inc; 2000. [Google Scholar]
- 41.Basser PJ, Mattiello J, LeBihan D. MR diffusion tensor spectroscopy and imaging. Biophys J. 1994;66:259–67. doi: 10.1016/S0006-3495(94)80775-1. [DOI] [PMC free article] [PubMed] [Google Scholar]
- 42.Takaba J, Abe N, Fukuda H. Evaluation of brain in myotonic dystrophy using diffusion tensor MR imaging. Nippon Hoshasen Gijutsu Gakkai Zasshi. 2003;59:831–8. doi: 10.6009/jjrt.kj00003174212. [DOI] [PubMed] [Google Scholar]
- 43.Rutherford MA, Cowan FM, Manzur AY, Dubowitz LM, Pennock JM, Hajnal JV, et al. MR imaging of anisotropically restricted diffusion in the brain of neonates and infants. J Comput Assist Tomogr. 1991;15:188–98. doi: 10.1097/00004728-199103000-00002. [DOI] [PubMed] [Google Scholar]
- 44.Beaulieu C, Allen PS. Water diffusion in the giant axon of the squid: implications for diffusion-weighted MRI of the nervous system. Magn Reson Med. 1994;32:579–83. doi: 10.1002/mrm.1910320506. [DOI] [PubMed] [Google Scholar]
- 45.Beaulieu C, Allen PS. Determinants of anisotropic water diffusion in nerves. Magn Reson Med. 1994;31:394–400. doi: 10.1002/mrm.1910310408. [DOI] [PubMed] [Google Scholar]
- 46.Beaulieu C. The basis of anisotropic water diffusion in the nervous system - a technical review. NMR Biomed. 2002;15:435–55. doi: 10.1002/nbm.782. [DOI] [PubMed] [Google Scholar]
- 47.Neil JJ, Miller J, Mukherjee P, Huppi PS. Diffusion tensor imaging of normal and injured developing human brain - a technical review. NMR Biomed. 2002;15:543–52. doi: 10.1002/nbm.784. [DOI] [PubMed] [Google Scholar]
- 48.Song SK, Sun SW, Ramsbottom MJ, Chang C, Russell J, Cross AH. Dysmyelination revealed through MRI as increased radial (but unchanged axial) diffusion of water. Neuroimage. 2002;17:1429–36. doi: 10.1006/nimg.2002.1267. [DOI] [PubMed] [Google Scholar]
- 49.Song SK, Sun SW, Ju WK, Lin SJ, Cross AH, Neufeld AH. Diffusion tensor imaging detects and differentiates axon and myelin degeneration in mouse optic nerve after retinal ischemia. Neuroimage. 2003;20:1714–22. doi: 10.1016/j.neuroimage.2003.07.005. [DOI] [PubMed] [Google Scholar]
- 50.Garcia-Alix A, Cabanas F, Morales C, Pellicer A, Echevarria J, Paisan L, et al. Cerebral abnormalities in congenital myotonic dystrophy. Pediatr Neurol. 1991;7:28–32. doi: 10.1016/0887-8994(91)90102-q. [DOI] [PubMed] [Google Scholar]
- 51.Hageman AT, Gabreels FJ, Liem KD, Renkawek K, Boon JM. Congenital myotonic dystrophy; a report on thirteen cases and a review of the literature. J Neurol Sci. 1993;115:95–101. doi: 10.1016/0022-510x(93)90072-7. [DOI] [PubMed] [Google Scholar]
- 52.Sarnat HB, O'Connor T, Byrne PA. Clinical effects of myotonic dystrophy on pregnancy and the neonate. Arch Neurol. 1976;33:459–65. doi: 10.1001/archneur.1976.00500070001001. [DOI] [PubMed] [Google Scholar]
- 53.Giorgio A, Dotti MT, Battaglini M, Marino S, Mortilla M, Stromillo ML, et al. Cortical damage in brains of patients with adult-form of myotonic dystrophy type 1 and no or minimal MRI abnormalities. J Neurol. 2006;253:1471–7. doi: 10.1007/s00415-006-0248-2. [DOI] [PubMed] [Google Scholar]
- 54.Ono S, Takahashi K, Jinnai K, Kanda F, Fukuoka Y, Kurisaki H, et al. Loss of catecholaminergic neurons in the medullary reticular formation in myotonic dystrophy. Neurology. 1998;51:1121–4. doi: 10.1212/wnl.51.4.1121. [DOI] [PubMed] [Google Scholar]
- 55.Ono S, Kanda F, Takahashi K, Fukuoka Y, Jinnai K, Kurisaki H, et al. Neuronal loss in the medullary reticular formation in myotonic dystrophy: a clinicopathological study. Neurology. 1996;46:228–31. doi: 10.1212/wnl.46.1.228. [DOI] [PubMed] [Google Scholar]
- 56.Mizukami K, Sasaki M, Baba A, Suzuki T, Shiraishi H. An autopsy case of myotonic dystrophy with mental disorders and various neuropathologic features. Psychiatry Clin Neurosci. 1999;53:51–5. doi: 10.1046/j.1440-1819.1999.00470.x. [DOI] [PubMed] [Google Scholar]
- 57.Rosman NP, Kakulas BA. Mental deficiency associated with muscular dystrophy. A neuropathological study. Brain. 1966;89:769–88. doi: 10.1093/brain/89.4.769. [DOI] [PubMed] [Google Scholar]
- 58.Chang L, Anderson T, Migneco OA, Boone K, Mehringer CM, Villanueva-Meyer J, et al. Cerebral abnormalities in myotonic dystrophy. Cerebral blood flow, magnetic resonance imaging, and neuropsychological tests. Arch Neurol. 1993;50:917–23. doi: 10.1001/archneur.1993.00540090024006. [DOI] [PubMed] [Google Scholar]
- 59.Kornblum C, Reul J, Kress W, Grothe C, Amanatidis N, Klockgether T, et al. Cranial magnetic resonance imaging in genetically proven myotonic dystrophy type 1 and 2. J Neurol. 2004;251:710–4. doi: 10.1007/s00415-004-0408-1. [DOI] [PubMed] [Google Scholar]
- 60.Miaux Y, Chiras J, Eymard B, Lauriot-Prevost MC, Radvanyi H, Martin-Duverneuil N, et al. Cranial MRI findings in myotonic dystrophy. Neuroradiology. 1997;39:166–70. doi: 10.1007/s002340050385. [DOI] [PubMed] [Google Scholar]
- 61.Ono S, Inoue K, Mannen T, Mitake S, Shirai T, Kanda F, et al. Intracytoplasmic inclusion bodies of the thalamus and the substantia nigra, and Marinesco bodies in myotonic dystrophy: a quantitative morphological study. Acta Neuropathol. 1989;77:350–6. doi: 10.1007/BF00687369. [DOI] [PubMed] [Google Scholar]
- 62.Oyanagi K, Ogawa H, Nakajima T. Rod-like intracytoplasmic inclusions in large neurons of the caudate nucleus: frequent appearance in myotonic dystrophy. Clin Neuropathol. 1994;13:134–8. [PubMed] [Google Scholar]
- 63.Jiang H, Mankodi A, Swanson MS, Moxley RT, Thornton CA. Myotonic dystrophy type 1 is associated with nuclear foci of mutant RNA, sequestration of muscleblind proteins and deregulated alternative splicing in neurons. Hum Mol Genet. 2004;13:3079–88. doi: 10.1093/hmg/ddh327. [DOI] [PubMed] [Google Scholar]
- 64.Oyamada R, Hayashi M, Katoh Y, Tsuchiya K, Mizutani T, Tominaga I, et al. Neurofibrillary tangles and deposition of oxidative products in the brain in cases of myotonic dystrophy. Neuropathology. 2006;26:107–14. doi: 10.1111/j.1440-1789.2006.00662.x. [DOI] [PubMed] [Google Scholar]
- 65.Vermersch P, Sergeant N, Ruchoux MM, Hofmann-Radvanyi H, Wattez A, Petit H, et al. Specific tau variants in the brains of patients with myotonic dystrophy. Neurology. 1996;47:711–7. doi: 10.1212/wnl.47.3.711. [DOI] [PubMed] [Google Scholar]
- 66.Ono S, Inoue K, Mannen T, Kanda F, Jinnai K, Takahashi K. Neuropathological changes of the brain in myotonic dystrophy--some new observations. J Neurol Sci. 1987;81:301–20. doi: 10.1016/0022-510x(87)90105-5. [DOI] [PubMed] [Google Scholar]
- 67.Abe K, Fujimura H, Toyooka K, Yorifuji S, Nishikawa Y, Hazama T, et al. Involvement of the central nervous system in myotonic dystrophy. J Neurol Sci. 1994;127:179–85. doi: 10.1016/0022-510x(94)90071-x. [DOI] [PubMed] [Google Scholar]
- 68.Sinforiani E, Sandrini G, Martelli A, Mauri M, Uggetti C, Bono G, et al. Cognitive and neuroradiological findings in myotonic dystrophy. Funct Neurol. 1991;6:377–84. [PubMed] [Google Scholar]
- 69.Damian MS, Bachmann G, Herrmann D, Dorndorf W. Magnetic resonance imaging of muscle and brain in myotonic dystrophy. J Neurol. 1993;240:8–12. doi: 10.1007/BF00838438. [DOI] [PubMed] [Google Scholar]
- 70.Weber YG, Roebling R, Kassubek J, Hoffmann S, Rosenbohm A, Wolf M, et al. Comparative analysis of brain structure, metabolism, and cognition in myotonic dystrophy 1 and 2. Neurology. 2010;74:1108–17. doi: 10.1212/WNL.0b013e3181d8c35f. [DOI] [PubMed] [Google Scholar]
- 71.Damian MS, Schilling G, Bachmann G, Simon C, Stoppler S, Dorndorf W. White matter lesions and cognitive deficits: relevance of lesion pattern? Acta Neurol Scand. 1994;90:430–6. doi: 10.1111/j.1600-0404.1994.tb02753.x. [DOI] [PubMed] [Google Scholar]