

Abstract
Background
There are international differences in the epidemiology of depression and the performance of primary care physicians but the factors underlying these national differences are uncertain.
Aim
To examine the international variability in diagnostic performance of primary care physicians when diagnosing depression in primary care.
Design of study
A meta-analysis of unassisted clinical diagnoses against semi-structured interviews.
Method
A systematic literature search, critical appraisal, and pooled analysis were conducted and 25 international studies were identified involving 8917 individuals. A minimum of three independent studies per country were required to aid extrapolation.
Results
Clinicians in the Netherlands performed best at case finding (the ability to rule in cases of depression with minimal false positives) (AUC+ 0.735) and this was statistically significantly better than the ability of clinicians in Australia (AUC+ 0.622) and the US (AUC+ 0.653), who were the worst performers. Clinicians from Italy had intermediate case-finding abilities. Regarding screening (the ability to rule out cases of no depression with minimal false negatives) there were no strong differences. Looking at overall accuracy, primary care physicians in Italy and the Netherlands were most successful in their diagnoses and physicians from the US and Australia least successful (83.5%, 81.9%, 74.3%, and 67.0%, respectively). GPs in the UK appeared to have the lowest ability to detect depression, as a proportion of all cases of depression (45.6%; 95% CI = 27.7% to 64.2%). Several factors influenced detection accuracy including: collecting data on clinical outcomes; routinely comparing the clinical performance of staff; working in small practices; and having long waits to see a specialist.
Conclusion
Assuming these differences are representative, there appear to be international variations in the ability of primary care physicians to diagnose depression, but little differences in screening success. These might be explained by organisational factors.
Keywords: depression, diagnostic accuracy, international, screening, sensitivity
INTRODUCTION
Depression is one of the most common mental-health problems worldwide.1–3 The study on Psychological Problems in General Health Care (PPGHC), conducted across 14 countries, found that 14% of primary care attendees suffered from major depression;4 a more recent study in six European countries found a lower rate of 8.5% in men.5 Across all settings, best estimates for major depressive disorder are a 1-year prevalence rate of 4.1% (95% confidence interval [CI] = 2.4% to 6.2%), a lifetime risk of 6.7% (95%CI = 4.2% to 10.1%), and an incidence rate of about 9% over 12 months.6
However, it should be noted that there are international differences in the epidemiology of depression, especially when comparing developing (low-income) with developed (high-income) societies.2,7–11 There are also cultural differences in the expression of mental disorders, regardless of national boundaries.12,13 Such differences may impact on the phenomenology, detection, and treatment of depression.14
Regarding symptoms, in some cultures conventional concepts of depression taken from the International Classification of Diseases and the Diagnostic and Statistical Manual of Mental Disorders may not hold.15,16 For example, low mood may not be a universal core feature of the disorder;17 similarly, rates of somatic symptoms as a presenting complaint of depression vary considerably.18,19
How this fits in
It is known that there are international differences in the epidemiology and phenomenology of depression. This study shows that there are also international differences in the case-finding performance of primary care physicians and that these might be partly explained by organisational factors. These appear to include collecting routine outcome data, comparing the clinical performance of staff and working autonomously.
Regarding treatment differences, a number of large international studies reveal low treatment rates in less-developed countries (between 3% and 23%), although this is dependent on prior diagnostic success.10,20 In developed countries about one-quarter to one-third of those with mental illness receive no treatment.21
Regarding diagnostic differences, typical diagnostic sensitivity and specificity among primary care physicians has been previously reported but Mitchell et al did not fully examine national differences.22 However, there is reason to suspect that variations exist because the World Health Organization (WHO) PPGHC study found considerable cross-national differences. Rates of identification (diagnostic sensitivity) ranged from a low of 19.3% in Nagasaki, Japan to 74.0% in Santiago de Chile, Chile.23,24 In a related report from the WHO study, Munitz et al reported on diagnostic rates of depression in a subset of 1199 patients in six countries.25 They found substantial differences and suggested that these might result from difficulties conceptualising depression by the physician and not necessarily differences in clinical presentation. For example, many clinicians in other countries may not consider depression to be categorical and may prefer a continuum of mood change.26
One unresolved question is whether such differences are amenable to change; in addition there is also speculation regarding whether scales or tools contribute to improved identification of depression in primary care. Although the validity of depression scales has been extensively studied in high-income countries,27 it has been investigated less in low and middle-income countries with some data from India,28,29 Ethiopia,30 Burkina Faso,31 Chile,32 and Brazil.33 No research to date has shown high uptake of such tools in routine care. Further, well-designed studies demonstrating beneficial patient outcomes are lacking (with no data in low and middle-income countries) even though research supports application by non-physicians and community health workers.34,35
Despite the strengths of the WHO's PPGHC study, its major limitation is that only diagnostic sensitivity was reported and no information on specificity or overall accuracy was recorded. Therefore, this study's aim was to summarise international rates of recognition of depression by pooling smaller-scale studies that incorporated both sensitivity and specificity. This was limited to high-income countries as there were no qualifying studies in low or middle-income settings.
The second aim was to examine service-level predictors of accuracy that might explain such variations. For the purposes of this review, case identification was defined as the application of a tool to identify (rule in) individuals with the index disorder. Screening was defined as the systematic application of a tool to rule out individuals without the index disorder.
METHOD
Inclusion and exclusion criteria
Diagnoses of depression by clinicians from high-income countries were examined as there were no available studies reporting specificity in low or middle-income settings. In 2006, the World Bank considered 60 countries – including the UK, Australia, Italy, the Netherlands, and the US – to have high-income economies (defined as a gross national income per capita in 2006 of ≥US$11 116).36
The principle inclusion criteria were studies that examined the diagnostic accuracy of primary care physicians' clinical ability to detect depression, defined by semi-structured interview. Studies relying on mood questionnaires alone were excluded as such methods are not accepted as an adequate criterion standard. In order to attempt to gain a representative sample, a minimum of three methodologically similar independent studies were required from any individual country to enter the meta-analysis. In all cases it was required that case ascertainment was conducted by contemporaneous interview or questionnaire. Studies employing case ascertainment by casenote method (chart review) were excluded. Studies were not restricted on the basis of age of the recruited patients.
Search and critical appraisal
This study's methods have been previously reported.22 In brief, a systematic literature search, critical appraisal, and pooled analysis were conducted. The abstract databases of Medline/Pubmed, PsycINFO, and Embase were searched from inception to September 2009. In the full-text collections of Science Direct, Ingenta Select, Ovid Full text, and Wiley-Blackwell Interscience, the same search terms were used but as a full-text search and citation search. The abstract databases SCOPUS and Web of Knowledge (4.1, Institute for Scientific Information) were searched using key papers in a reverse citation search. Data were extracted using a standardised spreadsheet by two authors and re-examined by a further author independently.
Meta-analysis and meta-regression
In order to account for sample-size variations a meta-analytic weighted rate was calculated for sensitivity and specificity.37 Where heterogeneity was moderate to high, a random effects meta-analysis was performed using StatsDirect (version 2.6.2). A Bayesian plot of conditional probabilities that converts hypothetical sensitivity and specificity into interpretable conditional post-test probabilities from all pre-test probabilities was also constructed.38,39 The area under the Bayesian positive curve (AUC+) allows statistical comparison of rule-in success and the area above the negative curve (AUC–) allows statistical comparison of rule-out success, without interference from prevalence variations. These can be calculated simply using Microsoft Excel®.40
A meta-regression that examines the significance of predictor variables that might explain various types of diagnostic accuracy was performed. Predictor variables (Appendix 1) were chosen from a large 2009 survey of primary care practices across 11 countries and involving 10 320 primary care physicians.41
RESULTS
Study description and methods
Twenty-five international studies were identified from five high-income countries, involving 8917 individuals. There were four studies from Australia,42–45 four from Italy,46–49 six from the Netherlands,50–55 three from the UK,56–58 and eight from the US,59–66 all reporting diagnostic sensitivity (Table 1).
Table 1.
Studies of primary care physicians' ability to diagnose depression against psychiatric interviews.
| Country | Study | Number of clinicians | Sample age | Gold-standard description of interview method | Total sample | Sensitivity | Specificity | PPV | NPV | Fraction correct |
|---|---|---|---|---|---|---|---|---|---|---|
| Australia | Wilhelm et al42 | 36 | Adult | CIDI for DSM-IV MDD | 371 | 0.468 | 0.843 | 0.301 | 0.916 | 0.624 |
| Australia | Bowers et al43 | 11 | Older | DIS (DSM-III-R) | 101 | 0.600 | 0.628 | 0.220 | 0.900 | 0.624 |
| Australia | O'Connor et al44 | 30 | Older | CIE via interview by researchers after 1–15 weeks | 995 | 0.754 | 0.612 | 0.113 | 0.974 | 0.621 |
| Australia | Pond et al45 | 13 | Older | CIE using ICD-10 criteria | 105 | 0.500 | 0.774 | 0.222 | 0.923 | 0.743 |
| Italy | Balestriere et al46 | 25 | Adult and older (26.9% >64 years) | Personal Health Questionnaire (cut-off 9) for ICD-10 and HDRS17 by trained researcher | 2093 | 0.389 | 0.937 | 0.491 | 0.907 | 0.863 |
| Italy | Menchetti et al47 | 191 | Adult (14–92 years) | Two-stage screen (GHQ>5 then ICD-10 interview | 299 | 0.739 | NR | NR | NR | NR |
| Italy | Pini et al48 | 46a | Adult | CIDI-Primary Health Care Version (ICD-10 current depression or dysthymia) | 189 | 0.712 | 0.683 | 0.547 | 0.816 | 0.693 |
| Italy | Turrina et al49 | 14 | Older | GHQ12 (2v3) then Geriatric Mental State Examination for DSM-III-R | 255 | 0.719 | 0.711 | 0.571 | 0.825 | 0.714 |
| The Netherlands | Aben et al50 | 39 | Adult | SCID for DSM-IV | 58 | 0.379 | 0.897 | 0.786 | 0.591 | 0.638 |
| The Netherlands | Ormel et al51 | 25 | Adult | PSE for depression and depression with comorbid anxiety | 1315 | 0.658 | 0.836 | 0.395 | 0.938 | 0.811 |
| The Netherlands | Tiemens et al52 | 10 | Adult | CIDI-Primary Health Care version (ICD-10 current depression) | 136 | 0.706 | NR | NR | NR | NR |
| The Netherlands | Van Weel-Baumgart et al53 | 4a | Adult | CIDI for DSM-IV MDD | 99 | 0.788 | 0.894 | 0.788 | 0.894 | 0.859 |
| The Netherlands | Van Marwijk et al54 | 13 | Older | DIS conducted subsequently at the patients home by trained interviewer [DSM-III] | 580 | 0.261 | 0.927 | 0.235 | 0.936 | 0.874 |
| The Netherlands | Licht-Strunk et al55 | NR | Older (>55 years) | Two-stage screen (GDS-15 then PRIME-MD from DSM-IV | 73 | 0.329 | NR | NR | NR | NR |
| UK | Gledhill et al56 | 10 | Adolescent (13–17 years) | K-SADS Psychiatric research interview | 38 | 0.200 | 0.857 | 0.333 | 0.750 | 0.684 |
| UK | Tylee et al57 | 36 | Adult | GHQ30 and then combined clinical interview | 430 | 0.416 | NR | NR | NR | NR |
| UK | Ronalds et al58 | 13 | Adult (16–78 years) | GHQ28 (5v6) then Psychiatric Assessment Schedule for DSM-III-R | 148 | 0.628 | NR | NR | NR | NR |
| US | Borowsky et al59 | 349 | Adult and older (38.4% >51 years) | DIS for DSM-III | 661 | 0.352 | NR | NR | NR | NR |
| US | Gerber et al60 | 4 | Adult and older (33.3% >64 years) | Two-stage screen (step 1: screening on the Hopkins Symptom checklist; step 2: SADS interview by psychiatrists | 268 | 0.571 | 0.842 | 0.623 | 0.812 | 0.757 |
| US | Jones et al61 | 20 | Adult | GHQ 28 and DIS (DSM-III dysthymic disorder or major depression) | 21 | 0.333 | NR | NR | NR | NR |
| US | Klinkman et al62 | 50 | Adult and older | SCID (DSM-III-R) | 425 | 0.346 | 0.788 | 0.186 | 0.896 | 0.73 |
| US | Schwenk et al63 | 50 | Adult and older | Research interview with SCID (DSM-III-R Mj and other depressions) and HDRS | 92 | 0.315 | NR | NR | NR | NR |
| US | Simon and VonKorff64 | NR | Adult | Two-stage screen (GHQ-12 and CIDI interview) | 64 | 0.641 | NR | NR | NR | NR |
| US | Strauss et al65 | 2 | Adult | SCID (DSM-IV) interview | 52 | 0.615 | NR | NR | NR | NR |
| US | Von Korff et al66 | 45 | Adult and older (34% >64 years) | DIS [DSM-III-R] | 49 | 0.755 | NR | NR | NR | NR |
Number of GP practices, not individuals.
CIDI = Composite International Diagnostic Interview. CIE = Canberra Interview for the Elderly. DIS = Diagnostic Interview Schedule. DSM = Diagnositc and Statistical Manual of Mental Disorders. GDS = Geriatric Depression Scale. GHQ = General Health Questionnaire. HDRS = Hamilton Depression Rating Scale. K-SADS = Kiddie-SADS. MDD = major depressive disorder. Mj = major. NPV = negative predictive value calculated from data. NR = not reported. PPV = positive predictive value calculated from data. PRIME-MD = Primary Care Evaluation of Mental Disorders. PSE = Present State Examination. SCID = Structured Clinical Interview. SCL = The Symptom Checklist.
Prevalence
As expected, prevalence varied by country with the highest rates of depression occurring in Italy (27.4% 95% CI = 17.5% to 38.5%) and the Netherlands (22.7%; 95% CI = 12.5% to 34.9%). Lower rates were recorded in the UK (15.6%; 95% CI = 3.2% to 34.9%) and the US (12.5%; 95% CI = 7.4% to 18.7%), with the lowest rate in Australia (10.9%; 95% CI = 6.4% to 16.3%).
Diagnostic sensitivity and specificity
The highest rates for clinicians' diagnostic sensitivity was seen in Italy 64.0% (95% CI = 43.6% to 82.1%) but this was not statistically significantly greater than the rates of other countries. Moderate accuracy was found in Australia (59.1%; 95% CI = 42.4% to 74.7%) and the Netherlands (52.5%; 95% CI = 36.2% to 68.6%). Lowest sensitivity was recorded by clinicians in the US (49.2%; 95% CI = 37.6% to 60.7%) and the UK (45.6%; 95% CI 27.7% to 64.2%).
Regarding the ability to reassure those without depression the highest accuracy came from clinicians in the Netherlands (88.5%; 95% CI = 81.6% to 93.9%) but this was not statistically significantly greater than that of other countries. Fair diagnostic specificity was also recorded in studies from the US (81.1%; 95% CI = 75.6% to 86.0%) and Italy (79.3%; 95% CI = 55.5% to 95.5%). Lowest accuracy was present in Australia (71.9%; 95% CI 57.3% to 84.4%). No results were reported from the UK.
Bayesian cross–national comparison of accuracy
After converting sensitivity and specificity into rule-in and rule-out accuracy, clinicians in the Netherlands performed best at case finding (AUC+ 0.735; 95% CI = 0.698 to 0.772). This was statistically superior to clinicians from both Australia (AUC+ 0.622; 95% CI = 0.569 to 0.674) and US (AUC+ 0.653; 95% CI = 0.624 to 0.682). Clinicians from Italy had intermediate case-finding abilities (AUC+ 0.678; 95% CI = 0.655 to 0.702) (Figure 1).
Figure 1.
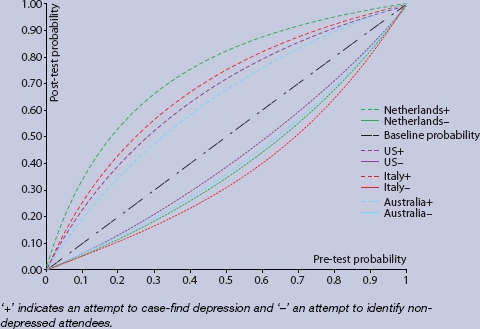
Plot of conditional probabilities for crossnational differences in rulein and rule-out accuracy of depression by GPs.
Regarding screening (the ability to rule-out cases of no depression with minimal false negatives), there were no strong differences between clinicians, although those from Italy performed best (AUC– 0.628; 95% CI = 0.604 to 0.653) and those from the US worst (AUC– 0.577; 95% CI = 0.547 to 0.606). Clinicians from the Netherlands (AUC– 0.602; 95% CI = 0.561 to 0. 0.642) and Australia (AUC– 0.593; 95% CI = 0.540 to 0.645) occupied a middle ground. No results were reported from the UK. Combining both rule-in and rule-out accuracy (combined AUC) showed that clinicians from the Netherlands and Italy were most accurate in their diagnoses.
Comparison of overall true positive and true negative performance (fraction correct statistic) confirmed that significantly higher performance was seen in Italy (83.5%; 95% CI = 82.0% to 84.9%) and the Netherlands (81.9%; 95% CI = 80.2% to 83.5%) as compared with the US (74.3%; 95% CI = 70.9% to 77.4%) and Australia (67.0%; 95% CI = 64.7% to 69.3%). No results were reported from the UK. Data from a single study in an adolescent sample56 hinted at low overall accuracy in the UK (Table 1).
Predictors of diagnostic accuracy
Sensitivity and specificity
There were no statistically significant predictors of diagnostic sensitivity, although long waiting times to see a specialist were linked to sensitivity with a B coefficient of 0.31 and a trend of P = 0.061. Two variables influenced detection specificity. These were ‘clinical outcomes’ (B coefficient of 0.35, P = 0.003) and ‘clinicians compared’ (B = 0.16, P = 0.02).
Rule-in and rule-out accuracy
Two variables were linked with rule-in performance (AUC+): ‘difficulty ordering tests’ (B = –0.10, P = 0.07) and ‘small practices’ (B = 0.24, P = 0.02). Two variables were linked with rule-out performance (AUC–) namely ‘difficulty ordering tests’ (B = –0.12, P = 0.06) and ‘long waits’ (B = 0.18, P = 0.03).
DISCUSSION
Summary of main findings
This research employed studies with similar case-ascertainment and criterion standards to enhance comparability. After examining diagnostic sensitivity, a substantial difference was found in that clinicians in Italy identified almost two-thirds of depressed individuals correctly (64.0%; 95% CI = 43.6% to 82.1%) whereas those in UK and US identified less than half of depressed individuals presenting in primary care. However, due to limitations in sample size (particularly in Italy and UK-based studies) this was not statistically significant. It is possible that these differences in diagnoses related to variations in prevalence, as rates of depression were also highest in Italy and relatively low in the UK and the US. However, after weighting for sample size and adjusting for prevalence it was found that clinicians in the Netherlands performed best at depression case finding (the ability to rule-in depressed cases with minimal false positives) and this was significantly better than the ability of clinicians in Australia and the US. Clinicians from Italy had intermediate case-finding abilities. Regarding screening (the ability to rule-out non-depressed cases with minimal false negatives) there were no strong differences between clinicians as each national group performed similarly in this regard. Taking all correct classifications together, the overall accuracy of primary care physicians in Netherlands and Italy was superior to the accuracy of clinicians from the US and Australia.
Limitations of the study
This analysis has several important limitations. It is difficult to ensure the diagnostic rates are representative of practices across an entire country. To address this, a minimum of three methodologically similar studies were required from any individual country to enter the meta-analysis; however, there is no guarantee that practice from these studies is representative of the country as a whole. In fact, looking at national differences, there was considerable variability even within individual countries; for example, a sensitivity of between 26.1% and 78.8% in the Netherlands (unadjusted national differences without allowance for prevalence variations).
It was required that each study had to share the same method of case ascertainment, that is prospective physician opinion by interview or questionnaire, but clinicians were asked subtly different questions about their clinical opinion and this could influence results. Studies based on casenote methods, which often generate substantially different results,67 were excluded as were studies with a significant training component. In fact, only one casenote study was found that had a sufficient sample and, thus, no cross-national comparisons based on casenotes could be made.
A further limitation was the inclusion of studies based on patients of any age. In studies from Australia three out of four involved older people, whereas in other settings these were in the minority. Also, inter-rater reliability statistics were not calculated.
A final limitation was that it was not possible to sufficiently examine all possible predictors of recognition such as healthcare organisation, physician payment system, clinician workload, or catchment area. This was disappointing but these factors had not been adequately recorded.
Comparison with existing literature
Previously, one international study found significant differences in recognition according to country of study. High rates of diagnostic sensitivity (≥50%) were found in Manchester, Paris, Santiago, Seattle, and Verona, and low rates (≤20%) in Ankara, Athens, Ibadan, Nagasaki, and Shanghai.23 The current study used an entirely different approach to the large interview-based study reported by Simon et al.23 Data were pooled from multiple studies of physician practices in five countries (four in the case of specificity). Studies with similar case-ascertainment and criterion standards were used to enhance comparability.
What factors might positively influence low detection rates in some countries? This meta-regression compared 28 nationally-representative service-related factors that might influence diagnostic sensitivity and specificity. It was found that, if a practice routinely reviews data on clinical outcomes and if a practice routinely compared the clinical performance of staff with other practices, diagnostic specificity appeared to be higher. This is coherent with a model that suggests that increased performance monitoring may improve clinical performance.
It was found that working in small practices (of less than two full-time equivalents) influenced case-finding ability as did ease of ordering specialised diagnostic tests. Ease of ordering tests also influenced screening accuracy as did GPs reporting long waits to see a specialist. The combination of small practices and poor access to specialist services is interesting as it may force practitioners to be more self-reliant and perhaps improve continuity of care. One potentially important factor – whether practices routinely used written guidance for depression – was not statistically significant.
There have been few direct observation studies on the accuracy of clinicians stratified by national or cultural groups. Leo et al found few differences when comparing diagnoses for Caucasian and African–Americans patients.68 Yet there are acknowledged differences in phenomenology between these groups.69–71 It is possible that depression presents differently in some countries. For example, it is known that in some cultures Westernised concepts from ICD and DSM may not apply.15,16 It has been reported that somatic symptoms are the commonest presenting features of depression in high income countries.72,73 but against this Chang et al found Koreans were more likely to express the symptoms like ‘low energy’ and ‘concentration difficulty’, and less like ‘depressed mood’ and ‘thoughts of death’ during an episode of major depressive disorder compared with a US population.74 Similarly there are also variations in the classic psychological symptoms of depression.75–77
Beyond diagnosis, previous studies have found important variations in delivery of care. Many authors have commented on national differences in management of depression.20,78–80 In Europe and the US, 74% and 67% of those with mental illness, respectively, receive no adequate treatment.21,24 In the European Study of Epidemiology of Mental Disorders project conducted in Belgium, France, Germany, Italy, the Netherlands and Spain,24 6% of the sample was defined as being in need of mental health care but 48% of these participants reported no formal healthcare use. After initiating treatment, between 70% (Germany) and 95% (Italy) receive some kind of follow-up care.81 Recently these inequalities have been recognised and considerable effort has been made in the UK, Australia, and Canada to increase the efficiency of mental health care in primary care settings.82–84
Implications for future research
This study shows that diagnostic sensitivity across clinicians in high-income countries varies but variation is less than previously recorded between high-income and low-income settings. Interestingly, there were no appreciable differences in diagnostic specificity. Primary care physicians in the Netherlands and Italy were most successful in their diagnoses and those in the US, Australia (and perhaps the UK) were least successful. Factors that enhanced detection included: access to better healthcare resources but poorer access to hospital specialists; working in small practices; having routine review of clinical outcomes; and routine review of clinical performance of staff. Further investigation might reveal whether these organisation factors can be exported into countries where clinicians are less successful at identifying depression in primary care.
Acknowledgments
Thanks to the staff of the postgraduate medical library, Leicester General Hospital.
Appendix 1 Predictor variables in meta-regression
| GP register | GP required to register |
| Gatekeeper | GP takes a gatekeeper role for referrals |
| Small practices | Small practice percentage (less than two full-time equivalents) |
| EMR | Proportion using electronic medical record in practice (% yes) |
| Highly electronic | Highly electronic function in practice |
| Low function | Low function of electronic support systems |
| After hours | After-hours arrangement without recourse to accident and emergency (% yes) |
| Difficult paying | Doctors report patients have difficulty paying for medication (% often) |
| Difficulty ordering tests | Doctors report patients have difficulty getting specialised diagnostic tests (% often) |
| Long waits | Doctors report patients have long waits to see a specialist (% often) |
| Time due to restrictions | Time spent getting treatments due to insurance/coverage restrictions (% major problem) |
| Guidance for diabetes | Practice routinely used written guidance for diabetes |
| Guidance for depression | Practice routinely used written guidance for depression |
| Non-physicians | Practice uses non-physicians to manage care |
| Written | Written instructions routinely given for managing chronic conditions at home |
| Meds list | Practice give patients written list of medications (% routinely) |
| High satisfaction | Doctor receives extra financial support/incentive based on high satisfaction |
| High targets | Doctor receives extra financial support/incentive based on achieving clinical targets |
| Chronic dis | Doctor receives extra financial support/incentive based on managing chronic disease |
| Preventive | Doctor receives extra financial support/incentive based on preventive care |
| Non-physicians added | Doctor receives extra financial support/incentive based on adding non-physicians to practice |
| Non-face-to-face | Doctor receives extra financial support/incentive based on non-face-to-face interactions with patients |
| Incentives | Doctor receives extra financial support/incentive based on any incentives |
| Clinical outcomes | Practice routines reviews data on clinical outcomes |
| Patient experience | Practice routines reviews data on patient experience |
| Reviews | Doctors performances reviewed against targets at least annually |
| Compared | Practice's clinical performance compared with other practices (% routinely) |
| AES | Practice has process for identifying adverse events and taking action |
| Time wasted | Time spent reporting clinical information or meeting regulations (% major problem) |
Competing interests
The authors have stated that there are none.
Discuss this article
Contribute and read comments about this article on the Discussion Forum: http://www.rcgp.org.uk/bjgp-discuss
REFERENCES
- 1.World Health Organization. Mental and neurological disorders. Geneva: Department of Mental Health and Substance Dependence; 2001. [Google Scholar]
- 2.Wittchen HU, Jacobi F. Size and burden of mental disorders in Europe —a critical review and appraisal of 27 studies. Eur Neuropsychopharmacol. 2005;15(4):357–376. doi: 10.1016/j.euroneuro.2005.04.012. [DOI] [PubMed] [Google Scholar]
- 3.Kessler RC, Aguilar-Gaxiola S, Alonso J, et al. The global burden of mental disorders: an update from theWHOWorldMental Health (WMH) surveys. Epidemiol Psychiatr Soc. 2009;18(1):23–33. doi: 10.1017/s1121189x00001421. [DOI] [PMC free article] [PubMed] [Google Scholar]
- 4.Üstün TB, Von Korff M. Primary mental health services. In: Üstün TB, Sartorius N, editors. Mental illness in general health care: an international study. Chichester: JohnWiley & Sons; 1995. pp. 347–360. [Google Scholar]
- 5.King M, Nazareth I, Levy G, et al. Prevalence of common mental disorders in general practice attendees across Europe. Br J Psychiatr. 2008;192(5):362–367. doi: 10.1192/bjp.bp.107.039966. [DOI] [PubMed] [Google Scholar]
- 6.Waraich P, Goldner EM, Somers JM, Hsu L. Prevalence and incidence studies of mood disorders: a systematic review of the literature. Can J Psychiatry. 2004;49(2):124–138. doi: 10.1177/070674370404900208. [DOI] [PubMed] [Google Scholar]
- 7.Andrade L, Caraveo-Anduaga JJ, Berglund P, et al. The epidemiology of major depressive episodes: results from the International Consortium of Psychiatric Epidemiology (ICPE) Surveys. Int J Methods Psychiatr Res. 2003;12(1):3–21. doi: 10.1002/mpr.138. [DOI] [PMC free article] [PubMed] [Google Scholar]
- 8.Manson SM. Culture and major depression. Current challenges in the diagnosis of mood disorders. Psychiatr Clin North Am. 1995;18(3):487–501. [PubMed] [Google Scholar]
- 9.Patten SB. International differences in major depression prevalence: what do they mean? J Clin Epidemiol. 2003;56(8):711–716. doi: 10.1016/s0895-4356(03)00090-8. [DOI] [PubMed] [Google Scholar]
- 10.Demyttenaere K, Bruffaerts R, Posada-Villa J, et al. Prevalence, severity, and unmet need for treatment of mental disorders in the World Health OrganizationWorldMental Health Surveys. JAMA. 2004;291(21):2581–2590. doi: 10.1001/jama.291.21.2581. [DOI] [PubMed] [Google Scholar]
- 11.De Girolamo G, Alonso J, Vilagut G. The ESEMeD-WMH project: strengthening epidemiological research in Europe through the study of variation in prevalence estimates. Epidemiol Psichiatr Soc. 2006;15(3):167–173. doi: 10.1017/s1121189x00004401. [DOI] [PubMed] [Google Scholar]
- 12.Parker G, Gladstone G, Chee KT. Depression in the planet's largest ethnic group: the Chinese. Am J Psychiatry. 2001;158(6):857–864. doi: 10.1176/appi.ajp.158.6.857. [DOI] [PubMed] [Google Scholar]
- 13.Iwata N, Buka S. Race/ethnicity and depressive symptoms: a cross-cultural/ethnic comparison among university students in East Asia, North and South America. Soc SciMed. 2002;55(12):2243–2252. doi: 10.1016/s0277-9536(02)00003-5. [DOI] [PubMed] [Google Scholar]
- 14.Tempier R, Meadows GN, Vasiliadis HM, et al. Mental disorders and mental health care in Canada and Australia: comparative epidemiological findings. Soc Psychiatry Psychiatr Epidemiol. 2009;44(1):63–72. doi: 10.1007/s00127-008-0409-y. [DOI] [PubMed] [Google Scholar]
- 15.Halbreich U, Alarcon RD, Calil H, et al. Culturally-sensitive complaints of depressions and anxieties in women. J Affect Disord. 2007;102(1-3):159–176. doi: 10.1016/j.jad.2006.09.033. [DOI] [PubMed] [Google Scholar]
- 16.Thakker J, Ward T. Culture and classification: The cross-cultural application of the DSM-IV. Clin Psychol Rev. 1998;18(5):501–529. doi: 10.1016/s0272-7358(97)00107-4. [DOI] [PubMed] [Google Scholar]
- 17.Bebbington P. Transcultural aspects of affective disorders. Int Rev Psychiatry. 1993;5(3):145–156. [Google Scholar]
- 18.Simon GE, VonKorff M, Piccinelli M, et al. An international study of the relation between somatic symptoms and depression. N Engl JMed. 1999;341(18):1329–1335. doi: 10.1056/NEJM199910283411801. [DOI] [PubMed] [Google Scholar]
- 19.Parker G, Cheah YC, Roy K. Do the Chinese somatize depression? A cross-cultural study. Soc Psychiatry Psychiatr Epidemiol. 2001;36(6):287–293. doi: 10.1007/s001270170046. [DOI] [PubMed] [Google Scholar]
- 20.Simon GE, Fleck M, Lucas R, et al. Prevalence and predictors of depression treatment in an international primary care study. Am J Psychiatry. 2004;161(9):1626–1634. doi: 10.1176/appi.ajp.161.9.1626. [DOI] [PubMed] [Google Scholar]
- 21.Kessler RC, Demler O, Frank RG, et al. Prevalence and treatment of mental disorders, 1990 to 2003. N Engl J Med. 2005;352(24):2515–2523. doi: 10.1056/NEJMsa043266. [DOI] [PMC free article] [PubMed] [Google Scholar]
- 22.Mitchell AJ, Vaze A, Rao S. Clinical diagnosis of depression in primary care: a meta-analysis. Lancet. 2009;374(9690):609–619. doi: 10.1016/S0140-6736(09)60879-5. [DOI] [PubMed] [Google Scholar]
- 23.Simon GE, Goldberg D, Tiemens BG, Ustun TB. Outcomes of recognized and unrecognized depression in an international primary care study. Gen Hosp Psychiatry. 1999;21(2):97–105. doi: 10.1016/s0163-8343(98)00072-3. [DOI] [PubMed] [Google Scholar]
- 24.Alonso J, Codony M, Kovess V, et al. Population level of unmet need for mental healthcare in Europe. Br J Psychiatry. 2007;190:299–306. doi: 10.1192/bjp.bp.106.022004. [DOI] [PubMed] [Google Scholar]
- 25.Munitz H, Valevski A, Weizman A, et al. Recognition and treatment of depression in primary care settings in 6 different countries: a retrospective file analysis by WHO. Eur J Psychiatry. 2000;14(2):85–93. [Google Scholar]
- 26.Parker G. Classifying depression: should paradigms lost be regained? Am J Psychiatry. 2000;157(8):1195–1203. doi: 10.1176/appi.ajp.157.8.1195. [DOI] [PubMed] [Google Scholar]
- 27.Gilbody S, Sheldon T, House A. Screening and case–finding instruments for depression: a meta-analysis. CMAJ. 2008;178(8):997–1003. doi: 10.1503/cmaj.070281. [DOI] [PMC free article] [PubMed] [Google Scholar]
- 28.Patel V, Araya R, Chowdhary N, et al. Detecting common mental disorders in primary care in India: a comparison of five screening questionnaires. PsycholMed. 2008;38(2):221–228. doi: 10.1017/S0033291707002334. [DOI] [PMC free article] [PubMed] [Google Scholar]
- 29.Biswas SS, Gupta R, Vanjare HA, et al. Depression in the elderly in Vellore, South India: the use of a two-question screen. Int Psychogeriatr. 2009;21(2):369–371. doi: 10.1017/S1041610208008259. [DOI] [PubMed] [Google Scholar]
- 30.Hanlon C, Medhin G, Alem A, et al. Detecting perinatal common mental disorders in Ethiopia: validation of the self-reporting questionnaire and Edinburgh Postnatal Depression Scale. J Affect Disord. 2008;108(3):251–262. doi: 10.1016/j.jad.2007.10.023. [DOI] [PubMed] [Google Scholar]
- 31.Baggaley RF, Ganaba R, Filippi V, et al. Detecting depression after pregnancy: the validity of the K10 and K6 in Burkina Faso. TropMed Int Health. 2007;12(10):1225–1229. doi: 10.1111/j.1365-3156.2007.01906.x. [DOI] [PubMed] [Google Scholar]
- 32.Lewis G, Araya RI. Is the General Health Questionnaire (12 item) a culturally biased measure of psychiatric disorder? Soc Psychiatry Psychiatr Epidemiol. 1995;30(1):20–25. doi: 10.1007/BF00784430. [DOI] [PubMed] [Google Scholar]
- 33.Mari JJ, Williams P. A comparison of the validity of two psychiatric screening questionnaires (GHQ-12 and SRQ-20) in Brazil, using Relative Operating Characteristic (ROC) analysis. PsycholMed. 1985;15(3):651–659. doi: 10.1017/s0033291700031500. [DOI] [PubMed] [Google Scholar]
- 34.Bolton P. Cross-cultural validity and reliability testing of a standard psychiatric assessment instrument without a gold standard. J Nerv Ment Dis. 2001;189(4):238–242. doi: 10.1097/00005053-200104000-00005. [DOI] [PubMed] [Google Scholar]
- 35.Kaaya SF, Fawzi MC, Mbwambo JK, et al. Validity of the Hopkins Symptom Checklist-25 amongst HIV-positive pregnant women in Tanzania. Acta Psychiatr Scand. 2002;106(1):9–19. doi: 10.1034/j.1600-0447.2002.01205.x. [DOI] [PMC free article] [PubMed] [Google Scholar]
- 36.World Bank. Data and statistics: country classification. Washington, DC: The World Bank; 2006. [Google Scholar]
- 37.Macaskill P, Glasziou P, Irwig L. Meta-analysis of diagnostic tests. In: Armitage P, Colton T, editors. Encyclopedia of biostatistics. 2nd edn. Chichester: John Wiley & Sons; 2005. [Google Scholar]
- 38.Diamond GA, Forrester JS, Hirsch M, et al. Application of conditional probability analysis to the clinical diagnosis of coronary artery disease. J Clin Invest. 1980;65(5):1210–1221. doi: 10.1172/JCI109776. [DOI] [PMC free article] [PubMed] [Google Scholar]
- 39.Maceneaney PM, Malone DE. The meaning of diagnostic test results: a spreadsheet for swift data analysis. Clin Radiol. 2000;55(3):227–235. doi: 10.1053/crad.1999.0444. [DOI] [PubMed] [Google Scholar]
- 40.McClish DK. Combining and comparing area estimates across studies or strata. Med DecisMaking. 1992;12(4):274–279. doi: 10.1177/0272989X9201200405. [DOI] [PubMed] [Google Scholar]
- 41.Schoen C, Osborn R, Doty MM, et al. A survey of primary care physicians in eleven countries, 2009: perspectives on care, costs and experiences. Health Aff (Millwood) 2009;28(6):w1171–1183. doi: 10.1377/hlthaff.28.6.w1171. [DOI] [PubMed] [Google Scholar]
- 42.Wilhelm KA, Finch AW, Davenport TA, Hickie IB. What can alert the general practitioner to people whose common mental health problems are unrecognised? Med J Aus. 2008;188(12 Suppl):S114–S118. doi: 10.5694/j.1326-5377.2008.tb01873.x. [DOI] [PubMed] [Google Scholar]
- 43.Bowers J, Jorm AF, Henderson S, Harris P. General practitioners' detection of depression and dementia in elderly patients. Med J Aust. 1990;153(4):192–196. doi: 10.5694/j.1326-5377.1990.tb136858.x. [DOI] [PubMed] [Google Scholar]
- 44.O'Conner DW, Rosewarne R, Bruce A. Depression in primary care 2: general practitioners' recognition of major depression in elderly patients. Int Psychogeratr. 2001;13(3):367–374. doi: 10.1017/s104161020100775x. [DOI] [PubMed] [Google Scholar]
- 45.Pond CD, Mant A, Kehoe L, et al. General practitioner diagnosis of depression and dementia in the elderly: can academic detailing make a difference? Fam Pract. 1994;11(2):141–147. doi: 10.1093/fampra/11.2.141. [DOI] [PubMed] [Google Scholar]
- 46.Balestrieri M, Carta MG, Leonetti S, et al. Recognition of depression and appropriateness of antidepressant treatment in Italian primary care. Soc Psychiatr Psychiatr Epidemiol. 2004;39(3):171–176. doi: 10.1007/s00127-004-0722-z. [DOI] [PubMed] [Google Scholar]
- 47.Menchetti M, Belvederi Murri M, Bertakis K, et al. Recognition and treatment of depression in primary care: effect of patients' presentation and frequency of consultation. J Psychosom Res. 2009;66(4):335–341. doi: 10.1016/j.jpsychores.2008.10.008. [DOI] [PubMed] [Google Scholar]
- 48.Pini S, Berardi D, Rucci P, et al. Identification of psychiatric distress by primary care physicians. Gen Hosp Psychiatry. 1997;19(6):411–418. doi: 10.1016/s0163-8343(97)00053-4. [DOI] [PubMed] [Google Scholar]
- 49.Turrina C, Caruso R, Este R, et al. Affective disorders among elderly general practice patients: a two-phase survey in Brescia, Italy. Br J Psychiatry. 1994;165(4):533–537. doi: 10.1192/bjp.165.4.533. [DOI] [PubMed] [Google Scholar]
- 50.Aben I, Verhey F, Beusmans G, Lodder J. Recognition and treatment of post-stroke depression in general practice [Depressie na een CVA: Signalering, diagnostiek en behandeling in de huisartsenpraktijk] Huisarts en Wetenschap. 2003;46(9):487–489. [Google Scholar]
- 51.Ormel J, Van Den Brink W, Koeter MW, et al. Recognition, management and outcome of psychological disorders in primary care: a naturalistic follow-up study. Psychol Med. 1990;20(4):909–923. doi: 10.1017/s0033291700036606. [DOI] [PubMed] [Google Scholar]
- 52.Tiemens BG, Ormel J, Jenner JA, et al. Training primary care physicians to recognize, diagnose and manage depression: does it improve patient outcomes? PsycholMed. 1999;29(4):833–845. doi: 10.1017/s0033291799008545. [DOI] [PubMed] [Google Scholar]
- 53.VanWeel-Baumgarten EM, Van Den Bosch WJ, Van Den Hoogen HJ, Zitman FG. The validity of the diagnosis of depression in general practice: is using criteria for diagnosis as a routine the answer? Br J Gen Pract. 2000;50(453):284–287. [PMC free article] [PubMed] [Google Scholar]
- 54.Van Marwijk HWJ, De Bock GH, Hermans J, et al. Prevalence of depression and clues to focus diagnosis. A study among Dutch general practice patients 65+ years of age. Scand J Prim Health Care. 1996;14(3):142–147. doi: 10.3109/02813439609024168. [DOI] [PubMed] [Google Scholar]
- 55.Licht–Strunk E, Beekman AT, De Haan M, Van Marwijk HW. The prognosis of undetected depression in older general practice patients. A one year follow-up study. J Affect Disord. 2009;114(1-3):310–315. doi: 10.1016/j.jad.2008.06.006. [DOI] [PubMed] [Google Scholar]
- 56.Gledhill J, Kramera T, Iliffe S, Garralda ME. Training general practitioners in the identification and management of adolescent depression within the consultation: a feasibility study. J Adolesc. 2003;26(2):245–250. doi: 10.1016/s0140-1971(02)00128-8. [DOI] [PubMed] [Google Scholar]
- 57.Tylee AT, Freeling P, Kerry S. Why do general practitioners recognize major depression in one woman patient yet miss it in another? Br J Gen Pract. 1993;43(373):327–330. [PMC free article] [PubMed] [Google Scholar]
- 58.Ronalds C, Creed F, Stone K, et al. Outcome of anxiety and depressive disorders in primary care. Br J Psychiatry. 1997;171:427–433. doi: 10.1192/bjp.171.5.427. [DOI] [PubMed] [Google Scholar]
- 59.Borowsky SJ, Rubenstein LV, Meredith LS, et al. Who is at risk of nondetection of mental health problems in primary care? J Gen Intern Med. 2000;15(6):381–388. doi: 10.1046/j.1525-1497.2000.12088.x. [DOI] [PMC free article] [PubMed] [Google Scholar]
- 60.Gerber PD, Barrett J, Barrett J, et al. Recognition of depression by internists in primary care: a comparison of internists and ‘gold standard’ psychiatric assessments. J Gen Intern Med. 1989;4(1):7–13. doi: 10.1007/BF02596483. [DOI] [PubMed] [Google Scholar]
- 61.Jones LR, Badger LW, Ficken RP, et al. Inside the hidden mental health network. Examining mental health care delivery of primary care physicians. Gen Hosp Psychiatry. 1987;9(4):287–293. doi: 10.1016/0163-8343(87)90085-5. [DOI] [PubMed] [Google Scholar]
- 62.Klinkman MS, Coyne JC, Gallo S, Schwenk TL. Can case-finding instruments be used to improve physician detection of depression in primary care. Arch FamMed. 1997;6(6):567–573. doi: 10.1001/archfami.6.6.567. [DOI] [PubMed] [Google Scholar]
- 63.Schwenk TL, Coyne JC, Fechner-Bates S. Differences between detected and undetected patients in primary care and depressed psychiatric patients. Gen Hospital Psychiatry. 1996;18(6):407–415. doi: 10.1016/s0163-8343(96)00062-x. [DOI] [PubMed] [Google Scholar]
- 64.Simon GE, VonKorff M. Recognition,management, and outcomes of depression in primary care. Arch Fam Med. 1995;4(2):99–105. doi: 10.1001/archfami.4.2.99. [DOI] [PubMed] [Google Scholar]
- 65.Strauss PR, Gagiano CA, van Rensburg PH, et al. Identification of depression in a rural general practice. S AfrMed J. 1995;85(8):755–759. [PubMed] [Google Scholar]
- 66.Von Korff M, Shapiro S, et al. Anxiety and depression in a primary care clinic: comparison of diagnostic interview schedule, general health questionnaire, and practitioner assessments. Arch Gen Psychiatry. 1987;44(2):152–156. doi: 10.1001/archpsyc.1987.01800140058008. [DOI] [PubMed] [Google Scholar]
- 67.Rhodes AE, Fung K. Self-reported use of mental health services versus administrative records: care to recall? Int JMethods Psychiatr Res. 2004;13(3):165–175. doi: 10.1002/mpr.172. [DOI] [PMC free article] [PubMed] [Google Scholar]
- 68.Leo RJ, Sherry C, Jones AW. Referral patterns and recognition of depression among African-American and Caucasian patients. Gen Hosp Psychiatry. 1998;20(3):175–182. doi: 10.1016/s0163-8343(98)00019-x. [DOI] [PubMed] [Google Scholar]
- 69.Mills TL, Alea NL, Cheong JA. Differences in the indicators of depressive symptoms among a community sample of African–American and Caucasian older adults. Community Men Health J. 2004;40(4):309–331. doi: 10.1023/b:comh.0000035227.57576.46. [DOI] [PubMed] [Google Scholar]
- 70.Ayalon L, Young MA. A comparison of depressive symptoms in African Americans and Caucasian Americans. J Cross Cult Psychol. 2003;34(1):111–124. [Google Scholar]
- 71.Uebelacker LA, Strong D, Weinstock LM, Miller IW. Use of item response theory to understand differential functioning of DSM-IV major depression symptoms by race, ethnicity and gender. Psychol Med. 2009;39(4):591–601. doi: 10.1017/S0033291708003875. [DOI] [PubMed] [Google Scholar]
- 72.Bhatt A, Tomenson B, Benjamin S. Transcultural patterns of somatization in primary care: a preliminary report. J Psychosom Res. 1989;33(6):671–680. doi: 10.1016/0022-3999(89)90082-2. [DOI] [PubMed] [Google Scholar]
- 73.Katon WJ, Walker EA. Medically unexplained symptoms in primary care. J Clin Psychiatry. 1998;59(Suppl 20):15–21. [PubMed] [Google Scholar]
- 74.Chang SM, Hahm BJ, Lee JY, et al. Cross-national difference in the prevalence of depression caused by the diagnostic threshold. J Affect Disord. 2008;106(1-2):159–167. doi: 10.1016/j.jad.2007.07.023. [DOI] [PubMed] [Google Scholar]
- 75.Patel V, Pereira J, Mann AH. Somatic and psychological models of common mental disorders primary care in India. PsycholMed. 1998;28(1):135–143. doi: 10.1017/s0033291797005941. [DOI] [PubMed] [Google Scholar]
- 76.Araya R, Wynn R, Leonard R, Lewis G. Psychiatric morbidity in primary health care in Santiago, Chile. Preliminary findings. Br J Psychiatry. 1994;165(4):530–532. doi: 10.1192/bjp.165.4.530. [DOI] [PubMed] [Google Scholar]
- 77.Patel V, Gwanzura F, Simunyu E, et al. The phenomenology and explanatory models of common mental disorder: a study in primary care in harare, Zimbabwe. Psychol Med. 1995;25(6):1191–1199. doi: 10.1017/s003329170003316x. [DOI] [PubMed] [Google Scholar]
- 78.Uchida N, Chong MY, Tan CH, et al. International study on antidepressant prescription pattern at 20 teaching hospitals and major psychiatric institutions in East Asia: Analysis of 1898 cases from China, Japan, Korea, Singapore and Taiwan. Psychiatry Clin Neurosci. 2007;61(5):522–528. doi: 10.1111/j.1440-1819.2007.01702.x. [DOI] [PubMed] [Google Scholar]
- 79.Van Der Meer K, Tiemens BG, Van Den Brink W. [Depression in primary health care; international data on prevalence and treatment, among others from The Netherlands.] Ned Tijdschr Geneeskd. 1996;140(43):2135–2139. [PubMed] [Google Scholar]
- 80.Lecrubier Y, Bahk WM, DeMatos J, et al. The management of depression: an international naturalistic survey. Int J Psychiatry Clin Pract. 2008;12(4):285–291. doi: 10.1080/13651500802108948. [DOI] [PubMed] [Google Scholar]
- 81.Wang PS, Aguilar-Gaxiola S, Alonso J, et al. Use of mental health services for anxiety, mood, and substance disorders in 17 countries in the WHO world mental health surveys. Lancet. 2007;370(9590):841–850. doi: 10.1016/S0140-6736(07)61414-7. [DOI] [PMC free article] [PubMed] [Google Scholar]
- 82.Thomas RV, Corney RH. Working with community mental health professionals: a survey among general practitioners. Br J Gen Pract. 1993;43(375):417–421. [PMC free article] [PubMed] [Google Scholar]
- 83.Henderson S. The National Survey of Mental Health and Well-Being in Australia: impact on policy. Can J Psychiatry. 2002;47(9):819–824. doi: 10.1177/070674370204700902. [DOI] [PubMed] [Google Scholar]
- 84.Craven MA, Bland R. Shared mental health care: a bibliography and overview. Can J Psychiatry. 2002;47(2 Suppl 1):iS–viiiS. 1S–103S. [PubMed] [Google Scholar]