

Abstract
We examined how wide ranges in levels of risk factors for cerebrovascular disease are associated with thickness of the human cerebral cortex in 115 individuals ages 43–83 with no cerebrovascular or neurologic history. Cerebrovascular risk factors included blood pressure, cholesterol, body mass index, creatinine, and diabetes-related factors. Variables were submitted into a principal components analysis that confirmed four orthogonal factors (Blood Pressure, Cholesterol, Cholesterol/Metabolic and Glucose). T1-weighted MRI was used to create models of the cortex for calculation of regional cortical thickness. Increasing blood pressure factor scores were associated with numerous regions of reduced thickness. Increasing glucose scores were modestly associated with areas of regionally decreased thickness. Increasing cholesterol scores, in contrast, were associated with thicker cortex across the whole brain. All findings were primarily independent of age. These results provide evidence that normal and moderately abnormal levels of parameters used to assess cerebrovascular health may impact brain structure, even in the absence of cerebrovascular disease. Our data have important implications for the clinical management of vascular health, as well as for what is currently conceptualized as “normal aging” as they suggest that subclinical levels of risk may impact cortical gray matter before a disease process is evident.
Keywords: aging, cerebrovascular health, cerebrovascular risk, cortical thickness, brain structure
1. Introduction
Alterations to brain structure are well documented in individuals who are at risk for cerebrovascular disease (CVD) and several studies have reported morphological changes in association with clinical conditions such as hypertension, high cholesterol and diabetes (Raz and Rodrigue, 2006). For example, widespread gray-matter atrophy has been documented in conjunction with high blood pressure (BP) (den Heijer et al., 2003), high cholesterol (Kin et al., 2007), and abnormally-regulated glucose levels (Enzinger et al., 2005; Jongen et al., 2007; Tiehuis et al., 2008), as well as in individuals with multiple CVD risk factors (Chen et al., 2006; Schmidt et al., 2004). In fact, the mere possession of one or more risk factors can increase the risk of atrophy substantially (Meyer et al., 2000), and many reports have documented structural alterations in the context of high levels of “vascular risk,” a composite score that encompasses variables such as BP, cholesterol, and body mass index (BMI) (Delano-Wood et al., 2008; Seshadri et al., 2004). In studies of middle aged and older adults, the concept of CVD risk is more common especially since their prevalence increases almost threefold for each decade of life (Brookmeyer et al., 2007). Moreover, these disorders are vastly underrepresented in the current literature on the aging brain (Fitzpatrick et al., 2004). Diseases affecting the vascular system, such as hypertension and high cholesterol, are risk factors for the development of cognitive decline and dementia such as Alzheimer s disease (Kivipelto et al., 2002), and it is becoming more and more clear that even subclinical levels of some risk factors can result in alterations to brain tissue integrity (Kennedy and Raz, 2009; Leritz et al., 2010).
While the fact that composite measures of CVD risk have a global impact on brain gray matter is widely accepted, there is also an increasing amount of evidence that individual factors have a regionally-specific impact, and that tissue within the frontal lobes may be most vulnerable to effects of poor cerebrovascular health. Hypertension, for example, has been connected to changes in frontal and prefrontal gray matter (Raz et al., 2003), as well as in more posterior brain regions (Raz et al., 2007b). Raz and colleagues (2007) reported that high BP is associated with reduced prefrontal cortex volume, but also to smaller hippocampal volume (Raz et al., 2007b), and other studies have reported temporal lobe atrophy (den Heijer et al., 2005; Korf et al., 2005). Our recent work demonstrated that higher BP, including values that would clinically be considered in the “normal” range, were related with alterations to tissue in the anterior corpus callosum, as well as on a more global level (Leritz et al., 2010). Diabetes, a condition with abnormally regulated glucose levels, has also been tied to damage in anterior brain regions (Kumar et al., 2008). However, Korf et al. (2007) found that diabetes, but not hypertension, was associated with medial temporal lobe atrophy (Korf et al., 2007), and other studies have reported reduced hippocampal volumes in individuals with diabetes (Musen et al., 2006). To date, few studies have specifically examined the impact of cholesterol alone on brain structure, but when a measure of cholesterol was included in a category of “vascular risk,” this overall score was associated with frontal lobe brain changes (Enzinger et al., 2005). In fact, many studies that utilize a composite vascular risk score report global brain effects, as well as more localized findings in the frontal and prefrontal cortex (Delano-Wood et al., 2008). Given this variability across studies, it seems possible that tissue within the frontal lobes may be uniquely vulnerable. However, the effects of CVD have been reported throughout the brain, and the anterior or posterior construct does not seem to be a particularly useful designation in this regard.
Despite the large literature on how CVD impacts brain structure, several questions remain about more subtle associations between vascular and neural health. For example, it is unknown how subclinical levels of vascular parameters may affect neural tissue, and it is also unknown whether there are regional patterns of structural alteration associated with different risk factors. In the present study we examined how varying levels of several physiological factors associated with CVD risk impact brain structure in a sample of middle aged and older aged adults. Physiologic variables included measures of BP (systolic and diastolic while sitting and standing), cholesterol (low density lipoprotein (LDL), high density lipoprotein (HDL), triglycerides, and total cholesterol) and glucose (including glucose and hemoglobain A1C (HA1C) levels), as well as two other parameters of physiologic and metabolic health: creatinine, which is associated with kidney function, and BMI, an indicator of overall health. Higher BMI has been associated with reduced brain volume in older adults (Raji et al., 2009), as has poorer kidney function (Ikram et al., 2008). To reduce the number of variables included in analyses, we first conducted a factor analysis on the 12 physiological variables. This technique also allowed us to examine the independent effects of levels of risk factors that covary together, as opposed to developing composite scores of variables created with less empirical guidance. Statistical maps were then generated, demonstrating the association between individual factor scores representing domains of risk (BP, cholesterol, and glucose) and thickness across the entire cortical mantle. Cortical thickness provides a metric of gray matter integrity and has been utilized to examine a range of conditions including multiple sclerosis, schizophrenia, dementia, and nondemented aging (Dickerson et al., 2009; Goldman et al., 2009; Preul et al., 2005; Sailer et al., 2003; Salat et al., 2004). Advanced procedures for measurement of cortical thickness allow for a point-by-point measurement across the cortical mantle at a spatial scale of approximately one millimeter and spatial normalization methods that result in precise matching of homologous regions across individuals which has been validated against cytoarchitecture (Fischl et al., 2008; Fischl et al., 2009). Procedures for cortical thickness have also been histologically validated (Rosas et al., 2002) and demonstrate important clinical utility (Desikan et al., 2009). To date, there are no studies examining how CVD risk factors relate to this aspect of brain structure. We examined these associations across a wide range of risk indexed quantitatively (from healthy to moderate and severe risk), as opposed to grouping individuals dichotomously by the presence or absence of risk.
We hypothesized that each physiological parameter would be associated with different patterns of cortical thickness. More specifically, we expected to find anterior (i.e., frontal) and posterior (i.e., temporal) reductions in thickness for the BP factor, based on the preponderance of evidence of alterations to these regions in association with hypertension. We expected to find more posterior (i.e., temporal) thickness reductions in association with the Glucose factor given recent evidence that diabetes may target these brain regions. Due to the fact that there are few studies to date examining the impact of cholesterol on the brain, our predictions with these factors were less clear. However, given the relationship of cholesterol to vascular risk, we expected that they would be most closely associated with reduced cortical thickness in anterior brain regions. Finally, given the fact that our sample represents a healthy group of community-dwelling older adults with normative ranges of CVD risk, we also expected that our results would provide important information regarding how brain structure is influenced by normal variation in systemic physiology, a common component of the aging process.
2. Materials and Methods
2.1 Participants
One hundred-fifteen participants (70 F/45 M) agreeing to undergo structural MRI participated in this study. These participants were recruited from two separate but overlapping studies examining how common cerebrovascular risk factors impact brain structure and cognition. Thirty-four participants were selected (based on their agreement to undergo structural MRI) from a larger sample recruited by the Harvard Cooperative Program on Aging (HCPA) Claude Pepper Older American Independence Center. Participants in this program were recruited from the community in response to an advertisement asking for healthy community-dwelling older African Americans. Eighty-one participants were recruited through the Understanding Cardiovascular and Alzheimer s Risk in the Elderly (UCARE) program, a study investigating how cerebrovascular risk impacts brain structure and cognition. Participants in this study were recruited through the Boston University Alzheimer s Disease Center (BUADC) based on the initial criteria of being neurologically healthy and having a first-degree family relative with dementia. Inclusion criteria for both studies included age of 50–85. Participants were excluded for the following reasons: a history of head trauma of “mild” severity or greater according to the criteria of Fortuny et al. (Fortuny et al., 1980) (e.g., loss of consciousness for greater than 10 minutes), any history of more than one head injury (due to possible cumulative neuropathological effects), diagnosis of any form of dementia (i.e., Parkinson s disease, Alzheimer s disease, vascular dementia), any severe psychiatric illness, or history of brain surgery. All participants were literate with at least a 6th grade education. Ninety-two of the participants were right-handed. Mini-mental state examination (MMSE) scores ranged from 23 to 30. These scores are in a range outside of a dementia diagnosis, according to normative data for the two racial groups (Caucasian, African American) in this sample (Bohnstedt et al., 1994). It is worth further note that only two people had MMSE scores of 23, and only four had scores of 24. Thus, it is likely that this small number of individuals with lower scores did not impact overall results or interpretation of the data.
2.2 MRI Image Acquisition
Two whole-brain high-resolution T1-weighted MPRAGE scans were collected and averaged for each participant (T1= 1000 ms, TR = 2.73 sec, TE = 3.31 ms, flip angle = 7°, slice thickness = 1.3 mm, 128 slices, FOV = 256×256 mm) to create a single image volume with high contrast-to-noise. These scans have been empirically optimized for high contrast between gray and white matter, as well as gray matter and cerebrospinal fluid (CSF) for optimal structural and surface segmentation. Total imaging time was approximately 20 minutes.
2.3 Image Analysis
Cortical thickness measurements were obtained by first conducting cortical reconstruction using the FreeSurfer image analysis suite, which is documented and freely available for download online (http://surfer.nmr.mgh.harvard.edu/). The technical details of these procedures are described in prior publications (Brands et al., 2006; Dale et al., 1999; Fischl and Dale, 2000; Fischl et al., 2001; Fischl et al., 2002; Fischl et al., 2004a; Fischl et al., 1999a; Fischl et al., 2004b). Briefly, this processing first involves motion correction and averaging of the two volumetric T1 weighted images, removal of non-brain tissue using a hybrid watershed/surface deformation procedure (Segonne et al., 2004), automated Talairach transformation, intensity normalization (Sled et al., 1998), tessellation of the gray matter white matter boundary, automated topology correction (Fischl et al., 2001; Segonne et al., 2007), and surface deformation following intensity gradients to optimally place the gray/white and gray/cerebrospinal fluid borders at the location where the greatest shift in intensity defines the transition to the other tissue class (Dale et al., 1999; Dale and Sereno, 1993; Fischl and Dale, 2000). Once the cortical models are complete, a number of deformable procedures can be performed for further data processing and analysis including surface inflation (Fischl et al., 1999a), registration to a spherical atlas which utilized individual cortical folding patterns to match cortical geometry across subjects (Fischl et al., 1999b), and creation of a variety of surface based data including maps of curvature and sulcal depth. This method uses both intensity and continuity information from the entire three dimensional MR volume in segmentation and deformation procedures to produce representations of cortical thickness, calculated as the closest distance from the gray/white boundary to the gray/CSF boundary at each vertex on the tessellated surface (Fischl and Dale, 2000). The maps are created using spatial intensity gradients across tissue classes and are therefore not simply reliant on absolute signal intensity.
Thickness measurements were mapped on the “inflated” surface of each participant s reconstructed brain (Dale et al., 1999; Fischl et al., 1999a). This procedure allows visualization of data across the entire cortical surface (i.e., both the gyri and sulci) without interference from cortical folding (see Salat et al., 2004 for an example). Maps were smoothed using a circularly symmetric Gaussian kernel across the surface with a standard deviation of 20 mm and averaged across participants using a non-rigid high-dimensional spherical averaging method to align cortical folding patterns (Fischl et al., 1999a). This procedure provides accurate matching of morphologically homologous cortical locations among participants on the basis of each individual s anatomy while minimizing metric distortion, resulting in a mean measure of cortical thickness for each group at each point on the reconstructed surface. Statistical comparisons of global data and surface maps were generated by computing a general linear model of the effects of each physiological factor (BP, Cholesterol, Cholesterol/metabolic and Glucose) on thickness at each vertex in the cortical mantle. Maps were created using statistical thresholds of p=.05 and p=.01 and were smoothed to a full width half maximum (FWHM) level of 20.
Procedures for the measurement of cortical thickness have been validated against histological analysis (Rosas et al., 2002) and manual measurements (Kuperberg et al., 2003; Salat et al., 2004). In addition, FreeSurfer morphometric procedures have demonstrated good test-retest reliability across scanner manufacturers and across field strengths (Han et al., 2006) and across various sequence parameters (Jovicich et al., 2009; Wonderlick et al., 2009).
2.4 Clusterwise Correction for Multiple Comparisons
Multiple comparison correction was performed using a clusterwise procedure described previously (Hagler et al., 2006) and adapted for cortical surface analysis. This procedure, which is available as part of the FreeSurfer processing stream, is a method that utilizes a simulation to get a measure of the distribution of the maximum cluster size under the null hypothesis. Briefly, a z-map is synthesized and smoothed using a residual FWHM, and then thresholded at a given level. Areas of maximum clusters are then recorded, under these specifications, and the procedure is repeated for a given number of iterations. Only clustered vertices are retained and the assumption is that false positive vertices (i.e., vertices in which a significant relationship between the factor score and thickness is due only to chance) would not appear next to each other. Once the distributions of the maximum cluster size are obtained, correction for multiple comparisons is performed by finding clusters in the statistical maps using the same threshold as was given in the simulation procedure. For each cluster, the p value is the probability of seeing a maximum cluster of that size, or larger, during the simulation. Clusters remaining in similar areas of significance to the original cortical thickness maps would indicate that the result is not likely due to chance. For these analyses, a total of 5000 iterations of simulation were performed for each comparison, using a threshold of p=.05 and a FWHM of 20. The simulation cluster analysis was run for thickness analyses with all four physiological factor scores.
2.5 Cerebrovascular Risk Assessment
Following informed consent, fasting blood was drawn and processed for analysis of serum levels of CVD risk including cholesterol, fasting glucose and creatinine. The following cholesterol parameters were used: total cholesterol, LDL, HDL and triglycerides. Current clinical convention considers total cholesterol of less than 200 mg/dL to be “normal,” while 200–239 mg/DL is “mildly elevated,” and total cholesterol levels of 240 or greater to be “severely elevated.” In our sample, total cholesterol levels ranged from 103 to 310 mg/dL. By these standards, 38 (33%) individuals would be considered to have mildly high cholesterol, while only 20 (17%) would be considered to have cholesterol levels in the severe range. Thus, 60 (52%) would be considered to be in the normal and mild range with regard to cholesterol.
Fasting glucose levels under 100 mg are considered “normal,” levels between 100 and 125 are considered “mild” and anything over 126 mg is considered to be indicative of potential diabetes (2009a). Glucose levels ranged from 54 to 148 mg in the current sample. Twenty-seven (23%) participants would be considered to have “mild” elevated glucose levels, while eight (7%) would be considered “diabetic” according to clinical standards. Thus, 70% of all participants would be considered to have normal to mildly high glucose levels. In addition to glucose levels, we also obtained a measure of glycosylated hemoglobin (hemoglobin A1C) on each participant. Hemoglobin A1C is a form of hemoglobin that can estimate the average plasma glucose concentration over a period of 4–12 weeks. Thus, it is an indicator of how regulated glucose levels have been, and it is particularly useful in evaluating patients with diabetes. HA1C ranges from 4 to 14; levels of 7 and above are indicative of poorly controlled blood sugar, and potentially greater cerebrovascular risk (2009a). In our sample, eight individuals (7%) had HA1C levels over 7, indicating poorly controlled sugar levels in the months preceding evaluation. Thus, the majority of our sample had appropriately regulated glucose at the time of the assessment.
Systolic and diastolic BP were recorded in a seated position after five minutes of rest with the arm at rest at the level of the heart using a standard sphygmomanometer. A second measurement was obtained 5 minutes later and the average of two values was recorded. This same procedure was then repeated in standing position, yielding a total of four BP measurements: seated systolic and diastolic, as well as standing systolic and diastolic. BP was always measured by the study physician (JLR). Current convention considers a systolic BP of 120–139 as indicative of “mild” or “pre” hypertension, a systolic BP of 140–159 to be “Stage 1” hypertension, and a systolic BP of 160 or greater to be indicative of “Stage 2” (severe) hypertension (2009b). In our sample, twenty-eight (24%) of individuals would be classified as having “pre-hypertension” under these guidelines. Forty-six (40%) would be classified as “Stage 1,” and nine (8%) would be classified as “Stage 2.” Thus, 35 (30%) would be considered to have normal-mild BP readings.
Creatinine is a product of muscle creatine phosphate and is primarily filtered by the kidneys. In the present study, it was used as an additional plasma indicator of renal function, which can provide information regarding overall metabolic function. Levels range from 0.5 to 1.0 mg/dL in women and 0.7 to 1.2 mg/dL men; levels outside of this range indicate potential kidney dysfunction, a risk factor for cerebrovascular disease. In the current sample, creatinine levels ranged from 0.5 to 2.1. Twenty-two (20%) of the current sample had levels outside of normal range.
BMI is a metric that is considered to be an indication of overall metabolic function by quantifying the relationship between height and weight. For each individual in the study, the following BMI formula was used: (weight (lbs)/height (inches)2)*703. A BMI of 25 or greater is indicative of “overweight,” and a BMI of 30 or greater is indicative of “obesity (2009b).” In the current sample, BMI s ranged from 18 to 41. Forty-one (36%) would be classified as “overweight,” and 32 (28%) would be classified as obese.
2.6 Medication Usage
Fifty-six (49%) individuals in our sample were taking BP medications (such as beta blockers, ace inhibitors, or calcium channel blockers), 38 (33%) individuals reported taking lipid lowering medication, and 11 (1%) were on medication to regulate glucose levels. Because of the significant number of individuals taking such medications, we conducted secondary regions of interest (ROI) analyses to determine the impact that medication may have on the relationship between CVD risk and cortical thickness; those individuals taking medication are also represented as such in each of the presented scatterplots.
3. Results
Demographic and raw physiologic data for all participants are presented in Table 1. MMSE data were not available for nine participants due to the fact that these data were not collected.
Table 1.
Demographic and Raw Physiologic Data
| Mean | Standard Deviation | Range | |
|---|---|---|---|
| Age | 68.34 | 9.56 | 43–87 |
| Education (years) | 14.78 | 2.67 | 9–20 |
| MMSE score (n=106) | 27.86 | 1.75 | 23–30 |
| Physiological | |||
| Systolic Blood Pressure (mm HG): | 132.64 | 18.14 | 91–178 |
| Sitting | |||
| Standing | 128.21 | 20.62 | 85–192 |
| Diastolic Blood Pressure (mm HG): | 75.61 | 8.80 | 53–101 |
| Sitting | |||
| Standing | 74.21 | 9.74 | 52–105 |
| Total Cholesterol | 202.18 | 40.13 | 103.8–310.4 |
| HDL Cholesterol | 60.32 | 17.65 | 22–135 |
| LDL Cholesterol | 120.86 | 32.63 | 52–193 |
| Triglycerides | 104.96 | 52.91 | 42–397 |
| Body Mass Index | 27.20 | 4.50 | 18.2–41.6 |
| Creatinine | 1.02 | .28 | 0.5–2.1 |
| Glucose | 94.41 | 16.88 | 54–148 |
| Hemoglobin A1C | 5.82 | .65 | 4.8–8.4 |
mm HG = millimeters of mercury; HDL=High density lipoprotein; LDL=low density lipoprotein
Mean age for individuals without a MMSE score was 68.16, and average education was 14.88 years.
3.1 Global Thickness Measures
Mean global thickness was 2.04 mm (SD=.11; Range=1.73–2.35) for the left hemishpere and was 2.03 mm (SD=.19; Range=1.72–2.37) for the right hemisphere. The relationship of global to thickness to age was examined using bivariate correlations; these analyses revealed that age was not significantly associated with global thickness in either hemisphere (Left: r=−.156, p > .05; Right: r= −.154, p > .05).
3.2 Factor Analysis of Physiologic Data
Raw scores from the 12 physiological measures (systolic seated BP, systolic standing BP, diastolic seated BP, diastolic standing BP, total cholesterol, LDL, HDL, triglycerides, BMI, creatinine, glucose, and hemoglobin A1C) were submitted to a principal components factor analysis in order to reduce the number of dependent variables and to derive empirical factors representing broad physiological domains (Bryant and Yarnold, 1995). Because high levels of HDL cholesterol are considered to be healthier than lower levels, this particular measure was inverted prior to entry into the factor analysis in order to be consistent with all other variables in the analysis. Thus for all other variables prior to entry into the principal components analysis, lower levels within normal range are considered healthier with regard to risk for CVD. Varimax rotation was used and the minimum eigenvalue for extraction was set at one. Loadings from the rotated solution are presented in Table 2. This analysis revealed a set of four orthogonal and empirically coherent factors containing separate aspects of physiology and cerebrovascular risk. The four factors explained a total of 72 % of the variance. The first factor extracted was called “Blood Pressure,” and explained 26% of the variance, with high loadings from all four BP measures. The second factor was called “Cholesterol,” explaining 18% of the variance with high loadings from total cholesterol and LDL cholesterol levels. The third factor was called “Cholesterol/Metabolic,” explaining 14% of the variance, with loadings from cholesterol variables (triglycerides and HDL), as well as metabolic variables (creatinine and BMI). The fourth and final factor was called “Glucose,” explaining 13% of the variance with loadings from hemoglobin A1C and glucose. It is important to note that the factor analysis procedure utilized resulted in four statistically independent factors, and thus, examining the relationship of each to cortical thickness likely accurately estimates the specific association that each factor (BP, Cholesterol, Cholesterol/Metabolic, Glucose) individually has on brain structure.
Table 2.
Pattern Matrix from Factor Analysis of Physiological Variables
| Factor |
||||
|---|---|---|---|---|
| Blood Pressure | Cholesterol | Cholesterol/Metabolic | Glucose | |
| Systolic BP (standing) | .872 | −.037 | −.023 | .052 |
| Systolic BP (sitting) | .870 | −.064 | −.064 | .061 |
| Diastolic BP (sitting) | .864 | .000 | .092 | .065 |
| Diastolic BP (standing) | .836 | .062 | .146 | .001 |
| Total cholesterol | −017 | .977 | −.129 | .017 |
| LDL cholesterol | −.006 | .940 | −.028 | .017 |
| Triglycerides | .039 | .238 | .835 | .115 |
| HDL cholesterol* | .052 | −.360 | .792 | .062 |
| Body Mass Index** | .415 | .007 | .394 | .056 |
| Creatinine | .004 | −.257 | .377 | .097 |
| Hemoglobin | .061 | −.091 | .043 | .891 |
| A1C Glucose | .079 | .103 | .204 | .850 |
Note:
BP= Blood Pressure; HDL cholesterol levels were inverted to make clinical directionality consistent with other factors.
Factor loadings for Body Mass Index were similar for the Blood Pressure and Cholesterol/Metabolic Factor. It was considered to be part of the Cholesterol/Metabolic factor because of its conceptual relationship to other variables on this factor.
The mean BP factor score was 6.0 × 10⁻⁷ (SD: .99, range: −2.7 to 2.3), the mean Cholesterol factor score was 9.0 × 10⁻⁸ (SD: 1.0, range: −2.4 to 2.3), the mean Cholesterol/Metabolic factor score was 9.0 × 10⁻⁸ (SD: .99, range: −1.9 to 4.1), and the mean Glucose factor score was 2.0 × 10⁻⁷ (SD: 1.00, range: −1.4 to 4.3). In order to convey the meaningfulness of factor scores, the distribution of the highest loading variables for each factor were compared with the actual distribution of factor scores. Table 3 depicts these distributions and their corresponding clinical classifications.
Table 3.
Distribution of individual variables and factor scores corresponding to clinical classifications for blood pressure, cholesterol, and glucose
| Individual Variable Range | Factor Score Range | Clinical Classification and percent of sample falling into category | |
|---|---|---|---|
| Systolic BP | < 120 | < −1.0 | Normotensive (30%) |
| 120–139 | −1.0 – 0 | Mild Hypertension (24%) | |
| 140–159 | 0–1.5 | Moderate Hypertension (46%) | |
| > 160 | >1.5 | Severe Hypertension (8%) | |
| Total Cholesterol | < 200 | < 0 | Normal (52% |
| 200–239 | 0 – 0.5 | Mild Hypercholesterimia (33%) | |
| > 240 | > 0.5 | Severe (17%) | |
| Glucose | < 100 | < .8 | Normal (70%) |
| 100–125 | .8 – 1.6 | Mild (23%) | |
| > 125 | > 1.6 | Severe (diabetes) (7%) |
The relationship between age and factor scores was examined using bivariate correlations. Age was only significantly associated with the cholesterol factor (r=.23, p < .05) such that higher age was associated with higher factor score (and thus higher cholesterol). This is not unexpected, given the fact that the risk for high cholesterol increases with age. Similarly, there was a trend for an association between age and the Cholesterol/metabolic factor (r=.170, p =.07). However, age was not significantly related to the BP factor (r=.008, p > .05), or to the glucose factor (r=.002, p > .05).
3.3 Maps of the Relationship of Cortical Thickness to Physiological Factor Scores
Figure 1 presents maps of the relationship between factor score and cortical thickness for all factors (BP, Cholesterol, Cholesterol/Metabolic, and Glucose). Age was included as a covariate in the analyses with the cholesterol factors because of its significant association with this variable. However, due to the fact that age was not significantly related to global thickness, or to any of the other factors, it was not included as a covariate in analyses with the BP or Glucose factors.
Figure 1.
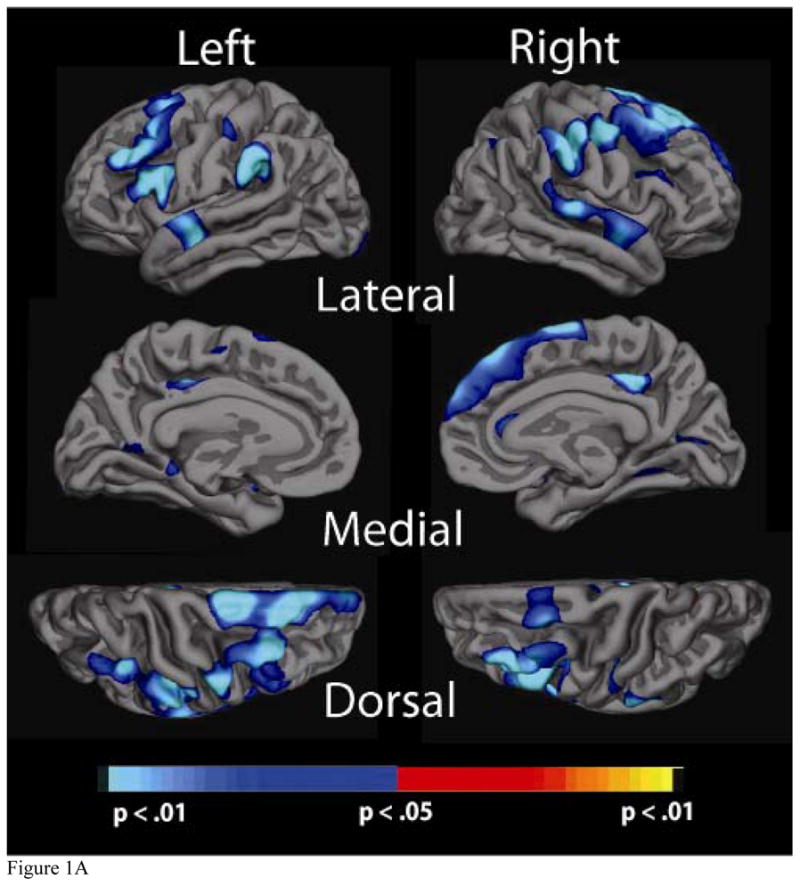

Significance maps of the relationship between cortical thickness and physiological factor scores for the a) Blood Pressure, b) Cholesterol, c) Cholesterol/Metabolic and d) Glucose factors. Maps are presented on the inflated cortical surface of an average brain with dark grey regions representing sulci and light gray regions representing gyri. The colorscale at the bottom of each map represents the significance of the thickness changes with yellow and light blue indicating the most significant regions; blue indicates a negative association between physiological factor score and thickness, yellow/red indicates a positive association.
3.3a Blood Pressure Factor
Higher BP factor score was associated with thinner cortex in several brain regions. Greatest statistical significance was found in bilateral superior temporal regions, bilateral supramarginal regions, bilateral middle and superior frontal regions, as well as in portions of the frontal cortex (middle frontal) and occipital cortex (pericalcarine). Figure 1a demonstrates the relationship between the BP factor and thickness for these three regions.
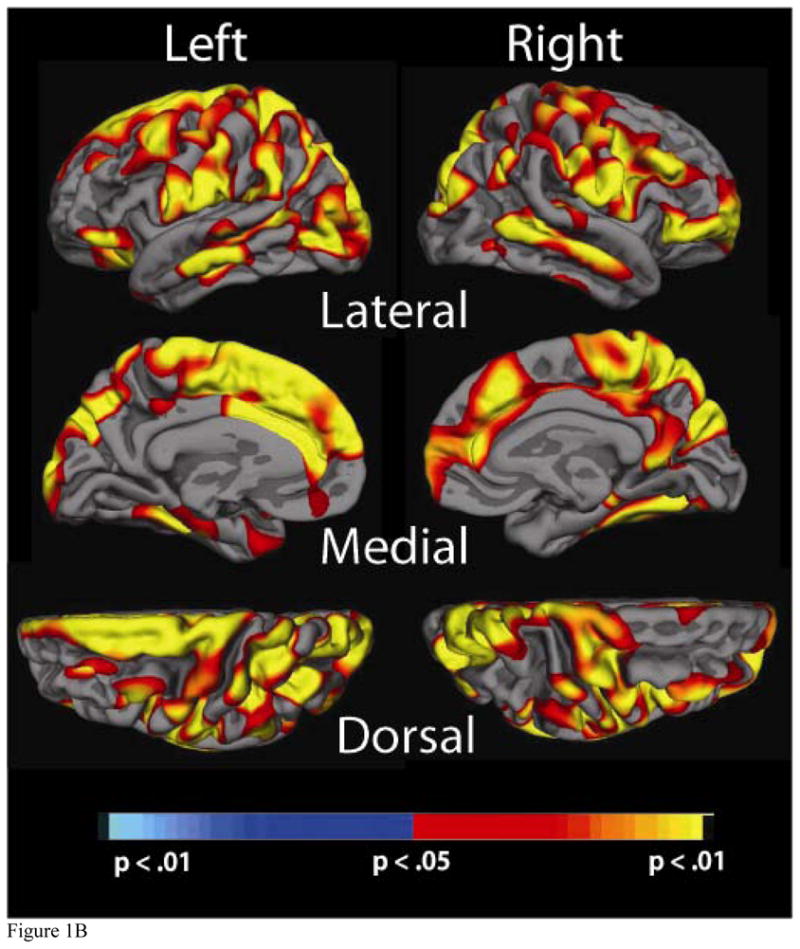
3.3b Cholesterol Factor
Higher Cholesterol factor score was associated with globally increased thickness across the majority of the cortical mantle. Although significance was widespread, the greatest areas of significance (p < .001) included bilateral middle temporal regions, bilateral superior parietal and cuneus regions, bilateral pre and post-central regions, bilateral superior, inferior and middle frontal, and bilateral precuenus. In each region, higher factor scores (and thus increased levels of “bad” cholesterol), were associated with greater cortical thickness. Of note, there were minimal differences in maps generated with and without age as a covariate, indicating that despite the correlation with the Cholesterol factor, age likely had a minimal effect on the statistical relationship between cholesterol and cortical thickness (Figure 1b).
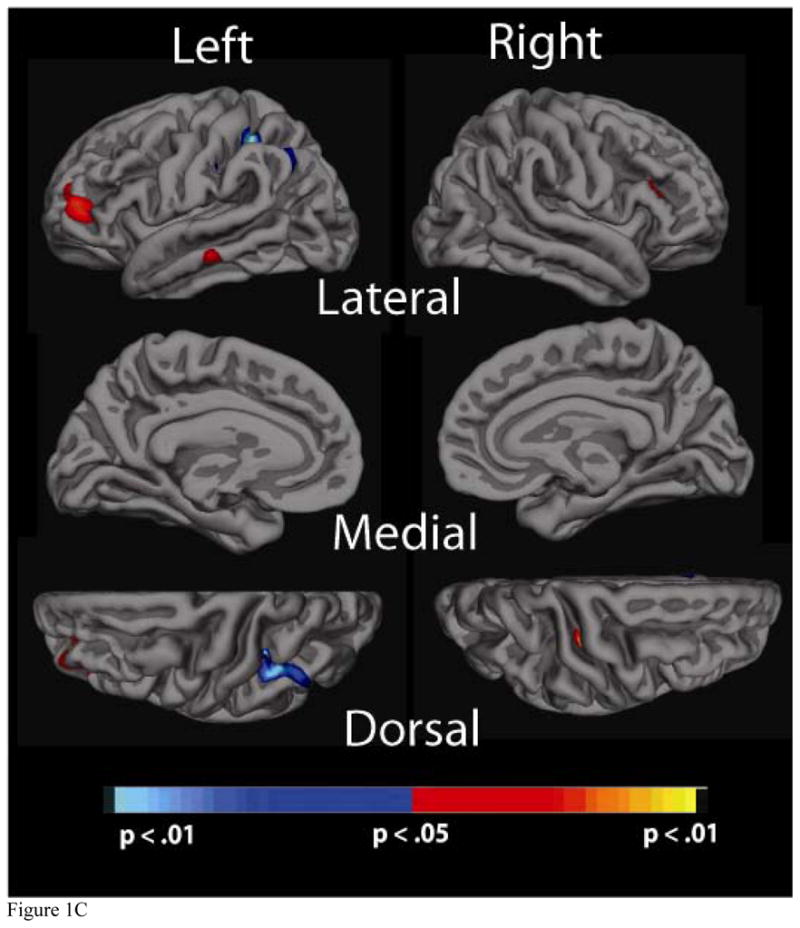
3.3c Cholesterol/metabolic factor
There was little significance associated with the Cholesterol/Metabolic factor. There were a few significant regions a positive correlation such that higher factors scores were associated with increased cortical thickness in bilateral middle frontal and right middle temporal regions. There were also small regions showing a negative relationship such that higher factor scores were associated with decreased thickness; this was true for the left parietal region. Similar to observations for the Cholesterol factor, maps also did not differ when analyses were conducted with and without age as a covariate (Figure 1c).
3.cd Glucose factor
The Glucose factor was also only modestly associated with thickness across the cortical mantle. Higher factor scores and thus higher levels of glucose and hemoglobin A1C were associated with reduced areas of thickness in the left anterior cingulate region, as well as small areas of significance in bilateral occipital regions (Figure 1d). There were several outliers in this analysis, although, results remained the same even when excluding these extreme values.
3.4 Results of Clusterwise Correction for Multiple Comparisons
The clusterwise analysis revealed large areas of significance that remained after multiple comparison correction for the BP and Cholesterol factors. These areas were consistent with what was observed during the initial analyses (Figure 1a–1b). The simulation analysis of the Cholesterol/Metabolic and Glucose factors, however, did not reveal substantial effects. This suggests that the relationship with cortical thickness is not as robust for these measures, which may in part be due to the fact that they do not account for as much of the variance in the overall factor analysis.
3.5 Regional Measures and Region of Interest Analyses
Further analyses examining the relationship between factors and cortical thickness were conducted using regions of interest (ROIs). These regions were used in follow-up analyses examining the impact that medication use (i.e., pharmacologic treatment to regulate BP, cholesterol and glucose-related disorders such as diabetes) had on the associations with brain structure, as well as to examine how individual variables comprising factor scores relate to thickness. For the BP and Cholesterol factors, bilateral ROIs were selected based on cortical thickness significance maps, displayed in Figures 1a–1d; selected ROIs are shown in Figure 2. The ROIs were derived by selecting areas of high significance; these areas were also validated in the simulation cluster analysis. ROIs were additionally constrained to be either gyral or sulcal, depending on the selected region. Four bilaterally significant BP Factor ROIs were chosen: middle temporal, supramarginal, middle frontal, and posterior cingulate. Six bilaterally significant ROIs for the Cholesterol factor were chosen: cingulate, dorsolateral frontal, inferior frontal, middle temporal, and occipital/parietal. Due to the fact that there were only small areas of significance, and to the fact that the Cholesterol/Metabolic factor contains variables that overlap with the Cholesterol factor, ROIs were not derived. However, we did create ROIs for the Glucose factor, which showed small areas of significance. The only bilateral ROI chosen was in the lateral occipital region. Additional ROIs included the anterior cingulate region in the left hemisphere and the medial frontal region in the right hemisphere. Thickness values were averaged across left and right hemispheres for bilateral ROIs to create one value per region; this was done for all three factors.
Figure 2.
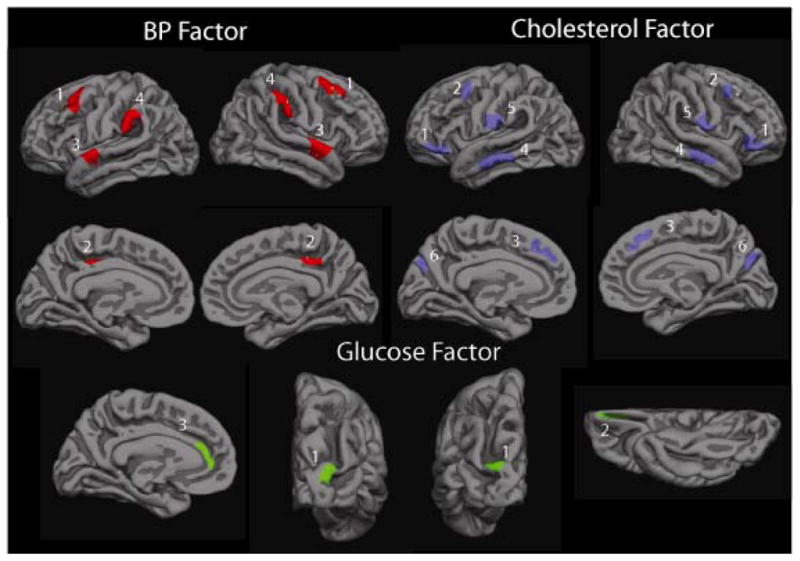
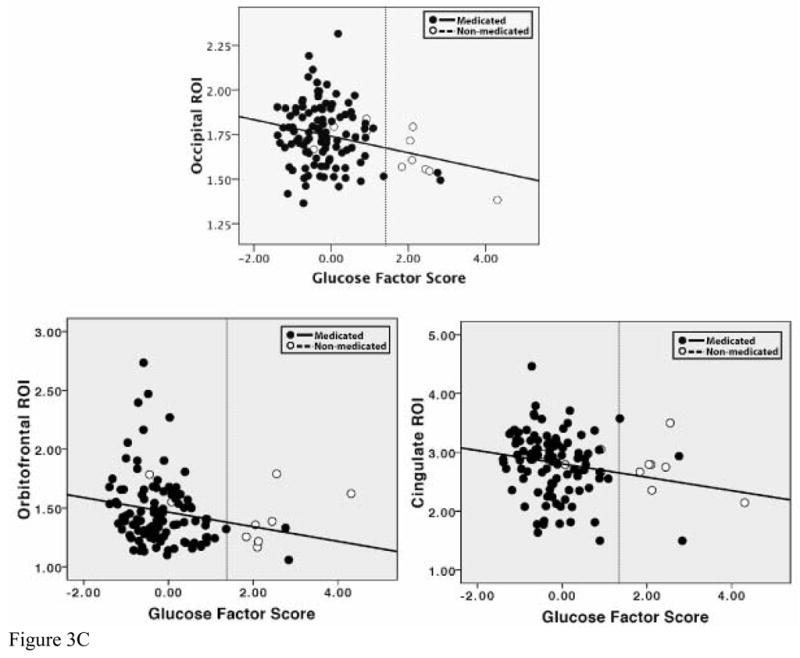
ROIs for Blood Pressure, Cholesterol, and Glucose factor scores. Blood Pressure factor. 1: Middle Frontal, 2: Cingulate, 3: Supramarginal, 4: Temporal. Cholesterol factor. 1: Inferior Frontal, 2: Lateral Frontal, 3: Cingulate, 4: Temporal, 5: Parietal, 6: Occipital. Glucose factor. 1: Occipital, 2. Orbitofrontal (right hemisphere only), 3. Cingulate (left hemisphere only).
3.5a Effect of Medication Usage
Standard least squares regression analyses were conducted in order to determine the effect that medication usage had on the relationship between factor score and cortical thickness. The four ROIs from the BP factor, and the six ROIs from the Cholesterol factor were all used as dependent variables in separate analyses. For each analysis, factor score, medication use (a yes/no dichotomous variable) and the interaction term (factor score × medication use) were entered. Table 4a and 4b presents results of these analyses. For all ROIs, for both the BP factor and the Cholesterol factor, the only variable retained in each model was the main effect of the factor score. Thus, medication use did not appear to have an impact on the relationship between factor score and cortical thickness for BP and Cholesterol in the ROIs measured. Scatterplots of these relationships, for all ROIs, are presented in Figures 3a and 3b. As can be seen, participants in the sample who reported taking medication are fairly evenly distributed, which supports the finding that the significant associations with thickness are likely not mediated by pharmacologic intervention.
Table 4a.
Results of regression analyses with ROIs for the BP factor
| Variable | Temporal | Middle Frontal | Supramarginal | Cingulate | ||||||||
|---|---|---|---|---|---|---|---|---|---|---|---|---|
| B | SE B | B | SE B | B | SE B | B | SE B | |||||
| BP Factor score | −.06* | .03 | −.09** | .03 | −.05** | .02 | −.10** | .03 | ||||
| Medication Use | −.05 | .04 | −.001 | .04 | −.02 | .02 | .001 | .04 | ||||
| BP Factor x Medication use | 0.03 | 0.04 | .04 | .04 | .02 | .02 | .04 | .04 | ||||
| R2 | .09 | .12 | .11 | .12 | ||||||||
| F | 3.61 | 5.16 | 4.91 | 5.16 | ||||||||
p < .05
p < .01
Table 4b.
Results of regression analyses with ROIs for the Cholesterol factor
| Dorsolateral Frontal | Inferior Frontal | Cingulate | Middle temporal | Parietal | Occipital | |||||||
|---|---|---|---|---|---|---|---|---|---|---|---|---|
| B | SE B | B | SE B | B | SE B | B | SE B | B | SE B | B | SE B | |
| Chol Factor Score | .08** | .03 | .07** | .02 | .08* | .03 | .09** | .02 | .07** | .02 | .06** | .02 |
| Medication Use | −.06 | .05 | .07 | .03 | .0003 | .05 | .03 | .04 | .006 | .04 | .05 | .03 |
| Chol Factor × Medication use | −.08 | .05 | .06 | .03 | −.03 | .05 | −.04 | .04 | −.02 | .03 | .007 | .03 |
| R2 | .09 | .14 | .09 | .16 | .11 | .15 | ||||||
| F | 3.51 | 6.03 | 3.54 | 6.67 | 4.40 | 6.65 | ||||||
p < .05
p < .01
Figure 3.


Scatterplots of the relationship between factors scores and cortical thickness in ROIs. In each graph, a dotted line has been placed to indicate the clinical cutoff for mild elevations of blood pressure, cholesterol, or glucose, demonstrating the fact that a large portion of our sample falls below this classification.
a. Relationship of BP factor scores to thickness in selected ROIs for medicated and non-medicated groups. In all ROIs, there was a main effect of BP factor score, but not of medication use, and there were no significant interactions between BP factor score and medication use.
b. Relationship of Cholesterol factor scores to thickness in selected ROIs for medicated and non-medicated groups. In all ROIs, there was a main effect of Cholesterol factor score, but not of medication use, and there were no significant interactions between Cholesterol factor score and medication use.
c. Relationship of Glucose factor scores to thickness in selected ROIs for medicated and non-medicated groups. Note: formal regression analyses were not conducted with these ROIs
Formal statistical analyses with medication use were not conducted for the Glucose factor due to the small number of participants on medication for diabetes. However, these individuals are represented separately in scatterplots (Figure 3c), demonstrating that they are also fairly evenly distributed across the sample.
3.5b Relationship of individual variables to ROIs
A final set of analyses employed bivariate correlations in order to examine the statistical association between the individual variables comprising factor scores for the BP, Cholesterol and Glucose factors, and cortical thickness in selected ROIs. These results are presented in Tables 5a–5c. For both the BP and Cholesterol factors, all individual variables were significantly associated with each ROI, suggesting that the respective factor scores are likely an accurate composite of the various risk components. Importantly, even values in the normal to mild ranges of each factor (less than 0 for the BP factor and less than 0.5 for the Cholesterol factor) were related to ROI thickness, suggesting that these relationships with brain structure may be evident in subclinical ranges. Thus, it can be seen that our examination of quantitative variation in risk factors may in fact provide a more accurate picture of each factor s relationship with brain structure, as opposed to classifying individuals as high (i.e., hypertension, high cholesterol, diabetes) or low risk. In all scatterplots, a dashed line is included to indicate where the cutoff would be for mild disease (i.e., mild hypertension, mild high cholesterol).
Table 5a.
Bivariate Correlations between BP factor ROIs and individual variables comprising factor score
| Superior Temporal | Middle Frontal | Supramarginal | Cingulum | |
|---|---|---|---|---|
| Systolic BP (standing) | −.20* | −.27** | −.26** | −.23* |
| Systolic BP (sitting_ | −.23* | −.25** | −.22* | −.22* |
| Diastolic BP (standing) | −.22* | −.29** | −.35** | −.35** |
| Diastolic BP (sitting) | −.25* | −.25** | −.34** | −.40** |
p < .05
p < .01
Table 5c.
Bivariate Correlations between Glucose factor ROIs and individual variables comprising factor score
| Lateral Occipital | LH Anterior Cingulate | RH Medial Frontal | |
|---|---|---|---|
| Glucose | −.09 | −.10 | −.25* |
| Hemoglobin A1C | −.26* | −.25* | −.15 |
p < .05
For the Glucose factor, hemoglobin A1C was the only variable to correlate significantly with the occipital and cingulate (left hemisphere) ROIs, while glucose was the only variable to significantly relate to the frontal ROI (right hemisphere). This may be a reflection of the fact that the overall Glucose factor was not robustly associated with thickness, but does provide some evidence that diabetes-related variables may be related in some degree to brain structure. Similar to the BP and Cholesterol factors, there appears to be a strong relationship even for those individuals falling in the normal to mild ranges of risk.
4. Discussion
The relationship of CVD and its associated risk factors to brain structure has been examined extensively using a variety of methods. In the present study, we examined the full quantitative range of physiological factors related to CVD risk. Higher levels of the BP factor were associated with thinner cortical regions, while diabetes-related variables were only modestly related to small areas of reduced thickness. Contrary to our expectations, Cholesterol factor scores were associated with increased cortical thickness across the entire brain. The individual variables comprising BP and Cholesterol factor scores were also robustly associated with regional thickness. These relationships were largely unaffected by the use of medication, or by age. While this cross-sectional study does not allow for inference of causal relationships between physiological factors and brain structure, it does provide preliminary information regarding the potential underlying mechanisms of age-related cortical changes. Moreover, the fact that these associations were observed even within normal or mild levels is a novel result and has important implications for the understanding of normal aging as well as on risk for cognitive decline and dementia. In addition, our results provided evidence of dissociable neural correlates of CVD risk factors.
4.1 Patterns of cortical thickness in relation to CVD factors
The primary finding of this study was that a wide range of levels in several CVD risk variables were correlated with the thickness of cortical gray matter in a group of individuals who are self-reported to be healthy with no significant neurological or cerebrovascular illness. Our sample was also fairly evenly distributed across the range of CVD risk; most individuals fell within the mild to moderate range of risk and very few would be considered “high risk” or would be given a clinical diagnosis (i.e., of diabetes). Thus, it is unlikely that individuals at the higher end of risk altered results or interpretation of data. Additionally, Figures 3a–3c demonstrate that a large portion of our sample falls in the normal or mild ranges of BP, cholesterol, and glucose (including hemoglobin A1C levels), suggesting that the influence of levels of CVD risk factors on brain structure may be present even in subclinical ranges. Given that conditions such as hypertension and hypercholesterolemia increase dramatically with age, these results imply that normal aging may be greatly influenced by individual variation in levels of risk. By themselves, age and brain structure may not be sufficient to capture the variance associated with morphological change. Prior work examining cortical thinning with aging demonstrated significant effects in selective regions across the cortical mantle (Salat et al., 2004). Several of these areas were also associated with biological parameters to some degree in the present study, supporting the idea that age-related brain structural changes may in part be due to the contribution of other comorbidly varying physiological variables. It will thus become increasingly important to take them into consideration in future work.
Our results also provide evidence that there may be emerging regional specificity of these risk-associated variables. BP, indexed by a factor score containing various measurements, was bilaterally related to reduced thickness in the superior temporal, middle and lateral frontal, supramarginal, and medial cingulate regions. The associations with frontal cortex are consistent with predictions as well as with prior reports of BP-related atrophy, primarily indicated through volume reductions in frontal lobe brain regions (Raz et al., 2003; Raz et al., 2007b). To our knowledge, however, this is the first study documenting reductions in cortical thickness, and taken together with volume-related findings, it provides strong support for the idea that frontal lobe brain regions are at least one consistent target of elevated BP. Lower thickness in temporal lobe brain regions is consistent with previous studies describing smaller hippocampi and medial temporal lobe atrophy (den Heijer et al., 2005; Korf et al., 2005; Raz et al., 2007a), and collectively, these results suggest that posterior regions such as the temporal lobe may also be vulnerable to higher BP. Reasons to explain the susceptibility of BP-related atrophy in frontal and temporal brain areas have primarily been vascular in nature. More specifically, it has been suggested that large portions of these regions are supplied by distal blood flow and are thus more vulnerable to poor vascular circulation, resulting in poorly oxygenated tissue that eventually begins to shrink (Havlik et al., 2002; Knopman, 2006; Raz and Rodrigue, 2006; Schmahmann et al., 2008; Skoog, 2005). Our additional findings in the anterior cingulate and supramarginal regions may also be related to poor vascular flow, and perhaps it is the cortical gray matter that is at high risk under such conditions. We also suggest that the significant finding in the anterior cingulate may be explained in part by its functional relationship with the temporal and frontal lobes. All of these regions are involved in a network of connections that are important for memory functioning (Vertes et al., 2001), and it is plausible that a breakdown at any point in connectivity may lead to alterations in associated regions. At this point, this idea is speculative, but follow-up studies examining how neuropsychological function, and specifically memory performance, relates to BP-related reductions in cortical thickness will shed light on this hypothesis.
The primary Cholesterol factor was positively associated with thickness across almost the entire cortex. This was unexpected, particularly since volume loss and atrophy have been reported in conjunction with high cholesterol and associated conditions such as atherosclerosis (Kin et al., 2007). In addition, higher than normal cholesterol levels have been implicated in the development of AD, as well as other neurodegenerative diseases (Kivipelto et al., 2002; Liu et al., 2009). However, evidence is emerging to suggest that the relationship of serum cholesterol to brain structure is not entirely clear. Solomon et al. (2009) reported that while levels of total cholesterol and LDL were negatively associated with whole brain volume in individuals with no cognitive impairment, they were positively associated with brain volume in patients with AD (Solomon et al., 2009). This finding was attributed to the fact that the process of neurodegeneration actually results in lower serum cholesterol levels, due in part to a disruption in the production of brain cholesterol (Solomon et al., 2009). In effect, the neuropathology of AD acts to reduce one of the potential contributors to the disease itself. Consistent with this idea, a recent paper found cholesterol was significantly lower in patients with multi-system atrophy, a rare neurodegenerative disease (Lee et al., 2009). It may be that this process in part explains the results of the current study; that is there may be a bidirectional mechanism between CVD risk (and specifically, cholesterol), such that higher levels in the brain predispose an individual to have higher levels in circulating blood. As such, it would make sense that higher levels of serum cholesterol, which are indirectly related to cholesterol in the brain, would be positively related to brain structure. Although thicker cortex is generally thought to be a positive attribute for neural health, it is presently unclear whether the increased thickness with increasing cholesterol is beneficial in this population. Longitudinal studies will help to clarify this issue.
The fact that significance maps were considerably reduced for the Glucose factor and almost minimal for the Cholesterol/Metabolic factor is likely in part related to the fact that they did not explain much of the variance in the overall analysis (14 and 13 %, respectively). Results did not survive multiple comparison testing, suggesting that perhaps their components are not as strongly associated with cortical thickness. It is also worth noting that unlike the BP and Cholesterol factors, the individual variables loading on the Glucose factor (which included glucose and HA1C levels) were not significantly associated with each ROI. This implies that this particular factor as a whole may not be as robustly related to thickness, and that fasting glucose level, a less stable indicator of glucose in the blood, may have a different neural correlate than HA1C, which contains information about glucose levels over a prior 6-week period. However, the Glucose factor had a few notable areas of significance in bilateral occipital regions as well as small anterior cingulate (left hemisphere) and prefrontal cortex (right hemisphere) regions. Reduced occipital lobe integrity has in fact been reported in nondemented aging (Salat et al., 2004; Walhovd et al., 2008). Wessels et al. (2006) found reduced gray matter density in the right inferior frontal gyrus and right occipital lobe in diabetic patients with retinopathy, inflammatory damage to the retina (Wessels et al., 2006). Given that we show similar findings, albeit not the same laterality, it may be that a population with more severe evidence of diabetes would demonstrate greater significance. In our sample, only 11 individuals were taking glucose-regulating medication, and the average HA1c level (5.8) was in the normal clinical range, indicating that the majority of individuals appeared to have well-regulated glucose levels. Nonetheless, even in a group with what appears to be only mild diabetes-related symptoms, there is evidence of associations between glucose and brain structure, providing further support for the idea that neural alterations and risk for further damage and cognitive decline may be present even in ranges outside of what is considered to be “high risk.”
4.2 Methodological Considerations
It is important to comment on the potential generalizability of our results, given our sample. Individuals with a first-degree family history of dementia are at a slightly higher risk of developing dementia (Huang et al., 2004), and higher levels of CVD risk factors are known to exist comorbidly in dementia and dementia risk (de la Torre, 2002; Rosano et al., 2007). In addition, CVD and associated complications are more widespread in African American communities (Singh et al., 1998). Thus, our sample is somewhat biased in that it could contain higher prevalence of associations between CVD and brain structure. We conceptualize this as a strength, as it has allowed us to examine these relationships in the context of an enriched sample. However, the degree to which our findings generalize to a population without the potential for a higher degree of risk is unknown. The fact that our sample consisted primarily of volunteers also contains a potential bias, as volunteer cohorts are highly selected and therefore may not represent the community at large. Nonetheless, despite these potential biases, we present evidence of dissociable neural correlates of physiology even in mild to moderate ranges of risk level.
A final note relates to potential limitations. First, data on the actual duration of conditions (i.e., number of years individuals have had current levels of blood pressure or glucose) was not available. Duration of risk is a potentially very important variable when assessing impact on brain structure, and our ongoing work is now collecting this critical information. Second, although we were able to accurately assess the independent contribution of each factor through use of factor analysis, this procedure does not necessarily control for interactive effects. Current ongoing studies in larger samples will be needed to assess the complex interactions between factors. Finally, there are inherent limitations associated with cross sectional studies. Although we found significant associations between levels of CVD risk factors and cortical thickness, the present findings do not necessarily allow for causal inferences regarding the directionality of the relationship between CVD risk factors and brain structure. For example, it is certainly possible that brain changes may precede elevation of certain risk factors (Jennings and Zanstra, 2009), and a bidirectional cycle develops that eventually may result in cognitive decline or dementia. This idea is consistent with what has been proposed to be the relationship between cholesterol and AD (Solomon et al., 2009), and what potentially is emerging in the current dataset. Longitudinal investigations of how CVD risk factors relate to gray matter over time will provide important clues to the specifics of how one impacts the other, and this work is ongoing in our laboratory. Several studies have provided evidence that medical conditions such as hypertension and diabetes are predictors of alteration to brain structure over time, and that such risk factors may actually accelerate degenerative changes such as atrophy and ventricular enlargement (Enzinger et al., 2005; Meyer et al., 2000). It is likely that over time the specifics of the relationships between BP, cholesterol, and glucose brain structure will be elucidated.
5. Conclusions
In summary, we present novel findings of relationships between common physiologic risk factors for CVD and cortical thickness, across a wide range of quantitative risk including minimal/mild, moderate and severe (i.e., likely clinical diagnosis). Importantly, these results are reported in a sample of individuals without any neurologic or cognitive illness, and they provide evidence that the category of normal aging may need to be broadened in future studies of how physiological variables impact brain structure. It is likely that aging is not necessarily a reflection of number of years per se, but is more probably a manifestation of the cumulative effect of physiological variations such as CVD risk (Resnick and Marcantonio, 1997). Longitudinal studies will be particularly revealing, as it may be that a subset of individuals will continue along a more normal aging pathway, while others progress to more serious dementia conditions. Nonetheless, our results stress the importance of considering multiple variables when examining the effects of CVD risk on brain structure in studies of normal aging, as well as in research examining risk for more severe disorders such as Alzheimer s disease or vascular dementia.
Table 5b.
Bivariate Correlations between Cholesterol factor ROIs and individual variables comprising factor score
| Dorsolateral Frontal | Inferior Frontal | Cingulate | Middle temporal | Parietal | Occipital | |
|---|---|---|---|---|---|---|
| Total Cholesterol | .26** | .37** | .27** | .36** | .32** | .34** |
| LDL Cholesterol | .24* | .39** | .29** | .42** | .34** | .31** |
p < .05
p < .01
Acknowledgments
This work was supported by the National Institute of Neurologic Disorders and Stroke (grant numbers K23NS062148 and K23NS06214802S1 to E.L. and R01NS052585 to BF); the National Institute of Nursing Research (grant number R01NR010827 to D.S.), the National Institute on Aging (grant numbers P60AG08812 and P01AG004390 to L.L., K01AG24898 to D.S, and AG02238 to BF); and by Medical Research Service VA Merit Review Awards to William Milberg and Regina McGlinchey. Further support was provided in part by the National Center for Research Resources (grant number P41-RR14075), and the NCRR BIRN Morphometric Project (grant numbers BIRN002 and U24 RR021382), the National Institute for Biomedical Imaging and Bioengineering (grant number R01EB006758), as well as the Mental Illness and Neuroscience Discovery (MIND) Institute, and is part of the National Alliance for Medical Image Computing (NAMIC), funded by the National Institutes of Health through the NIH Roadmap for Medical Research (grant number U54 EB005149). Additional support was provided by The Autism & Dyslexia Project funded by the Ellison Medical Foundation. The authors would like to thank for her assistance with BP collection and phlebotomy on all participants.
Footnotes
Publisher's Disclaimer: This is a PDF file of an unedited manuscript that has been accepted for publication. As a service to our customers we are providing this early version of the manuscript. The manuscript will undergo copyediting, typesetting, and review of the resulting proof before it is published in its final citable form. Please note that during the production process errors may be discovered which could affect the content, and all legal disclaimers that apply to the journal pertain.
References
- 2009 a. American Diabetes Association.
- 2009 b. American Heart Association.
- Bohnstedt M, Fox PJ, Kohatsu ND. Correlates of Mini-Mental Status Examination scores among elderly demented patients: the influence of race-ethnicity. J Clin Epidemiol. 1994;47:1381–1387. doi: 10.1016/0895-4356(94)90082-5. [DOI] [PubMed] [Google Scholar]
- Brands AM, Kessels RP, Hoogma RP, Henselmans JM, van der Beek Boter JW, Kappelle LJ, de Haan EH, Biessels GJ. Cognitive performance, psychological well-being, and brain magnetic resonance imaging in older patients with type 1 diabetes. Diabetes. 2006;55:1800–1806. doi: 10.2337/db05-1226. [DOI] [PubMed] [Google Scholar]
- Brookmeyer R, Ziegler-Graham K, Johnson E, Arrighi HM. Forecasting the global burden of Alzheimer’s disease. Johns Hopkins University Department of Biostatics working Papers. 2007;130 doi: 10.1016/j.jalz.2007.04.381. in press. [DOI] [PubMed] [Google Scholar]
- Bryant FB, Yarnold PR. Principle-components analysis and exploratory and confirmatory factor analysis. In: Grimm LG, Yarnold PR, editors. Reading and understanding multivariate statistics. American Psychological Association; Washington, D.C: 1995. pp. 99–136. [Google Scholar]
- Chen X, Wen W, Anstey KJ, Sachdev PS. Effects of cerebrovascular risk factors on gray matter volume in adults aged 60–64 years: a voxel-based morphometric study. Psychiatry Res. 2006;147:105–114. doi: 10.1016/j.pscychresns.2006.01.009. [DOI] [PubMed] [Google Scholar]
- Dale AM, Fischl B, Sereno MI. Cortical surface-based analysis. I. Segmentation and surface reconstruction. Neuroimage. 1999;9:179–194. doi: 10.1006/nimg.1998.0395. [DOI] [PubMed] [Google Scholar]
- Dale AM, Sereno MI. Improved localization of cortical activity by combining EEG and MEG with MRI cortical surface reconstruction: a linear approach. J Cogn Neurosci. 1993;5:162–176. doi: 10.1162/jocn.1993.5.2.162. [DOI] [PubMed] [Google Scholar]
- de la Torre JC. Alzheimer disease as a vascular disorder: nosological evidence. Stroke. 2002;33:1152–1162. doi: 10.1161/01.str.0000014421.15948.67. [DOI] [PubMed] [Google Scholar]
- Delano-Wood L, Bondi MW, Jak AJ, Horne NR, Schweinsburg BC, Frank LR, Wierenga CE, Delis DC, Theilmann RJ, Salmon DP. Stroke risk modifies regional white matter differences in mild cognitive impairment. Neurobiol Aging. 2008 doi: 10.1016/j.neurobiolaging.2008.09.013. [DOI] [PMC free article] [PubMed] [Google Scholar]
- den Heijer T, Launer LJ, Prins ND, van Dijk EJ, Vermeer SE, Hofman A, Koudstaal PJ, Breteler MMB. Association between blood pressure, white matter lesions, and atrophy of the medial temporal lobe. Neurology. 2005;64:263–267. doi: 10.1212/01.WNL.0000149641.55751.2E. [DOI] [PubMed] [Google Scholar]
- den Heijer T, Skoog I, Oudkerk M, de Leeuw FE, Cees de Groot J, Hofman A, Breteler MMB. Association between blood pressure levels over time and brain atrophy in the elderly. Neurobiology of Aging. 2003;24:307–313. doi: 10.1016/s0197-4580(02)00088-x. [DOI] [PubMed] [Google Scholar]
- Desikan RS, Cabral HJ, Hess CP, Dillon WP, Glastonbury CM, Weiner MW, Schmansky NJ, Greve DN, Salat DH, Buckner RL, Fischl B. Automated MRI measures identify individuals with mild cognitive impairment and Alzheimer’s disease. Brain. 2009;132:2048–2057. doi: 10.1093/brain/awp123. [DOI] [PMC free article] [PubMed] [Google Scholar]
- Dickerson BC, Bakkour A, Salat DH, Feczko E, Pacheco J, Greve DN, Grodstein F, Wright CI, Blacker D, Rosas HD, Sperling RA, Atri A, Growdon JH, Hyman BT, Morris JC, Fischl B, Buckner RL. The cortical signature of Alzheimer’s disease: regionally specific cortical thinning relates to symptom severity in very mild to mild AD dementia and is detectable in asymptomatic amyloid-positive individuals. Cereb Cortex. 2009;19:497–510. doi: 10.1093/cercor/bhn113. [DOI] [PMC free article] [PubMed] [Google Scholar]
- Enzinger C, Fazekas F, Matthews PM, Ropele S, Schmidt H, Smith S, Schmidt R. Risk factors for progression of brain atrophy in aging: six-year follow-up of normal subjects. Neurology. 2005;64:1704–1711. doi: 10.1212/01.WNL.0000161871.83614.BB. [DOI] [PubMed] [Google Scholar]
- Fischl B, Dale AM. Measuring the thickness of the human cerebral cortex from magnetic resonance images. Proc Natl Acad Sci U S A. 2000;97:11050–11055. doi: 10.1073/pnas.200033797. [DOI] [PMC free article] [PubMed] [Google Scholar]
- Fischl B, Liu A, Dale AM. Automated manifold surgery: constructing geometrically accurate and topologically correct models of the human cerebral cortex. IEEE Trans Med Imaging. 2001;20:70–80. doi: 10.1109/42.906426. [DOI] [PubMed] [Google Scholar]
- Fischl B, Rajendran N, Busa E, Augustinack J, Hinds O, Yeo BT, Mohlberg H, Amunts K, Zilles K. Cortical folding patterns and predicting cytoarchitecture. Cereb Cortex. 2008;18:1973–1980. doi: 10.1093/cercor/bhm225. [DOI] [PMC free article] [PubMed] [Google Scholar]
- Fischl B, Salat DH, Busa E, Albert M, Dieterich M, Haselgrove C, van der Kouwe A, Killiany R, Kennedy D, Klaveness S, Montillo A, Makris N, Rosen B, Dale AM. Whole brain segmentation: automated labeling of neuroanatomical structures in the human brain. Neuron. 2002;33:341–355. doi: 10.1016/s0896-6273(02)00569-x. [DOI] [PubMed] [Google Scholar]
- Fischl B, Salat DH, van der Kouwe AJ, Makris N, Segonne F, Quinn BT, Dale AM. Sequence-independent segmentation of magnetic resonance images. Neuroimage. 2004a;23(Suppl 1):S69–84. doi: 10.1016/j.neuroimage.2004.07.016. [DOI] [PubMed] [Google Scholar]
- Fischl B, Sereno MI, Dale AM. Cortical surface-based analysis. II: Inflation, flattening, and a surface-based coordinate system. Neuroimage. 1999a;9:195–207. doi: 10.1006/nimg.1998.0396. [DOI] [PubMed] [Google Scholar]
- Fischl B, Sereno MI, Tootell RB, Dale AM. High-resolution intersubject averaging and a coordinate system for the cortical surface. Hum Brain Mapp. 1999b;8:272–284. doi: 10.1002/(SICI)1097-0193(1999)8:4<272::AID-HBM10>3.0.CO;2-4. [DOI] [PMC free article] [PubMed] [Google Scholar]
- Fischl B, Stevens AA, Rajendran N, Yeo BT, Greve DN, Van Leemput K, Polimeni JR, Kakunoori S, Buckner RL, Pacheco J, Salat DH, Melcher J, Frosch MP, Hyman BT, Grant PE, Rosen BR, van der Kouwe AJ, Wiggins GC, Wald LL, Augustinack JC. Predicting the location of entorhinal cortex from MRI. Neuroimage. 2009;47:8–17. doi: 10.1016/j.neuroimage.2009.04.033. [DOI] [PMC free article] [PubMed] [Google Scholar]
- Fischl B, van der Kouwe A, Destrieux C, Halgren E, Segonne F, Salat DH, Busa E, Seidman LJ, Goldstein J, Kennedy D, Caviness V, Makris N, Rosen B, Dale AM. Automatically parcellating the human cerebral cortex. Cereb Cortex. 2004b;14:11–22. doi: 10.1093/cercor/bhg087. [DOI] [PubMed] [Google Scholar]
- Fitzpatrick AL, Kuller LH, Ives DG, Lopez OL, Jagust W, Breitner JC, Jones B, Lyketsos C, Dulberg C. Incidence and prevalence of dementia in the Cardiovascular Health Study. Journal of the American Geriatric Society. 2004;52:195–204. doi: 10.1111/j.1532-5415.2004.52058.x. [DOI] [PubMed] [Google Scholar]
- Fortuny LA, Briggs M, Newcombe F, Ratcliff G, Thomas C. Measuring the duration of post traumatic amnesia. Journal of Neurology, Neurosurgery and Psychiatry. 1980;43:377–379. doi: 10.1136/jnnp.43.5.377. [DOI] [PMC free article] [PubMed] [Google Scholar]
- Goldman AL, Pezawas L, Mattay VS, Fischl B, Verchinski BA, Chen Q, Weinberger DR, Meyer-Lindenberg A. Widespread reductions of cortical thickness in schizophrenia and spectrum disorders and evidence of heritability. Arch Gen Psychiatry. 2009;66:467–477. doi: 10.1001/archgenpsychiatry.2009.24. [DOI] [PMC free article] [PubMed] [Google Scholar]
- Hagler DJ, Jr, Saygin AP, Sereno MI. Smoothing and cluster thresholding for cortical surface-based group analysis of fMRI data. Neuroimage. 2006;33:1093–1103. doi: 10.1016/j.neuroimage.2006.07.036. [DOI] [PMC free article] [PubMed] [Google Scholar]
- Han X, Jovicich J, Salat D, van der Kouwe A, Quinn B, Czanner S, Busa E, Pacheco J, Albert M, Killiany R, Maguire P, Rosas D, Makris N, Dale A, Dickerson B, Fischl B. Reliability of MRI-derived measurements of human cerebral cortical thickness: the effects of field strength, scanner upgrade and manufacturer. Neuroimage. 2006;32:180–194. doi: 10.1016/j.neuroimage.2006.02.051. [DOI] [PubMed] [Google Scholar]
- Havlik RJ, Foley DJ, Sayer B, Masaki K, White L, Launer LJ. Variability in Midlife Systolic Blood Pressure is Related to Late-Life Brain White Matter Lesions. Stroke. 2002;33:26–30. doi: 10.1161/hs0102.101890. [DOI] [PubMed] [Google Scholar]
- Huang W, Qiu C, von Strauss E, Winblad B, Fratiglioni L. APOE genotype, family history of dementia, and Alzheimer disease risk: a 6-year follow-up study. Arch Neurol. 2004;61:1930–1934. doi: 10.1001/archneur.61.12.1930. [DOI] [PubMed] [Google Scholar]
- Ikram MA, Vernooij MW, Hofman A, Niessen WJ, van der Lugt A, Breteler MM. Kidney function is related to cerebral small vessel disease. Stroke. 2008;39:55–61. doi: 10.1161/STROKEAHA.107.493494. [DOI] [PubMed] [Google Scholar]
- Jennings JR, Zanstra Y. Is the brain the essential in hypertension? Neuroimage. 2009;47:914–921. doi: 10.1016/j.neuroimage.2009.04.072. [DOI] [PMC free article] [PubMed] [Google Scholar]
- Jongen C, van der Grond J, Kappelle LJ, Biessels GJ, Viergever MA, Pluim JP. Automated measurement of brain and white matter lesion volume in type 2 diabetes mellitus. Diabetologia. 2007;50:1509–1516. doi: 10.1007/s00125-007-0688-y. [DOI] [PMC free article] [PubMed] [Google Scholar]
- Jovicich J, Czanner S, Han X, Salat D, van der Kouwe A, Quinn B, Pacheco J, Albert M, Killiany R, Blacker D, Maguire P, Rosas D, Makris N, Gollub R, Dale A, Dickerson BC, Fischl B. MRI-derived measurements of human subcortical, ventricular and intracranial brain volumes: Reliability effects of scan sessions, acquisition sequences, data analyses, scanner upgrade, scanner vendors and field strengths. Neuroimage. 2009;46:177–192. doi: 10.1016/j.neuroimage.2009.02.010. [DOI] [PMC free article] [PubMed] [Google Scholar]
- Kennedy KM, Raz N. Pattern of normal age-related regional differences in white matter microstructure is modified by vascular risk. Brain Res. 2009;1297:41–56. doi: 10.1016/j.brainres.2009.08.058. [DOI] [PMC free article] [PubMed] [Google Scholar]
- Kin T, Yamano S, Sakurai R, Kajitani M, Okahashi Y, Nishiura N, Saito Y, Ueno S. Carotid atherosclerosis is associated with brain atrophy in Japanese elders. Gerontology. 2007;53:1–6. doi: 10.1159/000095385. [DOI] [PubMed] [Google Scholar]
- Kivipelto M, Helkala EL, Laakso MP, Hanninen T, Hallikainen M, Alhainen K, Iivonen S, Mannermaa A, Tuomilehto J, Nissinen A, Soininen H. Apolipoprotein E epsilon4 allele, elevated midlife total cholesterol level, and high midlife systolic blood pressure are independent risk factors for late-life Alzheimer disease. Ann Intern Med. 2002;137:149–155. doi: 10.7326/0003-4819-137-3-200208060-00006. [DOI] [PubMed] [Google Scholar]
- Knopman DS. Dementia and cerebrovascular disease. Mayo Clinic Proceedings. 2006;81:223–230. doi: 10.4065/81.2.223. [DOI] [PubMed] [Google Scholar]
- Korf ES, Scheltens P, Barkhof F, de Leeuw FE. Blood pressure, white matter lesions and medial temporal lobe atrophy: closing the gap between vascular pathology and Alzheimer’s disease? Dement Geriatr Cogn Disord. 2005;20:331–337. doi: 10.1159/000088464. [DOI] [PubMed] [Google Scholar]
- Korf ES, van Straaten EC, de Leeuw FE, van der Flier WM, Barkhof F, Pantoni L, Basile AM, Inzitari D, Erkinjuntti T, Wahlund LO, Rostrup E, Schmidt R, Fazekas F, Scheltens P. Diabetes mellitus, hypertension and medial temporal lobe atrophy: the LADIS study. Diabet Med. 2007;24:166–171. doi: 10.1111/j.1464-5491.2007.02049.x. [DOI] [PubMed] [Google Scholar]
- Kumar A, Haroon E, Darwin C, Pham D, Ajilore O, Rodriguez G, Mintz J. Gray matter prefrontal changes in type 2 diabetes detected using MRI. J Magn Reson Imaging. 2008;27:14–19. doi: 10.1002/jmri.21224. [DOI] [PubMed] [Google Scholar]
- Kuperberg GR, Broome MR, McGuire PK, David AS, Eddy M, Ozawa F, Goff D, West WC, Williams SC, van der Kouwe AJ, Salat DH, Dale AM, Fischl B. Regionally localized thinning of the cerebral cortex in schizophrenia. Arch Gen Psychiatry. 2003;60:878–888. doi: 10.1001/archpsyc.60.9.878. [DOI] [PubMed] [Google Scholar]
- Lee PH, Lim TS, Shin HW, Yong SW, Nam HS, Sohn YH. Serum cholesterol levels and the risk of multiple system atrophy: a case-control study. Mov Disord. 2009;24:752–758. doi: 10.1002/mds.22459. [DOI] [PubMed] [Google Scholar]
- Leritz EC, Salat DH, Milberg WP, Williams VJ, Chapman CE, Grande LJ, Rudolph JL, Barber CE, Lipsitz L, Fischl B, McGlinchey RE. Variation in Blood Pressure is Associated with White Matter Microstructure but not Cognition in African Americans. Neuropsychology. 2010;24:199–208. doi: 10.1037/a0018108. [DOI] [PMC free article] [PubMed] [Google Scholar]
- Liu JP, Tang Y, Zhou S, Toh BH, McLean C, Li H. Cholesterol involvement in the pathogenesis of neurodegenerative diseases. Mol Cell Neurosci. 2009 doi: 10.1016/j.mcn.2009.07.013. [DOI] [PubMed] [Google Scholar]
- Meyer JS, Rauch G, Rauch RA, Haque A. Risk factors for cerebral hypoperfusion, mild cognitive impairment, and dementia. Neurobiol Aging. 2000;21:161–169. doi: 10.1016/s0197-4580(00)00136-6. [DOI] [PubMed] [Google Scholar]
- Musen G, Lyoo IK, Sparks CR, Weinger K, Hwang J, Ryan CM, Jimerson DC, Hennen J, Renshaw PF, Jacobson AM. Effects of type 1 diabetes on gray matter density as measured by voxel-based morphometry. Diabetes. 2006;55:326–333. doi: 10.2337/diabetes.55.02.06.db05-0520. [DOI] [PubMed] [Google Scholar]
- Preul C, Lohmann G, Hund-Georgiadis M, Guthke T, von Cramon DY. Morphometry demonstrates loss of cortical thickness in cerebral microangiopathy. J Neurol. 2005;252:441–447. doi: 10.1007/s00415-005-0671-9. [DOI] [PubMed] [Google Scholar]
- Raji CA, Ho AJ, Parikshak NN, Becker JT, Lopez OL, Kuller LH, Hua X, Leow AD, Toga AW, Thompson PM. Brain structure and obesity. Hum Brain Mapp. 2009 doi: 10.1002/hbm.20870. [DOI] [PMC free article] [PubMed] [Google Scholar]
- Raz N, Rodrigue KM. Differential aging of the brain: patterns, cognitive correlates and modifiers. Neurosci Biobehav Rev. 2006;30:730–748. doi: 10.1016/j.neubiorev.2006.07.001. [DOI] [PMC free article] [PubMed] [Google Scholar]
- Raz N, Rodrigue KM, Acker JD. Hypertension and the brain: vulnerability of the prefrontal regions and executive functions. Behavioral Neuroscience. 2003:117. doi: 10.1037/0735-7044.117.6.1169. [DOI] [PubMed] [Google Scholar]
- Raz N, Rodrigue KM, Haacke EM. Brain aging and its modifiers: insights from in vivo neuromorphometry and susceptibility weighted imaging. Ann N Y Acad Sci. 2007a;1097:84–93. doi: 10.1196/annals.1379.018. [DOI] [PMC free article] [PubMed] [Google Scholar]
- Raz N, Rodrigue KM, Kennedy KM, Acker JD. Vascular health and longitudinal changes in brain and cognition in middle-aged and older adults. Neuropsychology. 2007b;21:149–157. doi: 10.1037/0894-4105.21.2.149. [DOI] [PubMed] [Google Scholar]
- Resnick NM, Marcantonio ER. How should clinical care of the aged differ? Lancet. 1997;350:1157–1158. doi: 10.1016/S0140-6736(05)63817-2. [DOI] [PubMed] [Google Scholar]
- Rosano C, Aizenstein HJ, Wu M, Newman AB, Becker JT, Lopez OL, Kuller LH. Focal atrophy and cerebrovascular disease increase dementia risk among cognitively normal older adults. J Neuroimaging. 2007;17:148–155. doi: 10.1111/j.1552-6569.2007.00093.x. [DOI] [PubMed] [Google Scholar]
- Rosas HD, Liu AK, Hersch S, Glessner M, Ferrante RJ, Salat DH, van der Kouwe A, Jenkins BG, Dale AM, Fischl B. Regional and progressive thinning of the cortical ribbon in Huntington’s disease. Neurology. 2002;58:695–701. doi: 10.1212/wnl.58.5.695. [DOI] [PubMed] [Google Scholar]
- Sailer M, Fischl B, Salat D, Tempelmann C, Schonfeld MA, Busa E, Bodammer N, Heinze HJ, Dale A. Focal thinning of the cerebral cortex in multiple sclerosis. Brain. 2003;126:1734–1744. doi: 10.1093/brain/awg175. [DOI] [PubMed] [Google Scholar]
- Salat DH, Buckner RL, Snyder AZ, Greve DN, Desikan RS, Busa E, Morris JC, Dale AM, Fischl B. Thinning of the cerebral cortex in aging. Cereb Cortex. 2004;14:721–730. doi: 10.1093/cercor/bhh032. [DOI] [PubMed] [Google Scholar]
- Schmahmann JD, Smith EE, Eichler FS, Filley CM. Cerebral white matter: neuroanatomy, clinical neurology, and neurobehavioral correlates. Ann N Y Acad Sci. 2008;1142:266–309. doi: 10.1196/annals.1444.017. [DOI] [PMC free article] [PubMed] [Google Scholar]
- Schmidt R, Launer LJ, Nilsson LG, Pajak A, Sans S, Berger K, Breteler MM, de Ridder M, Dufouil C, Fuhrer R, Giampaoli S, Hofman A. Magnetic resonance imaging of the brain in diabetes: the Cardiovascular Determinants of Dementia (CASCADE) Study. Diabetes. 2004;53:687–692. doi: 10.2337/diabetes.53.3.687. [DOI] [PubMed] [Google Scholar]
- Segonne F, Dale AM, Busa E, Glessner M, Salat D, Hahn HK, Fischl B. A hybrid approach to the skull stripping problem in MRI. Neuroimage. 2004;22:1060–1075. doi: 10.1016/j.neuroimage.2004.03.032. [DOI] [PubMed] [Google Scholar]
- Segonne F, Pacheco J, Fischl B. Geometrically accurate topology-correction of cortical surfaces using nonseparating loops. IEEE Trans Med Imaging. 2007;26:518–529. doi: 10.1109/TMI.2006.887364. [DOI] [PubMed] [Google Scholar]
- Seshadri S, Wolf PA, Beiser A, Elias MF, Au R, Kase CS, D’Agostino RB, DeCarli C. Stroke risk profile, brain volume, and cognitive function: the Framingham Offspring Study. Neurology. 2004;63:1591–1599. doi: 10.1212/01.wnl.0000142968.22691.70. [DOI] [PubMed] [Google Scholar]
- Singh R, Cohen SN, Krupp R, Abedi AG. Racial differences in ischemic cerebrovascular disease. J Stroke Cerebrovasc Dis. 1998;7:352–357. doi: 10.1016/s1052-3057(98)80054-2. [DOI] [PubMed] [Google Scholar]
- Skoog I. The Role of Blood Pressure in Dementia. In: Copeland JRM, Abou-Saleh MT, Blazer DG, editors. Principles and Practice of Geriatric Psychiatry. John Wiley & Sons, Ltd; 2005. pp. 256–257. [Google Scholar]
- Sled JG, Zijdenbos AP, Evans AC. A nonparametric method for automatic correction of intensity nonuniformity in MRI data. IEEE Trans Med Imaging. 1998;17:87–97. doi: 10.1109/42.668698. [DOI] [PubMed] [Google Scholar]
- Solomon A, Leoni V, Kivipelto M, Besga A, Oksengard AR, Julin P, Svensson L, Wahlund LO, Andreasen N, Winblad B, Soininen H, Bjorkhem I. Plasma levels of 24S-hydroxycholesterol reflect brain volumes in patients without objective cognitive impairment but not in those with Alzheimer’s disease. Neurosci Lett. 2009;462:89–93. doi: 10.1016/j.neulet.2009.06.073. [DOI] [PubMed] [Google Scholar]
- Tiehuis AM, van der Graaf Y, Visseren FL, Vincken KL, Biessels GJ, Appelman AP, Kappelle LJ, Mali WP. Diabetes increases atrophy and vascular lesions on brain MRI in patients with symptomatic arterial disease. Stroke. 2008;39:1600–1603. doi: 10.1161/STROKEAHA.107.506089. [DOI] [PubMed] [Google Scholar]
- Vertes RP, Albo Z, Viana Di Prisco G. Theta-rhythmically firing neurons in the anterior thalamus: implications for mnemonic functions of Papez’s circuit. Neuroscience. 2001;104:619–625. doi: 10.1016/s0306-4522(01)00131-2. [DOI] [PubMed] [Google Scholar]
- Walhovd KB, Fjell AM, Dale AM, McEvoy LK, Brewer J, Karow DS, Salmon DP, Fennema-Notestine C. Multi-modal imaging predicts memory performance in normal aging and cognitive decline. Neurobiol Aging. 2008 doi: 10.1016/j.neurobiolaging.2008.08.013. [DOI] [PMC free article] [PubMed] [Google Scholar]
- Wessels AM, Simsek S, Remijnse PL, Veltman DJ, Biessels GJ, Barkhof F, Scheltens P, Snoek FJ, Heine RJ, Rombouts SA. Voxel-based morphometry demonstrates reduced grey matter density on brain MRI in patients with diabetic retinopathy. Diabetologia. 2006;49:2474–2480. doi: 10.1007/s00125-006-0283-7. [DOI] [PubMed] [Google Scholar]
- Wonderlick JS, Ziegler DA, Hosseini-Varnamkhasti P, Locascio JJ, Bakkour A, van der Kouwe A, Triantafyllou C, Corkin S, Dickerson BC. Reliability of MRI-derived cortical and subcortical morphometric measures: effects of pulse sequence, voxel geometry, and parallel imaging. Neuroimage. 2009;44:1324–1333. doi: 10.1016/j.neuroimage.2008.10.037. [DOI] [PMC free article] [PubMed] [Google Scholar]