Abstract
Micropatterning is used widely in biosensor development, tissue engineering and basic biology. Creation of biological micropatterns typically involves multiple sequential steps that may lead to cross-contamination and may contribute to sub-optimal performance of the surface. Therefore, there is a need to develop novel strategies for characterizing location-specific chemical composition of biological micropatterns. In this paper, C60+ ToF-SIMS operating in the event-by-event bombardment-detection mode was used for spatially resolved chemical analysis of micropatterned indium tin oxide (ITO) surfaces. Fabrication of the micropatterns involved multiple steps including self-assembly of poly (ethylene glycol) (PEG)-silane, patterning of photoresist, treatment with oxygen plasma and adsorption of collagen (I). The ITO surfaces were analyzed with 26 keV C60+SIMS run in the event-by-event bombardment-detection mode at different steps of the modification process. We were able to evaluate the extent of cross-contamination between different steps and quantify coverage of the immobilized species. The methodology described here provides a novel means for characterizing the composition of biological micropatterns in a quantitative and spatially-resolved manner.
Keywords: C60-SIMS, Cluster-SIMS, Single Impact SIMS, Event-by-Event-Bombardment/Detection, Micropatterns, Biological Micropatterns, Collagen Micropatterns
INTRODUCTION
Micropatterned surfaces are utilized widely in tissue engineering, cell biology, high-throughput screening and biosensors. 1–3 Processes for fabricating micropatterned surfaces are often complex, involving multiple steps and reagents. Cross-contamination between the steps may lead to sub-optimal performance of the surface, for example, lack of specificity of a biosensor or toxicity of a cell culture substrate. Most commonly, characterization of biological micropatterns involves immunofluorescence staining and/or imaging by electron or atomic force microscopy. While informative, these approaches provide limited information about chemical species present on the micropatterned surface. On the other hand, secondary ion mass spectrometry, SIMS, may be used to analyze chemical composition of the surface without the need for fluorescence tags.4–7 Moreover, imaging SIMS provides a view of micropatterned surfaces based on contrasts in ion intensity; however, this method obtains a total mass spectrum of micropatterned surfaces relying on statistical analysis to characterize local surface composition.1, 7, 8 Our laboratory has been developing cluster ToF-SIMS operating in an event-by-event bombardment-detection mode.9, 10 In this approach, a single projectile impact results in a hemispherical “crater” of 5–10 nm in diameter and mass spectra of impacts are detected one-at-a-time.9, 11–13 This mode allows the detection of co-emitted ions from individual projectile impacts, since each single impact emission is resolved in time and space.
In the present study, we demonstrate the application to the characterization of biological micropatterns. This approach offers a novel means of quantitative, location-specific analysis of biological micropatterns.
EXPERIMENTAL SECTION
Materials
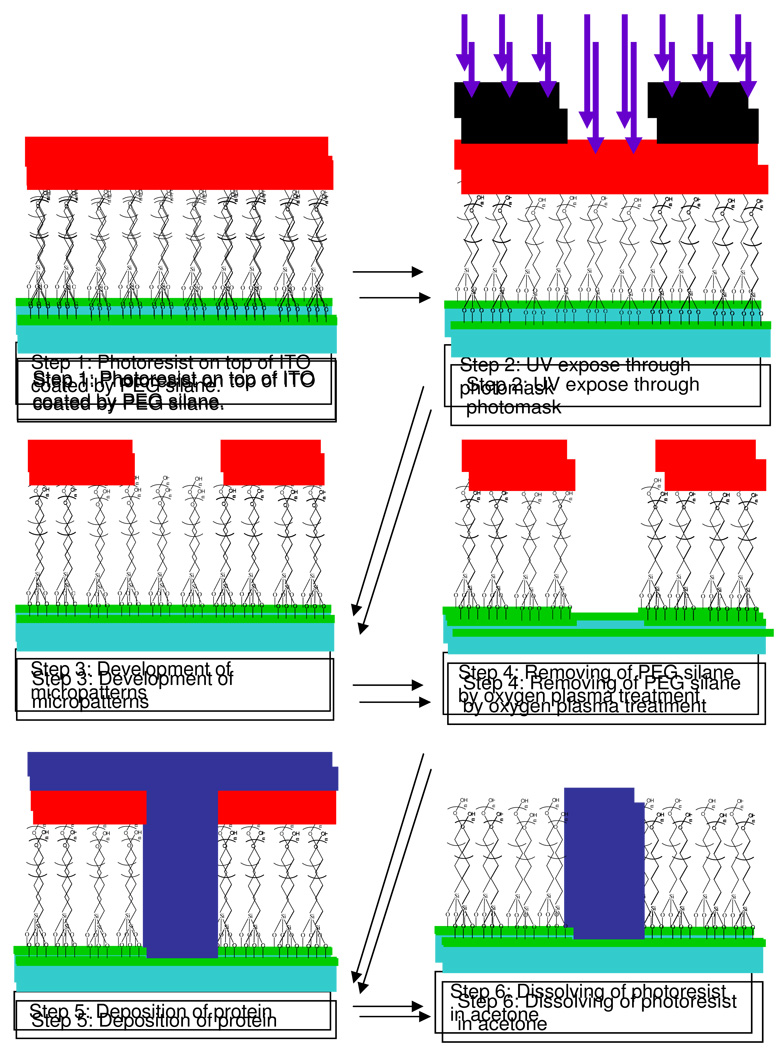
The surface micropatterning approach employed here was partly based on previously described procedures.7, 8 This method (summarized in Figure 1) involves functionalization of indium tin oxide, ITO, glass (Delta Technologies, Stillwater, MN) with poly (ethylene glycol), PEG, silane resulting in a ~5 nm thick self-assembled silane layer. A layer of photoresist, PR, (AZ 5214-E) is lithographically patterned on top of the PEG-modified surfaces and serves as a protective stencil during exposure of the micropatterned surface to O2 plasma (300W for 5 minutes). Thus PEG is removed from the ITO substrate not protected by photoresist. The removal is followed by adsorption of collagen (I) onto micropatterned surface. Incubation of the surface in acetone results in photoresist lift-off so that the ITO substrate contains collagen (I) (Sigma Aldrich, St. Louis, MO) regions surrounded by PEG silane. The micropatterned surface is with circular patches of 100 µm in diameter and the distance between two patches is 250 µm. As a proof of concept, we sought to characterize surfaces with 26 keV cluster C60+ ToF-SIMS run in the event-by-event bombardment-detection mode after steps 3 and 6 in Figure 1.
Figure 1.
The schematic illustration of the fabrication of protein attached micropatterns.
Bombardment-detection
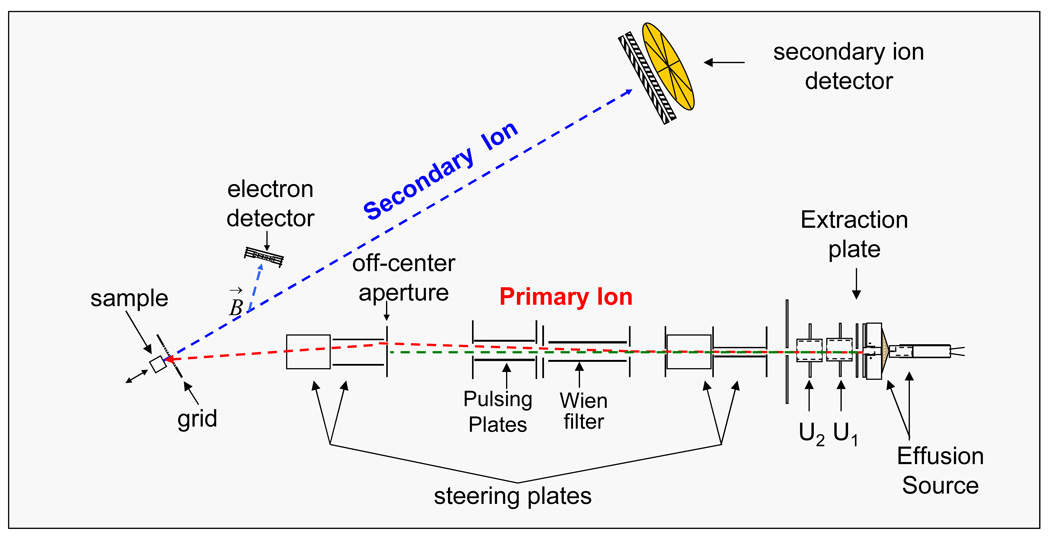
A schematic of the C60+ effusion source coupled to the time-of-flight mass analyzer used in this study is shown in Figure 2. C60 powder is placed into a Cu heating reservoir and is heated until it sublimes. The effusion vapor of C60 is ionized by electron emitted from a heated tungsten wire. The primary ions are extracted with voltage applied on extraction plate and focused with electrostatic lenses. The C60+ projectile is then mass selected with a Wien filter and steered toward an off-center aperture that deflects ions and prevents the neutrals from impacting the target. The total impact energy on the target sample is 26 keV. Electrons emitted from target are deflected by a weak magnetic field to strike the start detector (start signal). Secondary ions experience time-of-flight separation and are detected with a stop detector (stop signal). The stop detector contains a micro channel plate assembly with an 8-anode detector which allows the detection of up to 8 isobaric ions per event.14 The data are acquired in an event-by-event bombardment-detection mode. We obtained secondary ion mass spectra by accumulating approximately two million impact emission events. By selecting a specific ion of interest, the coincidence secondary ions can be extracted from an accumulation of secondary ions counts resulting in a coincidence ion mass spectrum.9
Figure 2.
Schematic of the C60 SIMS instrument.14
RESULTS AND DISCUSSION
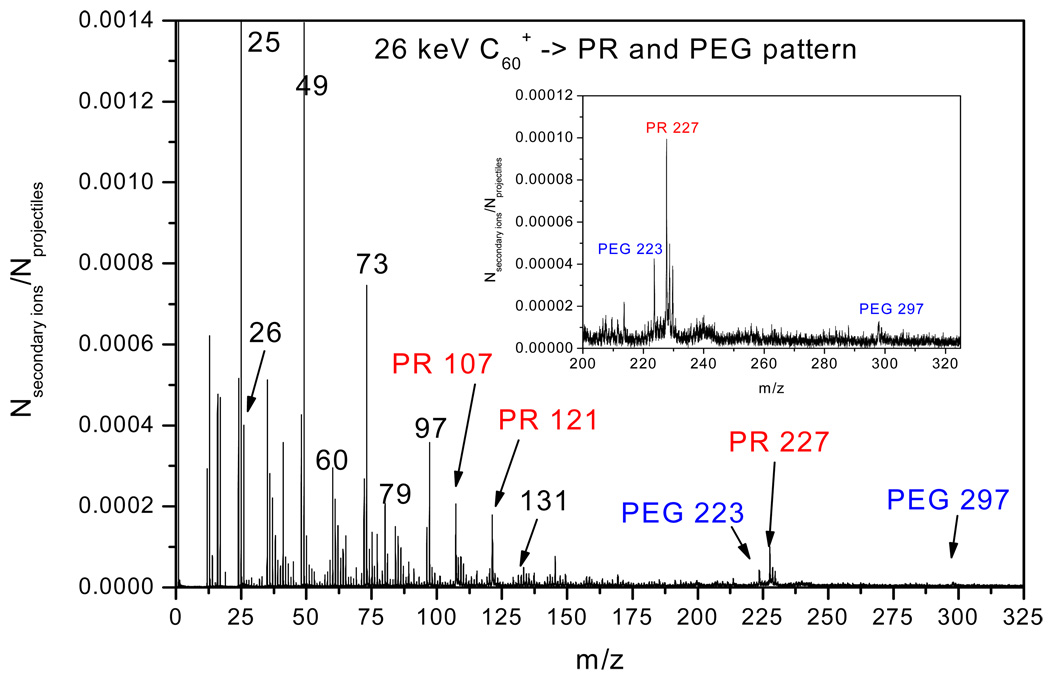
We apply here the concept of coincidental ion emission for testing the chemical homogeneity of patterned surface areas.9 The quantitative methodology is used to characterize the fabrication quality of micropatterns and the incubated amount of collagen on micropatterned surface. Consider the mass spectrum obtained from step 3 in the procedure diagrammed in Fig. 1. The spectrum presented in Fig. 3 shows multiple peaks corresponding to photoresist, PR, and PEG. The spectrum of ions in coincidence with m/z = 107 (CH2C6H4OH−) from PR (not shown) contains other peaks due to the same compound. Conversely a spectrum of ions in coincidence with m/z= 223 (PEG-C3H7SiO2−) from PEG resembles the spectrum from PEG alone (not shown). Fig. 3 summarizes the data obtained from probing ~2 million nanovolumes on the micropatterned surface. The question at hand is what percentages of the overall area probed (~250µm×250µm) are covered by PR and by PEG respectively? The methodology for a quantitative estimate of the coverage of a given species has been described previously.15 Briefly, we assume that two co-emitted ions, A and B originating from the same compound (in the present case from emitted PR or PEG) have a correlation coefficient, QA,B, of unity. QA,B is computed as follows:
| (1) |
where YA,B is the coincidental yield of simultaneously detected ions A and B. YA and YB are the secondary ion yields of detected ions A and B respectively. The coincidental yield YA,B is:
| (2) |
where Ne is the effective number of impacts on a specific specimen; IA,B is the number of co-emitted ions A and B, recorded in the coincidental mass spectrum. The secondary ion yields of ion A and B are computed as follows:
| (3) |
| (4) |
where IA and IB are the peak areas of ions A and B, respectively. Using equations (1)–(4) one can calculate Ne:
| (5) |
For a practical application, we use the coverage coefficient, K , to express the fractional coverage of specimens on the micropatterned surface:
| (6) |
where N0 is the total number of impacts . The effective number of impacts on a specific specimen, Ne (given in Eq. 5), does not depend on ionization probabilities and detection efficiencies of ions A and B. Thus, for surface objects which are larger than the size of the emission volume,15 the fractional coverage can be calculated using the coincidental method. Knowledge of the ionization probabilities of the co-emitted ions is not required.
Figure 3.
The negative ion mass spectrum collected from surfaces corresponding to step 3 in Figure 1. PEG-modified ITO substrate covered with a PR pattern of 100 µm diameter holes with center-to-center spacing.
The fractional coverage K for PR is obtained from the fragment ions at m/z 107 (CH2C6H4OH−) and 227 (C15H13(OH)2−). For the sample shown in step 3 of Fig. 1 the value of K was 83 ± 1%. A similar calculation of K as the fractional coverage of PEG yielded a value of ~ 17%. The mask applied for producing the micropattern had a circular patch of 100µm in diameter (the area which PEG can be detected) set in a square of 250µm×250µm covered by PR, except for the nominal 100µm diameter patch of PEG in the square’s center. Based on the mask dimensions, approximately 87% of the square still has been covered by PR. The difference between the nominal coverage and the experimentally determined value may be due to imperfect transfer between the photomask and the PR layer.
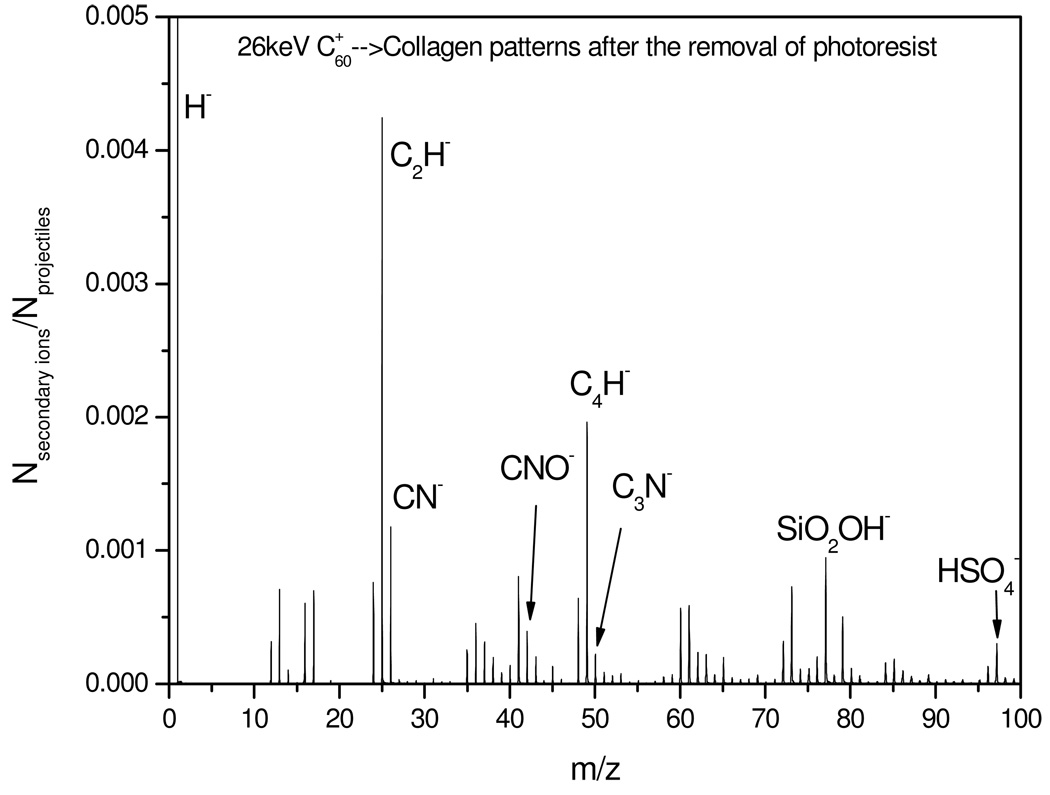
The validity of culturing cells on ITO surfaces depends on the clean removal of PR from the cell-adhesive, collagen-containing patches because PR residues may be toxic to cells. We tested the presence of collagen in the cell culturing patches via detection of CN−, CNO− and C3N−. The fractional coverage in the “collagen islands” of the total micropatterned surface was determined to be 19 ±1 %. This value was obtained using the co-emission of CN− and CNO− (Fig. 4). The fractional coverage of collagen should be the same as the fractional coverage of PEG obtained earlier. There is reasonable agreement between the values of 19% and 17% for collagen and PEG respectively which validates the collagen adsorption procedure. Another important observation is that virtually no PR ions were co-emitted with CNO− (data not shown). This test confirms the efficiency of the PR removal from the micropatterned surface.
Figure 4.
The negative ion mass spectrum of collagen-containing micropatterns after the removal of the photoresist (corresponds to step 6, Figure 1).
CONCLUSION
The coincidence mass spectrometry methodology is well-suited for testing micropatterned surfaces. It provides a qualitative test of the chemical integrity of surface patches. It can further determine the fractional coverage of surface components. The test case presented here illustrates the key role of event-by-event bombardment-detection SIMS for validating surface engineering procedures.
ACKNOWLEDGEMENTS
Financial support by NIH (grant FB006519 to AR), NIGMS-NIH (grant T32-GM08799 to SSS) and by NSF (grant 0750377 to EAS) is gratefully acknowledged.
REFERENCES
- 1.Folch A, Toner M. Annu. Rev. Biomed. Eng. 2000;2:227. doi: 10.1146/annurev.bioeng.2.1.227. [DOI] [PubMed] [Google Scholar]
- 2.West J, Becker M, Tombrink S, Manz A. Analytical Chemistry. 2008;80:4403–4419. doi: 10.1021/ac800680j. [DOI] [PubMed] [Google Scholar]
- 3.Vilkner T, Janasek D, Manz A. Analytical Chemistry. 2004;76:3373–3385. doi: 10.1021/ac040063q. [DOI] [PubMed] [Google Scholar]
- 4.Bearinger JP, Stone G, Christian AT, Dugan L, Hiddessen AL, Wu KJJ, Wu L, Hamilton J, Stockton C, Hubbell JA. Langmuir. 2008;24:5179–5184. doi: 10.1021/la703992r. [DOI] [PMC free article] [PubMed] [Google Scholar]
- 5.Cheng F, Gamble LJ, Castner DG. Analytical Chemistry. 2008;80:2564–2573. doi: 10.1021/ac702380w. [DOI] [PMC free article] [PubMed] [Google Scholar]
- 6.Zhou C, Qi K, Wooley KL, Walker AV. Colloids and Surfaces B-Biointerfaces. 2008;65:85–91. doi: 10.1016/j.colsurfb.2008.03.007. [DOI] [PubMed] [Google Scholar]
- 7.Tourovskaia A, Barber T, Wickes BT, Hirdes D, Grin B, Castner DG, Healy KE, Folch A. Langmuir. 2003;19:4754–4764. [Google Scholar]
- 8.Shah SS, Lee JY, Verkhoturov S, Tuleuova N, Schweikert EA, Ramanculov E, Revzin A. Langmuir. 2008;24:6837–6844. doi: 10.1021/la800231e. [DOI] [PMC free article] [PubMed] [Google Scholar]
- 9.Park MA, Gibson KA, Quinones L, Schweikert EA. Science. 1990;248:988–990. doi: 10.1126/science.248.4958.988. [DOI] [PubMed] [Google Scholar]
- 10.VanStipdonk MJ, Schweikert EA. Nuclear Instruments & Methods in Physics Research Section B-Beam Interactions with Materilas and Atoms. 1996;112:68–71. doi: 10.1016/j.nimb.2011.07.092. [DOI] [PMC free article] [PubMed] [Google Scholar]
- 11.Li Z, Verkhoturov SV, Schweikert EA. Analytical Chemistry. 2006;78:7410–7416. doi: 10.1021/ac0603779. [DOI] [PubMed] [Google Scholar]
- 12.Li Z, Verkhoturov SV, Locklear JE, Schweikert EA. International Journal of Mass Spectrometry. 2008;269:112–117. [Google Scholar]
- 13.Rajagopalachary S, Verkhoturov SV, Schweikert EA. Nano Letters. 2008;8:1076–1080. doi: 10.1021/nl0730716. [DOI] [PubMed] [Google Scholar]
- 14.Locklear JE. Ph.D. Dissertation. Texas A&M University,TX. Chemistry,College Station; 2006. [Google Scholar]
- 15.Rajagopalachary S, Verkhoturov SV, Schweikert EA. Analytical Chemistry. 2009;81:1089–1094. doi: 10.1021/ac802188c. [DOI] [PubMed] [Google Scholar]


