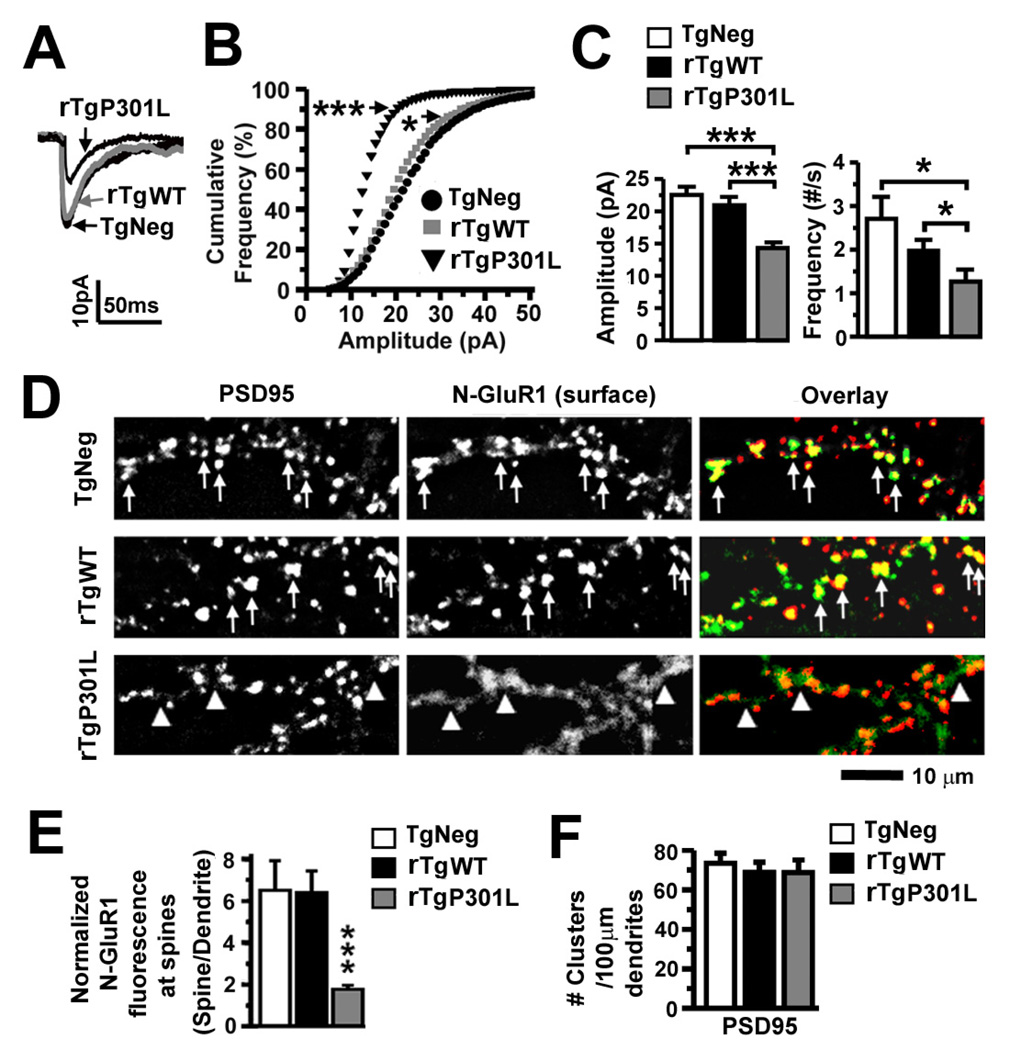
Figure 5. Excitatory synaptic transmission and surface AMPA receptors in rTgP301L and rTgWT neurons.
(A) Representative averaged mEPSCs. (B) Cumulative frequency distribution of mEPSC amplitudes. There was a marked shift toward smaller amplitudes in rTgP301L neurons, and a slight shift toward smaller amplitudes in rTgWT neurons. (Bin size = 1 pA) (C) Mean mEPSC amplitudes and firing frequencies of the neurons in (A). rTgP301L neurons exhibited smaller and fewer mEPSCs. n = 15 (TgNeg), 15 (rTgWT) and 14 (rTgP301L) neurons per group. (D) PSD95 and surface AMPAR immunoreactivity. PSD95 (red) detected using a monoclonal antibody and surface AMPARs (green) detected using a polyclonal antibody against the N-terminus of GluR1 (N-GluR1) co-localized in TgNeg and rTgWT neurons, but rarely in rTgP301L neurons. (E) Quantification of spine N-GluR1 immunoreactivity co-localizing with PSD95 immunoreactivity, normalized to N-GluR1 immunoreactivity on adjacent dendritic shafts. n = 10 neurons per group. (F) Density of dendritic spines labeled with a PSD95 antibody. There were no differences in the density of PSD95 immunoreactive clusters along the dendrites. n = 10 neurons per group. Kolmogorov-Smirnov (B), ANOVA followed by Fisher’s PLSD post-hoc analysis (C, E, F), *p < 0.05, ***p < 0.001.

