Abstract
A micronucleus test in combination with fluorescent in situ hybridization (FISH) using telomere-, centromere-specific probes and 5S and 25S rDNA was used for a detailed analysis of the effects of gamma ray irradiation on the root tip meristem cells of barley, Hordeum vulgare (2n = 14). FISH with four DNA probes was used to examine the involvement of specific chromosomes or chromosome fragments in gamma ray-induced micronuclei formation and then to explain their origin. Additionally, a comparison of the possible origin of the micronuclei induced by physical and chemical treatment: maleic hydrazide (MH) and N-nitroso-N-methylurea (MNU) was done. The micronuclei induced by gamma ray could originate from acentric fragments after chromosome breakage or from whole lagging chromosomes as a result of a dysfunction of the mitotic apparatus. No micronuclei containing only centromeric signals were found. An application of rDNA as probes allowed it to be stated that 5S rDNA–bearing chromosomes are involved in micronuclei formation more often than NOR chromosomes. This work allowed the origin of physically- and chemically-induced micronuclei in barley cells to be compared: the origin of micronuclei was most often from terminal fragments. FISH confirmed its usefulness in the characterization of micronuclei content, as well as in understanding and comparing the mechanisms of the actions of mutagens applied in plant genotoxicity.
Keywords: Barley, FISH, Gamma ray, Micronuclei
Introduction
The micronucleus (MN) test as a short and easy assay for the evaluation of the effect of mutagenic action (Schmid 1975) is a suitable substitution for the time-consuming analysis chromosome aberrations (Countryman and Heddle 1976). Interphase cytogenetics is especially useful in genotoxicity studies as most mutagens decrease mitotic activity. Recently, the MN test with fluorescent stains proved to be more sensitive in detecting small micronuclei compared to the MN test using traditional methods, such as Feulgen’s reaction (Dias et al. 2005). Therefore, the use of fluorescence has been proposed as an accurate method for the detection of micronuclei. Interphase cytogenetics using fluorescence in situ hybridization (FISH) with specific DNA probes not only provides a sensitive tool to detect small chromosome rearrangements, but also offers the possibility of better understanding the origin of the micronuclei (Maluszynska et al. 2003). The micronucleus test applied with FISH employing chromosome or chromosome region specific DNA probes is widely applied in human cytogenetics, toxicological and radiation studies. In plant cytogenetics the repetitive DNA sequences recognizing a specific chromosome region, such as centromeres and telomeres, as well as rDNA are used most extensively as probes for FISH for plant chromosomes (Bolzan and Bianchi 2006). There is only one morphological type of micronuclei which differs in size, however they can originate from different chromosomes or chromosome fragments. It was proved that the MN assay using FISH with telomeric and/or centromeric DNA sequences is able to detect the clastogenic or aneugenic effect (Acar et al. 2001; Jovtchev et al. 2002). Studies concerning the evaluation of the origin of chemically induced micronuclei by maleic hydrazide (MH) and N-nitroso-N-methylurea (MNU) in barley cells were previously done by our group (Juchimiuk et al. 2007).
The cytogenetic effects of a gamma ray in the root tips of many plant species were measured previously (Evans and Hof 1975). The specific localization of the radiation induced chromosome aberrations using traditional chromosome staining has been the subject of studies in barley and other plant species (Natarajan and Ahnstrom 1970; Kunzel et al. 2001). A gamma ray, causing breaks in one or two chains of DNA, is routinely used in plant mutagenesis (Hagberg and Persson 1968) and most barley mutant varieties were developed by applying this type of radiation.
Here, we quantitatively analyze the gamma ray-induced micronuclei in order to examine the involvement of specific chromosomes or chromosome fragments in their formation. FISH with different DNA probes (5S and 25S rDNA, telomere- and centromere-specific DNA sequences) was applied in the analysis of the micronuclei. The next aim was a comparison of the possible origin of the micronuclei induced by physical and chemical treatment (MH and MNU) in Hordeum vulgare cells. H. vulgare, a model plant, was chosen as the majority of large chromosomes can be distinguished because of the specific localization of rDNA.
Material and methods
Material and treatment
Barley (Hordeum vulgare L., 2n = 14) seeds of the cv. ′Start′ were used. Two radiation doses were used: 175 Gy and 225 Gy. The irradiation was carried out in the International Atomic Energy Agency, Seibersdorf Laboratory, Austria. After irradiation the seeds were presoaked in distilled water for 8 h and germinated in Petri dishes at 21°C in the dark. Roots of M1 seedlings were used as the source of meristems for the investigations of aberrations. The material was fixed in ethanol:glacial acetic acid (3:1) at 60 h of germination.
Fluorescence in situ hybridization (FISH)
Fluorescence in situ hybridization was applied according to the method described by Maluszynska and Heslop-Harrison (1991) with some minor modifications. Four DNA probes were used in two FISH experiments: clone HT100.3 containing 30 copies of Arabidopsis-type telomeric repeats ((TTTAGGG)n) labelled with rhodamine-5-dUTP by PCR (Roche), clone CCS1 containing a part of the centromeric retrotranspozons isolated from Brachypodium sylvaticum (Aragon-Alcaide et al. 1996; Langdon et al. 2000) labelled with digoxigenin-11-dUTP using PCR (Roche), clone pTa-794 containing 5S rDNA from Triticum aestivum (Gerlach and Dyer 1980; Hasterok et al. 2002) labelled with rhodamine-5-dUTP using a PCR labeling kit (Amersham Life Sciences), and clone pClaI containing 25S rDNA isolated from Arabidopsis thaliana (Unfriend and Gruendler 1990) labelled with digoxigenin-11-dUTP by nick translation (Roche). Prior to FISH, pretreatment with RNase, washing, dehydration of the chromosome preparations were applied as in a previous work of our group (Juchimiuk et al. 2007).
The hybridization mixture containing 2.5 μg/ml of labelled DNA, 50% formamide, 10% dextran sulphate and 0.1 mg/μl salmon testes DNA in 2 × SSC was denaturated at 75°C for 10 min and immediately placed on ice for a few minutes. The hybridization mixture (38 μl) was added to the chromosome preparations and covered with a plastic coverslip. The chromosomes and DNA probes were denatured for 5 min at 70°C on a hot plate (Hybaid Thermal Cycler PCR in situ). Hybridization was carried out at 37°C in a moist chamber for 20 h. After hybridization, slides were subsequently washed for 4 min in 2 × SSC at 42°C, 2 × 4 min in 0.1 × SSC at 42°C, 3 × 3 min in 2 × SSC at 42°C, 3 × 3 min in 2 × SSC at room temperature and for 5 min in 0.2% Tween in 4 × SSC at room temperature.
The digoxigenin-labelled probe was detected using FITC-conjugated anti-digoxigenin antibodies (Roche) and then the signal was amplified by a FITC-conjugated secondary antibody (Dako). After three washes for 8 min in 0.2% Tween in 4 × SSC at 37°C and dehydration in the ethanol series, the slides were mounted in a Vectashield medium (Vector Laboratories) containing 6 μg/ ml DAPI (Sigma).
Preparations were examined with an OLYMPUS PROVIS epifluorescent microscope using the proper filter set. Images were captured using a Hamamatsu C5810 CCD camera and processed using Adobe Photoshop 4.0. The frequency of micronuclei with specific DNA signals and without signals was calculated. For each experimental group 100 cells with micronuclei analysed on three slides, each made from three meristems, were evaluated. The total frequencies of DAPI-stained micronuclei in 3000 interphase cells were analyzed on the same slides before the FISH experiments.
Results and discussion
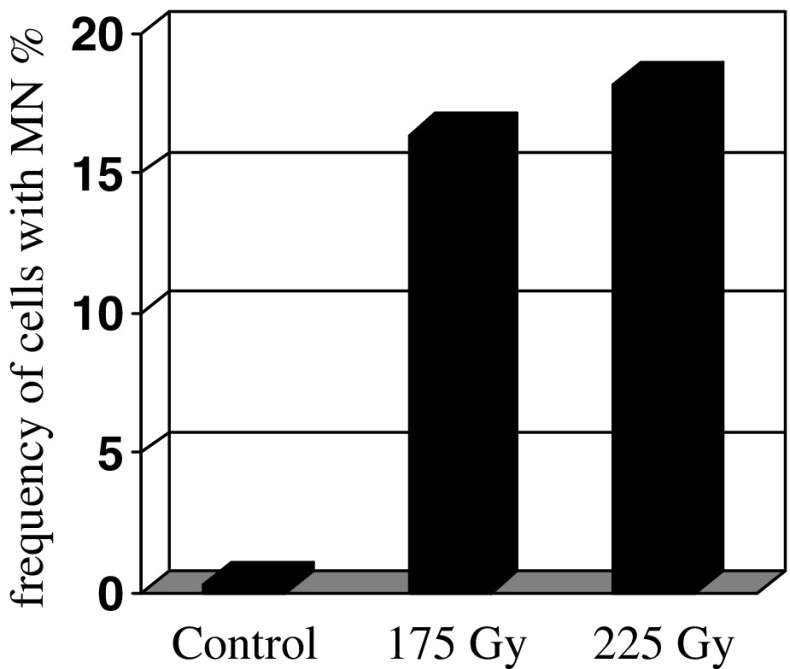
DAPI staining applied before FISH experiment allowed analysis of the total frequency of gamma ray-induced micronuclei in barley root meristematic cells (Fig. 1). The frequencies of micronuclei are shown for 60 h of postincubation as they were the highest during this time. The frequency of micronuclei after gamma irradiation varied from 4.5% to 18.2%, depending on dose and postincubation time (data not presented). 225 Gy of gamma ray was a stronger inducer of micronuclei than 175 Gy. No published data on gamma ray-induced micronuclei are known for barley (only chromosome aberrations). In the present study, the frequencies of gamma ray-induced micronuclei in barley cells showed that they were higher than the frequencies of chemically (MH- and MNU-) induced micronuclei in applied and estimated doses earlier (Juchimiuk et al. 2007).
Fig. 1.
Frequencies of gamma ray-induced micronuclei in meristematic cells of barley roots after 60 h of postincubation
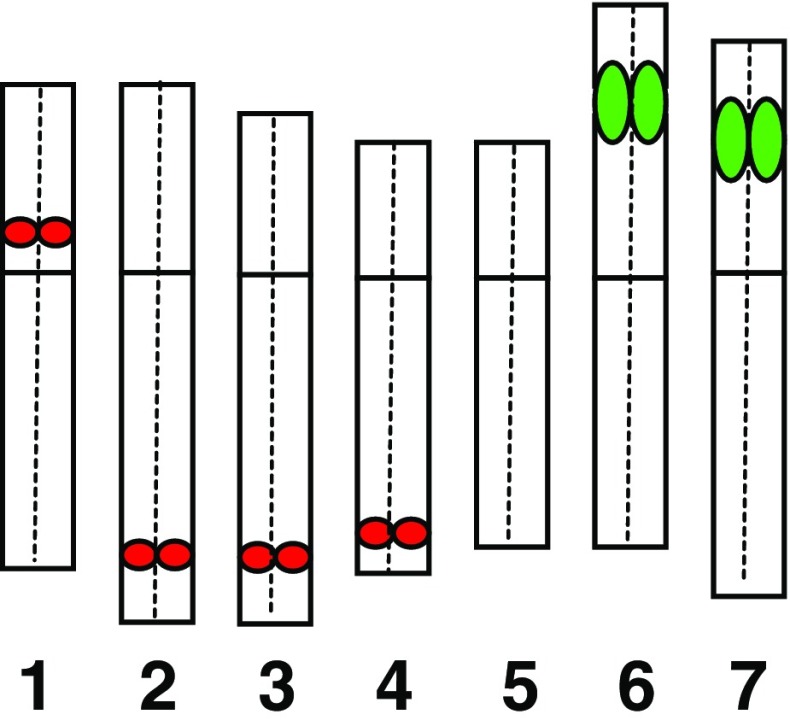
FISH was used for a detailed characterization of the micronuclei induced by gamma ray in barley cells. HT100.3 and CCS1 were used as probes in the first FISH experiments, whereas in the second one −25S and 5S rDNA were used. The analysis of the number of rDNA signals in micronuclei makes the identification of individual chromosome/chromatid engaged in their formation possible (Juchimiuk et al. 2007). This was possible due to the large number of rDNA sites in this species: only one chromosome pair is characterized by a lack of rDNA signals, two chromosome pairs with 25S rDNA signals (NOR chromosomes), four chromosomes pairs with 5S rDNA (Fig. 2). The application of FISH with centromeric and telomeric probes allowed the question of whether interstitial or distal chromosome/chromatid fragments or whole chromosomes are involved in micronuclei formation to be answered. In this study micronuclei with different FISH signals were observed. Examples of interphase control and irradiated cells with signals of different DNA sequences with the examples of probable chromosome origin of gamma ray-induced micronuclei are presented in Figs. 3 and 4. It is well known that a gamma ray can produce chromosome and chromatid aberrations; however, it is difficult to distinguish between them on the basis of the size of the signals of probes applied in interphase nuclei due to their three-dimensional structure. After the first FISH experiment with HT100.3 and CCS1 as probes, the micronuclei with telomeric signals or both telomeric and centromeric signals were observed. Surprisingly, no micronuclei containing only centromeric signals were observed. The micronucleus in Fig. 3b does not contain signals of the probes applied, and the chromosome origin of this micronuclei is unknown; however, the involvement of the interstitial chromosome region in its formation might be confirmed. The micronuclei in Fig. 3c–f, because they possess only a telomere-specific DNA, are examples of the involvement of a different number of acentric and distal chromosome fragments in their formation. The micronucleus in Fig. 3g contains two telomeric and two centromeric signals and thus indicates its origin from one incomplete chromosome and one centric fragment, or from three chromosome fragments: two centric and one acentric terminal fragment. The micronucleus in Fig. 3h has four telomeric signals and one centric signal and thus there are few possible origins of its complex origin: from one complete, laggard chromosome, chromosome without telomeres, acentric terminal fragment, or from 3 fragments including the centric one. Surprisingly, the presence of micronuclei with telomeric and centromeric sequences proved that a gamma ray can cause spindle fibre defects.
Fig. 2.
Hordeum vulgare cv. ‘Start’ idiogram with the distribution of the rRNA genes and chromosome numbering. 5S rDNA – red, 25S rDNA – green
Fig. 3.
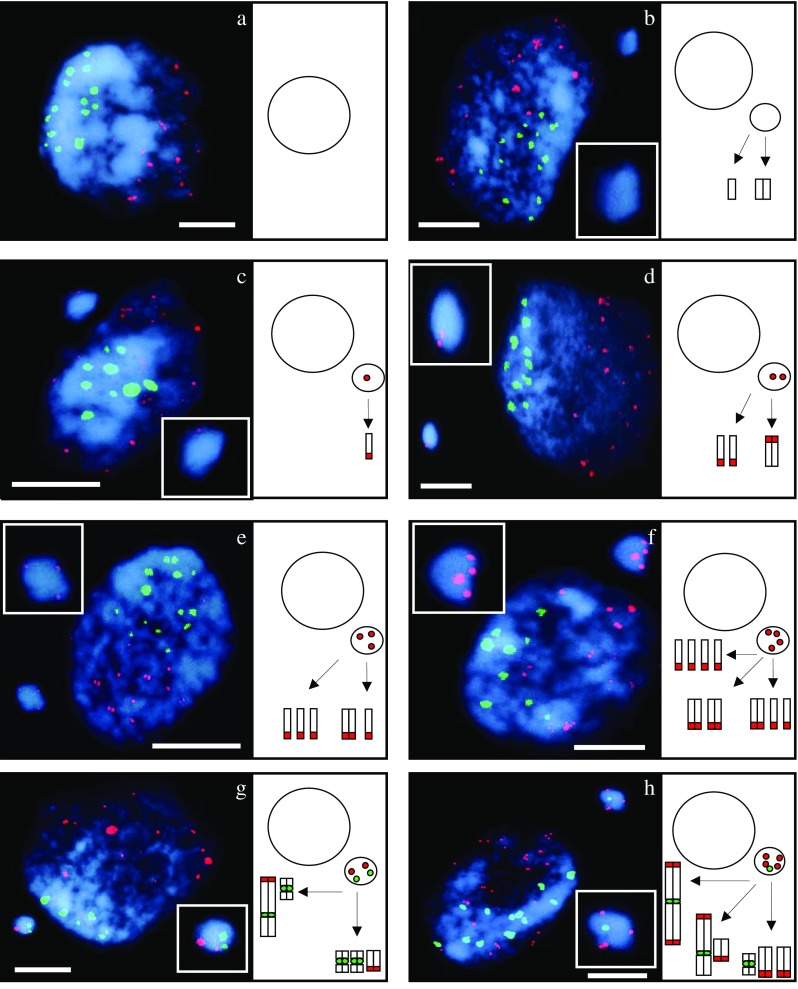
Hordeum vulgare interphase cells and probable origin of micronuclei after gamma irradiation of seeds. FISH with telomeric and centromeric DNA as probes. Telomeric sequences - red, centromeric sequences - green, DAPI staining - blue. Control cell, without micronucleus (a); the cell with: micronucleus without specific signals (b), micronucleus with one telomere specific signal (c), micronucleus with two telomere specific signals (d), micronucleus with three telomere specific signals (e), micronucleus with four telomere specific signals (f), micronucleus with two telomere and two centromere specific signals (g), micronucleus with four telomere and one centromere specific signals (h). Bars represent 10 μm
Fig. 4.
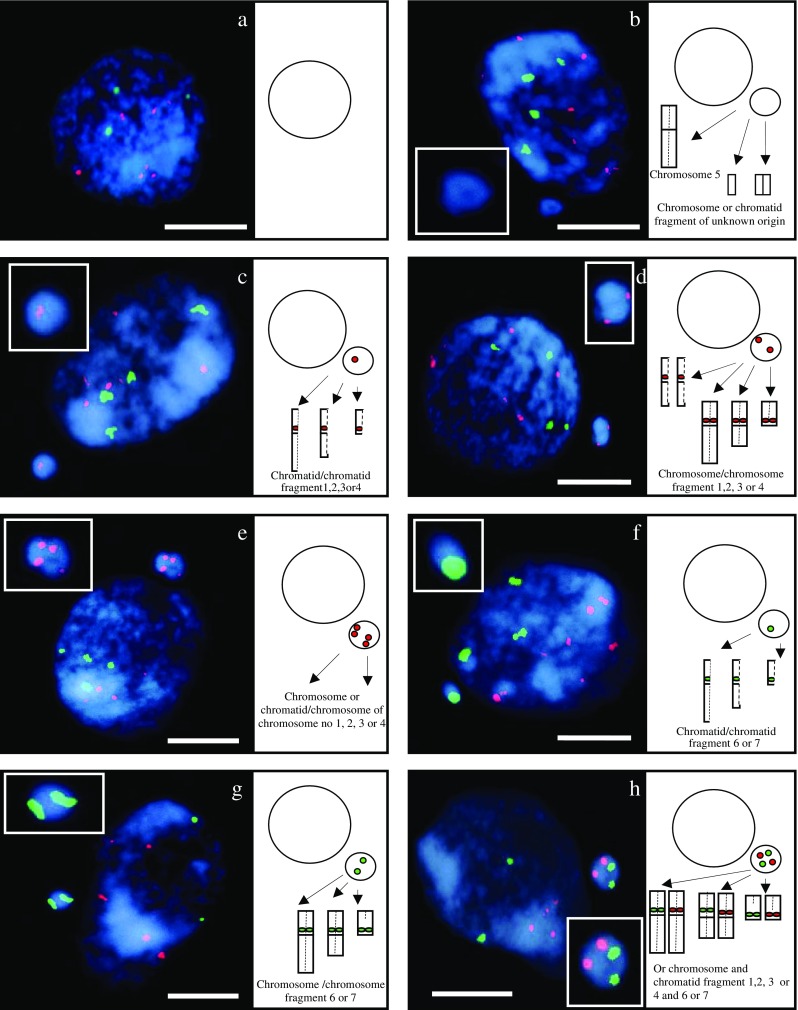
Hordeum vulgare interphase cells and probable origin of micronuclei after gamma irradiation of seeds. FISH with rDNA as probes. 5S rDNA sequences - red, 25S rDNA sequences - green, DAPI staining - blue. Control cell, without micronucleus (a); the cell with: micronucleus without specific signals (b), micronucleus with one 5S rDNA specific signal (c), micronucleus with two 5S rDNA specific signals (d), micronucleus with four 5S rDNA specific signals (e), micronucleus with one 25S rDNA specific signal (f), micronucleus with two 25S rDNA specific signals (g), micronucleus with two 5S rDNA and two 25S rDNA specific signals (h). Bars represent 10 μm
The use of rDNA makes the analysis of the involvement of specific chromosomes and/or specific chromosome fragments in the micronuclei formation possible. The origin of the micronucleus in Fig. 4b is unknown due to the lack of rDNA signals: it could originate from an interstitial fragment (without rRNA genes) of any chromosome or from whole chromosome no. 5. The micronucleus in Fig. 4c contains one signal of 5S rDNA and it probably originated from the chromatid fragment with 5S rRNA genes of chromosome no. 1, 2, 3 or 4. The micronucleus in Fig. 4d that possesses two signals of 5S rDNA is an example of an aberration formed after a double-chromatid break of one of the chromosome no. 1, 2, 3 or 4 or from single-chromatid breaks of two of these chromosomes. The presence of four signals of 5S rDNA in the micronucleus indicates that two chromosomes from among chromosomes no. 1, 2, 3 or 4 might be involved in the formation of this aberration (Fig. 4e). The presence of one 25S rDNA signal in the micronucleus in Fig. 4f clearly proved its origin from a whole chromatid or a chromatid fragment of chromosome no. 6 or 7. The total number of 25S rDNA sites in this cell is five, indicating the probability of a duplication event of chromosome fragment including 25S rDNA region. By contrast, the micronucleus in Fig. 4g probably originated from chromosomes no. 6 or 7: whole chromosomes or fragments involving the 25S rDNA locus. Chromosome/chromosome fragments no. 6 or 7 and chromosome/chromosome fragments no. 1, 2, 3, or 4 may have created the micronucleus in Fig. 4h.
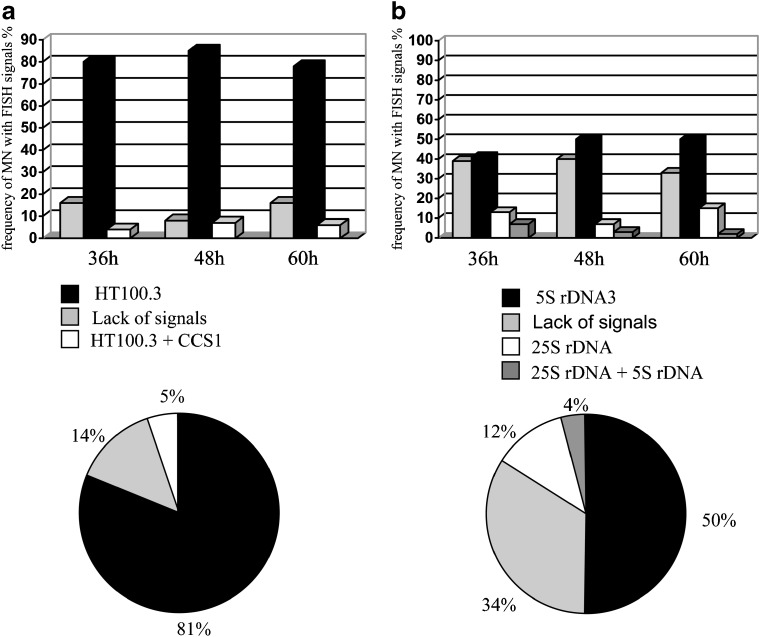
In the present study, application of FISH allows the analysis of the frequencies of micronuclei with different signals (Fig. 5). The applied doses of gamma ray did not influence the frequencies of micronuclei with particular signals (data not presented). Figure 5 shows a lack of correlation between the postincubation times used in the study and the frequency of micronuclei with specific signals, thus all of the data obtained were pooled (diagrams). FISH with telomeric and centromeric DNA as probes showed that the micronuclei with telomeric DNA were observed most frequently (81%), and rarely were micronuclei without signals (14%). Only 5% of the gamma-induced micronuclei are characterized by the presence of both: telomeric and centromeric DNA sequences. Calculating the centromere signal-positive and centromere signal-negative micronuclei is well known in plant cells; however, it is used more often in human cells (Schuler et al. 1997; Jovtchev et al. 2002). Although, individual chromosome painting of plants is difficult, the rDNA has become a useful chromosome marker for a few plant species, including Arabidopsis and barley (Weiss and Maluszynska 2000). In this work applying rDNA-FISH to barley chromosomes enabled an analysis of the engaging of rRNA-bearing chromosomes in micronuclei formation. The relatively high frequency (50%) of micronuclei including 5S rDNA signals after hybridization and micronuclei without signals (34%) was found. 12% of micronuclei are characterized by the presence of 25S rDNA sites, and only 4% with both rDNA signals. Therefore, even taking into consideration the higher number of 5S rDNA-bearing chromosomes (5 pairs) than 25S rDNA bearing chromosomes (2 pairs) in the barley diploid genome, it can be concluded that chromosomes no. 1, 2, 3 or 4 were involved in formation of gamma ray-induced chromosome aberrations more often than chromosomes no. 5, 6 or 7. Theoretically, we can state that the mean percent of micronuclei per one pair of 5S rDNA-bearing chromosomes is 12.5%, whereas per one pair of 25S rDNA-bearing chromosomes only 6%. FISH applied in a similar way in relation to the involvement of chromosomes with known markers was done in humans and has shown that different human chromosomes are not randomly involved in MN (Guttenbach and Schmidt 1994).
Fig. 5.
The frequency of micronuclei with signals of specific DNA sequences in barley cells after gamma irradiation in 36 h, 48 h, 60 h of postincubation. (a) FISH with telomeric and centromeric DNA as probes (b) FISH with rDNA as probes. The pie charts show data, which were pooled for all postincubation times
A similar study concerning a comparison of the frequency of micronuclei with specific DNA sequences was performed for MH- and NMU-treated barley cells (Juchimiuk et al. 2007). A comparison of the possible origin of the micronuclei induced by physical (done in this work) and chemical treatment (MH and MNU) in cells of Hordeum vulgare was possible. The comparison of the effect of mutagenic treatment showed that a gamma ray in applied doses induced micronuclei with almost a 2 times higher frequency than MH and MNU. However, gamma ray, MH and MNU caused terminal deletions most often and with a similar frequency in barley cells. Similarly, Jovtchev et al. (2002) reported that most MNU-induced micronuclei showed telomere-specific signals. Surprisingly, no micronuclei with only centromere-specific signal were observed in the case of treatment with gamma ray, which indicates that large interstitial fragments including only centromeric DNA are not generated by physical treatment, but formed by chemical treatment. The comparison showed that micronuclei without centromeric- and telomeric-specific FISH signals, probably arising form interstitial fragments, were observed with similar frequencies (about 15%) after gamma ray treatment and after chemical treatment. It should be underlined that not all initially radiation-induced chromatin breaks are observed as they can remain open and rejoin with another break or restitute.
Our studies confirm earlier observations that some chromosomes and chromosome regions are more prone to the formation of aberrations than others (Kumar and Natarajan 1965; Natarajan and Ahnstrom 1970). It was confirmed that small chromosome regions in the median and distal arm positions were identified as preferred sites for translocation breakpoints induced by gamma radiation in barley (Kunzel et al. 2001). Many factors could be responsible for distributions of chromosome aberrations that are not random: interphase organization, the transcriptional activity of different chromosome regions and chromosome size (Natarajan 2002).
Conclusions
FISH with rDNA and HT100.3/CCS1 sequences as probes confirmed its usefulness in the characterization of micronuclei content, as well as in understanding and comparing the mechanisms of the actions of mutagens applied in genetic toxicology. Based on the number of centromeric and telomeric signals in micronuclei the possible mechanism of gamma-ray induced micronuclei formation was stated: the micronuclei originated from the acentric fragments as a result of chromosome breakage or whole lagging chromosomes as a result of the dysfunction of the mitotic apparatus. An application of rDNA as probes allowed it to be stated that 5S rDNA-bearing chromosomes are involved in micronuclei formation more often than NOR-bearing chromosomes. The recent work allowed the origin of physically- and chemically-induced micronuclei in barley cells to be compared. Even though the mode of action of chemical and physical mutagens is different, the origin of micronuclei was most often from terminal fragments. Molecular cytogenetics techniques gives us insight into the mechanisms of the formation of chromosome aberrations during genotoxicity studies. In future studies, the combination of multiple DNA probes labelled with various fluorochromes can make FISH a more powerful tool in plant mutagenesis.
Acknowledgments
This work was supported by a Research Contract no. 12233 from the IAEA, Vienna, Austria.
Open Access
This article is distributed under the terms of the Creative Commons Attribution Noncommercial License which permits any noncommercial use, distribution, and reproduction in any medium, provided the original author(s) and source are credited.
References
- Acar H, Caliskan U, Demirel S, Largaespada DA. Micronucleus incidence and their chromosomal origin related to therapy in acute lymphoblastic leukemia (ALL) patients: detection by micronucleus and FISH technique. Teratog Carcinog Mutagen. 2001;21:341–347. doi: 10.1002/tcm.1022. [DOI] [PubMed] [Google Scholar]
- Aragon-Alcaide L, Miller T, Schwarzacher T, Reader S, Moore G. A cereal centromeric sequence. Chromosoma. 1996;105:261–268. doi: 10.1007/BF02524643. [DOI] [PubMed] [Google Scholar]
- Bolzan AD, Bianchi MS. Telomeres, interstitial repeat sequences, and chromosomal aberrations. Mutat Res. 2006;612:189–214. doi: 10.1016/j.mrrev.2005.12.003. [DOI] [PubMed] [Google Scholar]
- Countryman PI, Heddle JA. The production of micronuclei from the chromosome aberration in irradiated cultures of human lymphocytes. Mutat Res. 1976;41:321–332. doi: 10.1016/0027-5107(76)90105-6. [DOI] [PubMed] [Google Scholar]
- Dias VM, Manelli-Oliveira R, Machado-Santelli GM. Using fluorescence for improvement of the quantitative analysis of micronucleus in cell culture. Mutat Res. 2005;565:173–179. doi: 10.1016/j.mrgentox.2004.10.003. [DOI] [PubMed] [Google Scholar]
- Evans LS, Hof JV. Dose rate, mitotic cycle duration and sensitivity of cell transitions form G1-S and G2-M to protracted gamma radiation in root meristems. Radiat Res. 1975;64:331–343. doi: 10.2307/3574269. [DOI] [PubMed] [Google Scholar]
- Gerlach WL, Dyer TA. Sequence organization of the repeating units in the nucleus in wheat which contain 5S rRNA genes. Nucleic Acids Res. 1980;11:4851–4865. doi: 10.1093/nar/8.21.4851. [DOI] [PMC free article] [PubMed] [Google Scholar]
- Guttenbach M, Schmidt M. Exclusion of specific chromosomes into micronuclei by 5-azacytidine treatment of lymphocytes cultures. Exp Cell Res. 1994;211:127–132. doi: 10.1006/excr.1994.1068. [DOI] [PubMed] [Google Scholar]
- Hagberg A, Persson G. Induced mutations in barley breeding. Hereditas. 1968;59:396–412. doi: 10.1111/j.1601-5223.1968.tb02185.x. [DOI] [Google Scholar]
- Hasterok R, Langdon T, Taylor S, Jenkins G. Combinatorial labeling of DNA probes enables multicolor fluorescence in situ hybridization in plants. Folia Histochem Cytobiol. 2002;40:319–323. [PubMed] [Google Scholar]
- Jovtchev G, Stergios M, Schubert I. A comparison of N-methyl-N-nitrosourea-induced chromatid aberrations and micronuclei in barley meristems using FISH techniques. Mutat Res. 2002;517:47–51. doi: 10.1016/s1383-5718(02)00038-4. [DOI] [PubMed] [Google Scholar]
- Juchimiuk J, Hering B, Maluszynska J. Multicolour FISH in an analysis of chromosome aberrations induced by N-nitroso-N-methylurea and maleic hydrazide in barley cells. J Appl Genet. 2007;48:99–106. doi: 10.1007/BF03194666. [DOI] [PubMed] [Google Scholar]
- Kumar S, Natarajan AT. On the distribution of two break exchanges on the satellite chromosomes of barley. Mutat Res. 1965;2:471–475. doi: 10.1016/0027-5107(65)90060-6. [DOI] [PubMed] [Google Scholar]
- Kunzel G, Gecheff KI, Schubert I. Different chromosome distribution patterns of radiation-induced interchange breakpoints in barley: first post-treatment mitosis versus viable offspring. Genome. 2001;44:128–132. doi: 10.1139/gen-44-1-128. [DOI] [PubMed] [Google Scholar]
- Langdon T, Seago C, Mende M, Leggett M, Thomas H, Forster JW, Thomas H, Jones RN, Jenkins G. Retrotransposon evolution in diverse plant genomes. Genetics. 2000;156:313–325. doi: 10.1093/genetics/156.1.313. [DOI] [PMC free article] [PubMed] [Google Scholar]
- Maluszynska J, Heslop-Harrison JS. Localization of tandemly repeated DNA sequences in Arabidopsis thaliana. Plant J. 1991;1(2):159–166. doi: 10.1111/j.1365-313X.1991.00159.x. [DOI] [Google Scholar]
- Maluszynska J, Juchimiuk J, Wolny E. Chromosomal aberrations in Crepis capillaris cells detected by FISH. Folia Histochem Cytobiol. 2003;41:101–104. [PubMed] [Google Scholar]
- Natarajan AT. Chromosome aberrations: past, present and future. Mutat Res. 2002;504:3–16. doi: 10.1016/s0027-5107(02)00075-1. [DOI] [PubMed] [Google Scholar]
- Natarajan AT, Ahnstrom G. The localization of radiation induced chromosome aberrations in relation to distribution of heterochromatin in Secale cereale. Chromosoma. 1970;30:25–257. doi: 10.1007/BF00282004. [DOI] [PubMed] [Google Scholar]
- Schmid W. The Micronucleus test. Mutat Res. 1975;31:9–15. doi: 10.1016/0165-1161(75)90058-8. [DOI] [PubMed] [Google Scholar]
- Schuler M, Rupa DS, Eastmond DA. A critical evaluation of centromeric labelling to distinguish micronuclei induced by chromosomal loss and breakage in vitro. Mutat Res. 1997;392:81–95. doi: 10.1016/s0165-1218(97)00047-5. [DOI] [PubMed] [Google Scholar]
- Unfriend I, Gruendler P. Nucleotide sequence of the 5.8S and 25S rRNA genes and of the internal transcribed spacers from Arabidopsis thaliana. Nucleic Acid Res. 1990;18:4011. doi: 10.1093/nar/18.13.4011. [DOI] [PMC free article] [PubMed] [Google Scholar]
- Weiss H, Maluszynska J. Chromosomal rearrangement in autotetraploid plants of Arabidopsis thaliana. Hereditas. 2000;133:255–261. doi: 10.1111/j.1601-5223.2000.00255.x. [DOI] [PubMed] [Google Scholar]


