Abstract
Collagen V, broadly expressed as α1(V)2α2(V) heterotrimers that regulate collagen fibril geometry and strength, also occurs in some tissues, such as white adipose tissue (WAT), pancreatic islets, and skeletal muscle, as the poorly characterized α1(V) α2(V) α3(V) heterotrimer. Here, we investigate the role of α3(V) collagen chains by generating mice with a null allele of the α3(V) gene Col5a3 (Col5a3–/– mice). Female Col5a3–/– mice had reduced dermal fat and were resistant to high-fat diet–induced weight gain. Male and female mutant mice were glucose intolerant, insulin-resistant, and hyperglycemic, and these metabolic defects worsened with age. Col5a3–/– mice demonstrated decreased numbers of pancreatic islets, which were more susceptible to streptozotocin-induced apoptosis, and islets isolated from mutant mice displayed blunted glucose-stimulated insulin secretion. Moreover, Col5a3–/– WAT and skeletal muscle were defective in glucose uptake and mobilization of intracellular GLUT4 glucose transporter to the plasma membrane in response to insulin. Our results underscore the emerging view of the importance of ECM to the microenvironments that inform proper development/functioning of specialized cells, such as adipocytes, β cells, and skeletal muscle.
Introduction
Collagen V [col(V)] is a low-abundance fibrillar collagen, widely distributed throughout vertebrate tissues as α1(V)2α2(V) heterotrimers (1) that are incorporated into fibrils of the much more abundant fibrillar collagen I [col(I)] and which regulate the size and shape of the resulting col(I/V) heterotypic fibrils (2). Consequently, mutations in the human α1(V) or α2(V) chain gene are causal in the heritable connective tissue disorder classic Ehlers-Danlos syndrome (3, 4), characterized by collagen fibrils with abnormal geometries and reduced tensile strength. However, col(V) also occurs as a relatively uncharacterized α1(V)α2(V)α3(V) heterotrimer, with a much more limited tissue distribution than that of α1(V)2α2(V) heterotrimers. α1(V)α2(V)α3(V) Heterotrimers have been reported in placenta, uterus, skin, and synovial membranes (5–7), with expression of RNA of the α3(V) chain, which likely exists in tissues solely in the context of α1(V)α2(V)α3(V) heterotrimers (8), also reported in ligaments of developing joints, in developing peripheral nerves, and surrounding developing skeletal muscle (9, 10). Function(s) of α1(V)α2(V)α3(V) heterotrimers have been essentially unknown, as has possible involvement of α3(V) chain defects in human disease.
Here, we report that we have generated and begun characterizing mice with null alleles of the α3(V) gene Col5a3, toward defining in vivo roles of α3(V) chains and α1(V)α2(V)α3(V) heterotrimers. Microarray analysis showed α3(V) RNA to be at highest levels in human and mouse white adipose tissue/adipocytes (WAT/adipocytes), and in vivo Col5a3 ablation resulted in a degree of gender-specific reduction in WAT and resistance to diet-induced obesity. Due to the role of WAT as an important regulator of metabolic parameters, such as glucose tolerance and insulin sensitivity (11), the latter 2 parameters were investigated. Col5a3–/– mice are shown to be glucose intolerant and insulin resistant and to have hyperglycemia approaching diabetic levels at 1 year of age.
Type 2 diabetes is characterized by chronic insulin resistance in peripheral tissues, such as WAT and skeletal muscle, and by deficits in insulin production by pancreatic β cells. Thus, the diabetes-related Col5a3–/– symptoms led to searches for defects in WAT and other tissues that might underlie Col5a3–/– metabolic defects. Results demonstrated α3(V) expression in normal skeletal muscle and showed defects in glucose uptake in both Col5a3–/– WAT and skeletal muscle, defects likely to contribute to insulin resistance in these tissues. Additionally, α3(V) expression is demonstrated in pancreatic islets, and Col5a3–/– mice are shown to have reduced islet numbers, decreased β cell function, and increased β cell susceptibility to apoptosis, consistent with increased susceptibility to diabetes in the presence of additional risk factors.
Combined, the presented data show the α3(V) collagen chain to constitute an important element of the microenvironment of certain highly specialized cell types in WAT, skeletal muscle, and pancreatic islets and to have profound effects on the functionality of such cells. To our knowledge, this is the first report of an ECM defect predisposing to diabetes-related symptoms.
Results
Targeting of Col5a3.
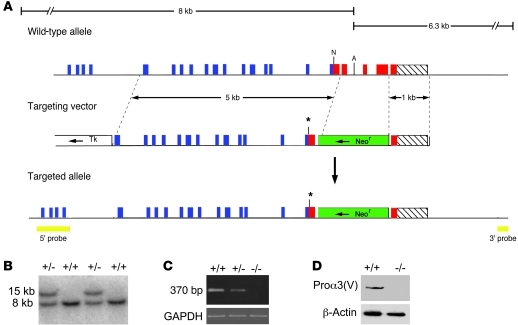
To characterize in vivo roles of the α3(V) chain, mice were engineered to have null alleles for the cognate Col5a3 gene. The targeting vector was designed to create a mutant allele encoding truncated pro-α3(V) chains lacking C-propeptides (Figure 1). As C-propeptides are necessary for procollagen chain association (12), the truncated chain would be unable to associate into trimers. The mutant allele would also contain a premature stop codon. It was thus predicted that the mutant allele would produce unstable RNA degraded by nonsense-mediated decay or, in the event that RNA persisted, a mutant chain would be produced that would not incorporate into triple helical trimers, leading to rapid degradation (13, 14). Immunoblotting with anti-α3(V) antibodies showed pro-α3(V) chains, readily detectable in wild-type samples, to be undetectable in Col5a3–/– 15.5-dpc embryos (Figure 1D), consistent with the conclusion that the targeted allele is null.
Figure 1. Targeted disruption of Col5a3.
(A) Structure of the targeting vector and Col5a3 locus, before and after homologous recombination. Horizontal arrows mark directions of transcription of neor and tk cassettes. Blue, red, and hatched boxes represent COL1, C-propeptide, and 3′-UTR exons, respectively. The green boxes represent the Neor cassette; the yellow boxes represent 5′ and 3′ external probes. The asterisks mark the site of a premature stop codon engineered via blunt-end ligation of a NarI site. A, AflII; N, NarI. (B) Southern blot of AflII-restricted genomic DNA from wild-type and correctly targeted ES cell clones hybridized to the 5′ probe. (C) RT-PCR analysis of total RNA from 15.5-dpc embryos detected a 370-bp amplimer corresponding to wild-type Col5a3 RNA in wild-type (+/+) samples that was diminished in Col5a3+/– (+/–) samples and absent in Col5a3–/– (–/–) samples. Amplification of a GAPDH product was a loading control. (D) Immunoblotting of 15.5-dpc embryo homogenates detects pro-α3(V) chains in wild-type but not Col5a3–/– samples. Reprobing with anti–β-actin antibody controlled for protein loading.
Col5a3 is expressed at high levels in WAT, and Col5a3 ablation produces WAT-related defects.
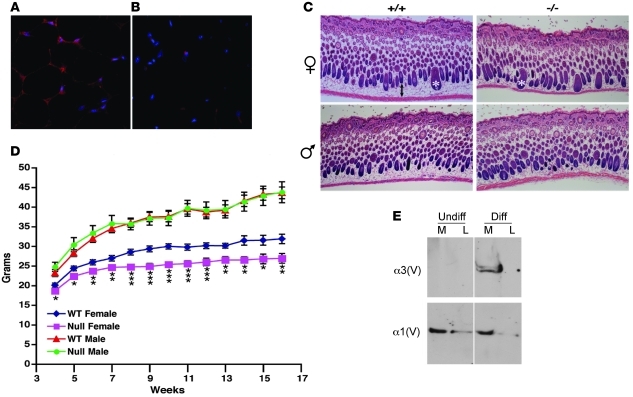
Search of a microarray database (BioGPS; http://biogps.gnf.org/#goto=welcome) (15) for expression of Col5a3 and the corresponding human gene COL5A3 unexpectedly found the highest expression levels in mouse WAT and human adipocytes (Supplemental Figure 1; supplemental material available online with this article; doi: 10.1172/JCI45096DS1). However, the same was not true for α1(V), suggesting that α3(V)-containing heterotrimers, but not col(V) per se, serve specialized roles conserved in mouse and human adipocytes. In support of such roles, independent analysis has shown Col5a3 to be a WAT-expressed gene, expression of which is decreased when adipogenic differentiation is compromised (16). Immunofluorescent staining confirmed the presence of α3(V) chains surrounding adipocytes in wild-type WAT (Figure 2A) but an absence of signal in Col5a3–/– WAT (Figure 2B), demonstrating signal specificity and providing further evidence that the mutant Col5a3 allele is indeed null.
Figure 2. WAT α3(V) expression and effects of Col5a3 ablation.
α3(V) chains are detectable in (A) wild-type but not (B) Col5a3–/– inguinal fat pads stained with DAPI (blue) and anti-α3(V) antibodies (red). Red spots in Col5a3–/– tissue are nonspecific secondary antibody deposits, also observed in controls performed without primary antibody (data not shown). (C) H&E-stained dorsal skin sections from 10-day-old mice show significantly reduced (P < 0.00005) thickness of the adipocyte-rich hypodermal layer of Col5a3–/– females (36.6 ± 6 μm, n = 6) compared with that of wild-type females (88.2 ± 11.5 μm, n = 5), with a trend toward reduced thickness of the hypodermal layer of Col5a3–/– males (41.8 ± 5.9 μm, n = 10) compared with that of wild-type males (51.1 ± 13.9 μm, n = 5) that did not achieve significance (P < 0.11). Thicknesses are in mean ± SD. A 2-headed arrow denotes the hypodermal layer of wild-type female skin. Asterisks mark 2 hair follicles. Original magnification, ×5 (A and B); ×40 (C). (D) Three-week-old wild-type (males, n = 15; females, n = 13) or Col5a3–/– (males and females each, n = 10) mice were maintained for 13 weeks on a high-fat diet and weighed each week. Average weights/week are in grams. Data are presented as mean ± SEM. *P < 0.05; **P < 0.01; ***P < 0.001. (E) Immunoblots are of cell layer (L) or media (M) samples from cells before (Undiff) or after (Diff) induced adipocytic differentiation. Blots were probed with anti-α3(V) or anti-α1(V) antibodies. For each blot, the thin vertical line indicates where data were spliced together from noncontiguous lanes. In each case, lanes were from the same blot, and thus represent samples run on the same gel, at the same time.
To begin determining the possible effects of α3(V) ablation on WAT, we assayed for effects on the adipocyte-rich hypodermis of 10-day-old mice. A significant decrease was observed in thickness of the hypodermal layer of Col5a3–/– female skin (Figure 2C), with a trend toward reduced dermal fat in Col5a3–/– males that did not reach significance with the numbers of mice assayed. Differences in skin fat content did not appear to be due to differences in eating behavior, as food intake was not significantly different between Col5a3–/– and wild-type males or females (Supplemental Figure 2, A and B). To determine differences in total body fat mass between Col5a3–/– and wild-type animals, dual-energy x-ray absorptiometry (DEXA) was performed on 10-week-old Col5a3–/– males (n = 8) and females (n = 9) and wild-type males (n = 10) and females (n = 9). A trend that did not reach significance was found for reduced total body fat between Col5a3–/– and wild-type females (P < 0.08), with no obvious differences between null and wild-type males (P < 0.73). DEXA analysis found no difference in amounts of abdominal fat between male (P < 0.33) or female (P < 0.20) Col5a3–/– and wild-type mice. Thus, changes in Col5a3–/– fat mass are subtle and appear limited to a subset of fat depots. Interestingly, although total body weights of neither Col5a3–/– males nor females on regular chow were significantly lower than those of wild-type counterparts (data not shown), on a high-fat diet, total body weights of Col5a3–/– females, but not males, were significantly lower than those of wild-type counterparts (Figure 2D). Thus, Col5a3 ablation confers resistance to diet-induced obesity in females.
To further investigate a possible adipocyte-specific dimension to α3(V) function, we used 3T3-L1 fibroblastic preadipocytes, which can be induced to differentiate to an adipocytic phenotype upon treatment with an insulin-containing adipogenic cocktail. Although α3(V) chains were absent from cultures of fibroblastic 3T3-L1 cells, they were readily detectable upon induction to adipocytic differentiation (Figure 2E). In contrast, α1(V) chains were present in 3T3-L1 cultures both before and after differentiation. Such results are consistent with the concept of an adipocyte-specific dimension to α3(V) function but absence of such a dimension to col(V) in general.
Col5a3–/– mice are glucose intolerant and insulin resistant.
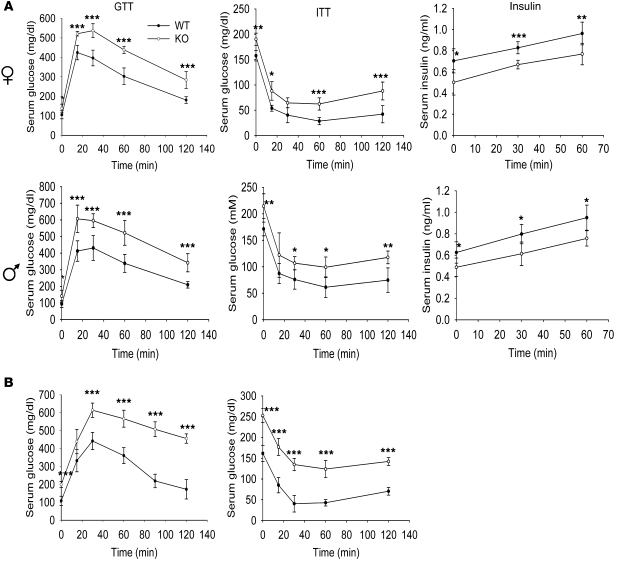
As WAT is an important regulator of various metabolic parameters (11), we assayed for effects on such parameters in Col5a3–/– mice. At 3 months of age, both female and male Col5a3–/– mice were found to be similarly glucose intolerant (Figure 3A), with differences between Col5a3–/– and wild-type glucose levels at the 0 time point, before glucose administration, showing Col5a3–/– mice of both sexes to be hyperglycemic. Col5a3–/– females and males were also similarly insulin resistant (Figure 3A). In addition, both Col5a3–/– females and males were found to have significantly lower serum insulin levels than wild-type counterparts (Figure 3A). Both glucose intolerance and insulin resistance seemed increased in 1-year-old mice (Figure 3B) compared with those in 3-month-old Col5a3–/– mice (Figure 3A).
Figure 3. Col5a3–/– mice have impaired glucose tolerance and insulin sensitivity and are hypoinsulinemic.
(A) Serum glucose levels are shown in mg/dl for 3-month-old female and male wild-type and Col5a3–/– (KO) mice (n = 6 for each combination of gender and genotype) after glucose administration for glucose tolerance tests (GTTs) or after insulin administration for insulin tolerance tests (ITTs). Areas under glucose tolerance test glucose curves for wild-type and Col5a3–/– females were 22,428 and 34,074 mg/dl per 120 minutes, respectively, demonstrating a significant (P < 0.001) 1.52-fold difference. Areas under the glucose tolerance test glucose curves for wild-type and Col5a3–/– males were 25,884 and 36,882 mg/dl per 120 minutes, respectively, demonstrating a significant (P < 0.002) 1.42-fold difference. Plasma insulin levels (insulin) were measured for aliquots of glucose tolerance test samples from 0, 30, and 60 minutes time points. (B) Glucose tolerance test and insulin tolerance test glucose levels are shown in mg/dl for 1-year-old wild-type (n = 12) and Col5a3–/– (n = 10) mice (genders were not tested separately for these assays). Areas under glucose tolerance test glucose curves for wild-type and Col5a3–/– mice were 19,926 and 38,772 mg/dl per 120 minutes, respectively, demonstrating a significant (P < 0.0002) 1.95-fold difference. Data are presented as mean ± SEM. *P < 0.05; **P < 0.01; ***P < 0.001.
α3(V) Chains are expressed by pancreatic islet cells and skeletal muscle.
Glucose intolerance and hyperglycemia can result from insulin resistance in WAT and/or other peripheral tissues and/or from reduced insulin secretion. Hypoinsulinemia in Col5a3–/– mice was suggestive of defects in pancreatic islet function. We’ve previously demonstrated α3(V) RNA transcripts in skeletal muscle and pancreas (9). As a prelude to determining the extent to which either tissue might be affected by Col5a3 ablation, we tested for α3(V) chains in both tissues.
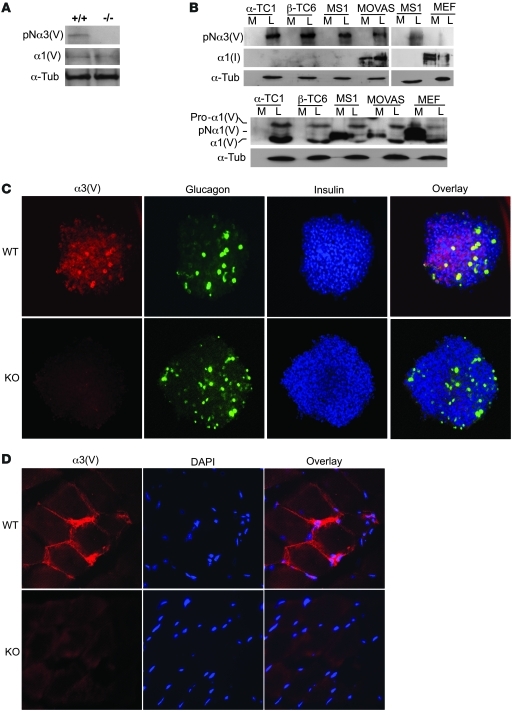
Immunoblots detected both α3(V) and α1(V) chains in wild-type pancreatic islets (Figure 4A) but only α1(V) chains in Col5a3–/– islets, again providing evidence that the mutated Col5a3 allele is null. To obtain insights into which islet cells produce α3(V) chains, immortalized murine α (α-TC1), β (β-TC6), and islet endothelial (MS1) cells were assayed by immunoblot. All 3 were found to produce α3(V) forms with electrophoretic mobilities consistent with an identity as pNα3(V) chains, from which C-propeptides have been cleaved, but which retain full-length N-terminal globular sequences (Figure 4B). Supporting this interpretation, the same band was in cell layers of MOVAS murine smooth muscle cells, which we knew to express pNα3(V) chains (G. Huang and D.S. Greenspan, unpublished observations), but was absent in mouse embryo fibroblast (MEF) cultures, in which α3(V) forms are not readily detectable (8). The sizes of 2 different α1(V)-related bands suggest α-TC1, β-TC6, MS1, and MOVAS cell layers to contain intracellular unprocessed pro-α1(V) chain precursors and mature ECM forms of α1(V), containing partially cleaved N-terminal globular sequences and lacking C-propeptides (8). Interestingly, although no cell type had detectable α3(V)-related chains in conditioned media, MS1-, MOVAS-, and MEF-conditioned media contained pNα1(V) forms, lacking the C-propeptide, but containing full-length N-terminal globular sequences (8). Thus, it is likely that all islet cell types assayed here deposit α1(V)α2(V)pNα3(V) heterotrimers into cell layer–associated ECM, while MS1 pancreatic endothelial cells and MOVAS smooth muscle cells also secrete pNα1(V)2α2(V) heterotrimers into media. Possible differences in the biological roles of these 2 forms of col(V), containing or lacking α3(V)-related chains and differentially deposited into cell layers or media, remain to be determined. Interestingly, the α1(I) chain of col(I), readily detected in cultures of both MOVAS cells and MEFs, both of which are known to produce col(I), was not detected in cultures of any of the islet-derived cells (Figure 4B). Thus, despite the dogma that col(V) is normally incorporated into col(I) fibrils (1), cells derived from islet α, β, and endothelial cells all produce col(V)-containing ECM that lacks col(I).
Figure 4. Immortalized islet cell types produce and pancreatic islets and skeletal muscle contain α3(V) chains.
Immunoblots of (A) isolated pancreatic islet extracts or of (B) media and cell layer extracts of various cell lines were stained with anti-α3(V) or anti-α1(V) antibodies or with anti–α-tubulin (α-Tub) antibody, as a loading control. (C) Immunofluorescent staining with anti-α3(V), anti-glucagon, and anti-insulin antibodies is shown for isolated and fixed islets. Overlay panels show areas of colocalization for α3(V) and glucagon (yellow) or for α3(V) and insulin (purple). (D) Immunofluorescent staining shows that skeletal muscle counterstained with DAPI contains readily detectable α3(V) chains. Col5a3–/– muscle and islets did not exhibit α3(V) staining, demonstrating specificity of the signal and the null nature of the targeted Col5a3 allele. Original magnification, ×20 (C); ×40 (D).
Immunohistochemical results (Figure 4C) were consistent with the immunoblot results (above), as they showed colocalization of α3(V) chains with glucagon and insulin in islets. α3(V) Was not readily detected in the exocrine pancreas (data not shown), perhaps explaining the low levels of α3(V) RNA detected via microarray analysis of whole pancreas (Supplemental Figure 1). Consistent with α3(V) RNA detection in skeletal muscle (9), immunohistochemistry readily detected α3(V) signal juxtaposed to sarcolemmas in wild-type muscle but not Col5a3–/– skeletal muscle (Figure 4D).
Deficits in Col5a3–/– pancreatic islets.
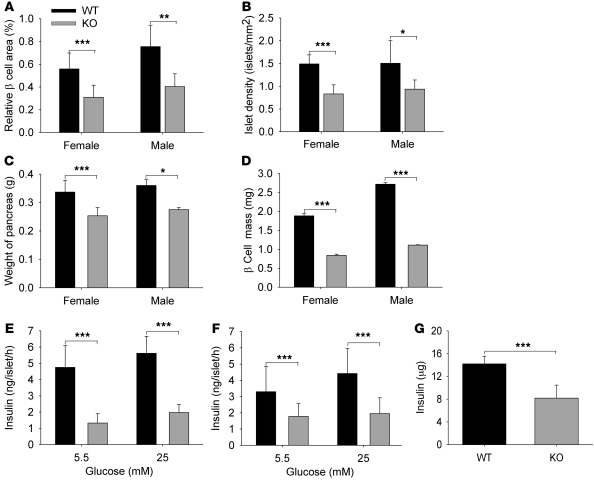
Examination found the relative β cell area to be significantly reduced in 8- to 12-week-old Col5a3–/– mice, compared with that in wild-type mice (Figure 5A), mostly due to reduced islet numbers (Figure 5B), as the average areas of Col5a3–/– and wild-type islets were similar (data not shown). The overall weights of Col5a3–/– pancreases were also less than those for wild-type pancreases (Figure 5C), contributing to reduced Col5a3–/– β cell mass (relative β cell area times pancreas weight) (Figure 5D). Islets isolated from Col5a3–/– pancreases secreted markedly lesser amounts of insulin than wild-type pancreases, for both females (Figure 5E) and males (Figure 5F), in the presence of both 5.5 and 25 mM glucose. Thus, Col5a3–/– islets are not only reduced in number, but residual islets appear to have a functional deficit. Whole pancreas insulin content was reduced in the Col5a3–/– pancreases (Figure 5G), suggesting that reduced insulin secretion by Col5a3–/– islets is due to decreased insulin production, rather than a secretion defect per se.
Figure 5. Col5a3–/– mice have reduced β cell relative area, numbers of pancreatic islets, β cell mass, and β cell function.
Eight- to twelve-week-old Col5a3–/– mice had highly significant decreases (A) in β cell area relative to total pancreas area, (B) in absolute numbers of pancreatic islets (islet density), (C) in pancreas weight, and, consequently, (D) in β cell mass (fractional cross-sectional area of β cells × pancreas weight) (n = 6–8 mice, per combination of gender and genotype). Islets isolated from (E) female or (F) male Col5a3–/– and wild-type pancreases (7–8 mice for each combination of genotype and gender) were incubated in the presence of 5.5 or 25 mM glucose, followed by ELISA quantification of insulin secretion. Eighteen islets were assayed per mouse (3 islets per tube, 3 tubes per each concentration of glucose, so that each assay was performed in triplicate). (G) ELISA was also used to quantify whole pancreas insulin content. Data are presented as mean ± SEM. *P < 0.05; **P < 0.01; ***P < 0.001.
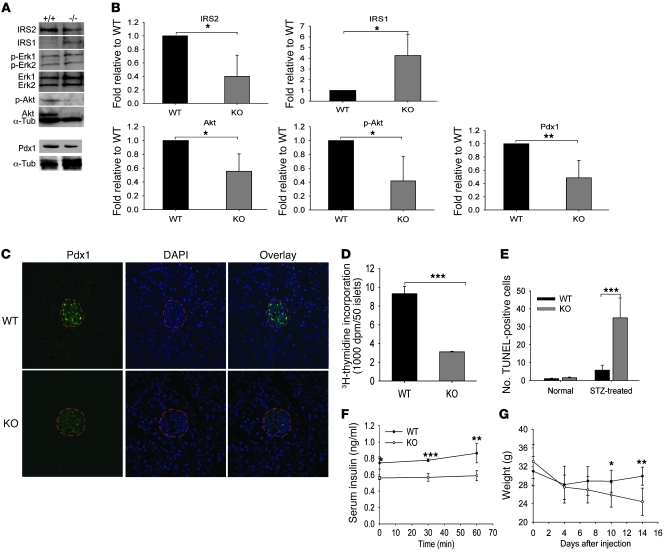
As insulin/IGF-1 signaling can affect insulin secretion and β cell mass (17), we next compared multiple protein components of the insulin/IGF-1 signaling pathways in wild-type and Col5a3–/– islets. Reproducible decreases in phospho-Akt levels were found in Col5a3–/– islets, which may have been due to reproducible decreases in Akt protein levels (Figure 6, A and B). Reproducible decreases were also found in the levels of IRS2, which is important to β cell survival and function (17). Interestingly, concomitant with decreased IRS2 levels were increased IRS-1 levels, perhaps representing a compensatory mechanism. No differences were detected in levels of phospho-Erk1/Erk2 or Erk1/Erk2 protein.
Figure 6. Aberrations in Col5a3–/– islet insulin/IGF-1 signaling pathway components and Pdx1 levels, and increased susceptibility to STZ.
(A) Representative immunoblots are shown of extracts of isolated islets stained with IRS2, IRS1, phospho-Erk1/Erk2 (p-Erk1, p-Erk2), Erk1/Erk2, phospho-Akt (p-Akt), Pdx1, and α-tubulin antibodies. The latter was a loading control. All blots are from the same SDS-PAGE gel, with the exception of the blot for Pdx1 and an associated α-tubulin control. (B) Immunoblots for IRS2, IRS1, phospho-Akt, Akt, and Pdx1 were repeated 3 times, from 3 independent preps of isolated islets (from different mice). Films were scanned, and results were quantified using NIH ImageJ software. In each histogram, results are normalized to wild-type values, and Col5a3–/– values are given ± SEM. (C) Immunofluorescent staining for Pdx1 in pancreas sections from 12-week-old wild-type and Col5a3–/– mice. Sections were counterstained with DAPI, and islets are outlined in red. Original magnification, ×10. (D) A comparison is shown of 3H-thymidine incorporation in response to serum-induced proliferation in wild-type and Col5a3–/– islets. (E) An approximately 7-fold increase in apoptosis was observed in islets of Col5a3–/– pancreases compared with that in wild-type pancreases from STZ-treated mice. Numbers are of TUNEL-positive cells/mm2 of total insulin-positive area in pancreas sections. Differences are shown in (F) plasma insulin levels and (G) body weight between STZ-treated Col5a3–/– and wild-type mice. Data are presented as mean ± SEM. *P < 0.05; **P < 0.01; ***P < 0.001.
Levels of transcription factor pancreatic and duodenal homeobox 1 (Pdx1), important in the differentiation and function of β cells and associated with effects of IRS2 (18), seemed somewhat reduced in Col5a3–/– islets, when assayed by immunoblotting (Figure 6A), an effect that was more apparent via immunofluorescent staining (Figure 6C). Additionally, Col5a3–/– islets showed decreased 3H-thymidine incorporation in response to serum-induced proliferation (Figure 6D), an apparent deficit in proliferative potential perhaps, contributing to the decreased islet numbers and β cell mass in 8- to 12-week-old Col5a3–/– mice. Although both IRS2 and Pdx1 have been implicated in antiapoptotic activity and promoting β cell survival (19, 20), only rare apoptotic β cells were observed in islets of both wild-type and Col5a3–/– mice at this age (data not shown). However, upon treating mice with the β cell toxin streptozotocin (STZ), numbers of apoptotic cells were much greater (~7-fold) in Col5a3–/– islets than in wild-type islets (Figure 6E). Thus, Col5a3–/– β cells have increased susceptibility to apoptosis in response to at least some forms of stress. Consistent with increased apoptosis in the islets of STZ-treated Col5a3–/– mice, STZ treatment accentuated Col5a3–/– and wild-type differences in plasma insulin levels (Figure 6F). In addition, as insulin-deficient diabetes can reduce body weight gain, it is of interest that STZ-treated Col5a3–/– mice underwent marked loss of body weight relative to that of STZ-treated wild-type controls (Figure 6G), perhaps secondary to impaired islet insulin production.
To obtain further insights into the inception and progression of deficits in Col5a3–/– islets, we examined plasma glucose and insulin levels, relative β cell area, and numbers of islets in Col5a3–/– and wild-type newborns. Interestingly, although Col5a3–/– and wild-type plasma glucose levels were indistinguishable, Col5a3–/– plasma insulin levels, relative area of β cells, and islet density were all significantly reduced compared with that in wild-type mice (Supplemental Figure 3). Thus, the reduced islet density in 8- to 12-week-old Col5a3–/– pancreases is already apparent in newborns.
Functional deficits in Col5a3–/– peripheral tissues.
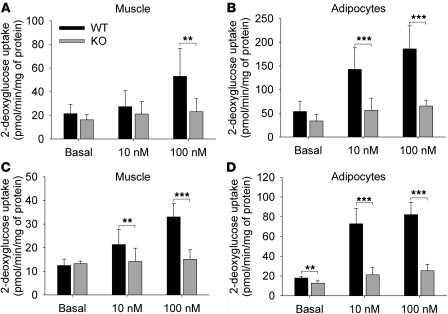
As Col5a3 is expressed in WAT and skeletal muscle, we sought to determine whether Col5a3–/– insulin resistance and glucose intolerance are associated with functional deficits in these tissues. Toward this end, soleus muscle and epididymal fat pad adipocytes from 10- to 12-week-old mice were tested. Glucose uptake in response to stimulation with 100 nM insulin was markedly decreased in both Col5a3–/– skeletal muscle (Figure 7A) and adipocytes (Figure 7B). In fact, glucose uptake was significantly decreased in Col5a3–/– adipocytes even in the presence of relatively low insulin levels (10 nM). Thus, insulin-stimulated glucose uptake is impaired in both Col5a3–/– muscle and WAT. Age-related reductions in glucose uptake were found in both Col5a3–/– and wild-type tissues (compare Figure 7, C and D, with Figure 7, A and B), such that glucose uptake in the adipocytes and skeletal muscle of 1-year-old Col5a3–/– mice (Figure 7, C and D) was at particularly low levels.
Figure 7. Deficient insulin-stimulated glucose uptake in Col5a3–/– skeletal muscle and adipocytes.
(A and C) Strips of soleus muscle and (B and D) adipocytes isolated from epididymal fat pads were incubated in the absence (basal) or presence of 10 or 100 nM insulin, prior to incubation in the presence of 2-deoxy-D-[2,6-3H]glucose and 1 mM 2-deoxyglucose and subsequent ascertainment of uptake. Tissues were from (A and B) 10- to 12-week-old or (C and D) 1-year-old mice. Muscle and adipocyte assays were repeated 8 and 7 times, respectively, in each case, using samples from different mice. Uptake values are shown ± SEM. **P < 0.01; ***P < 0.001.
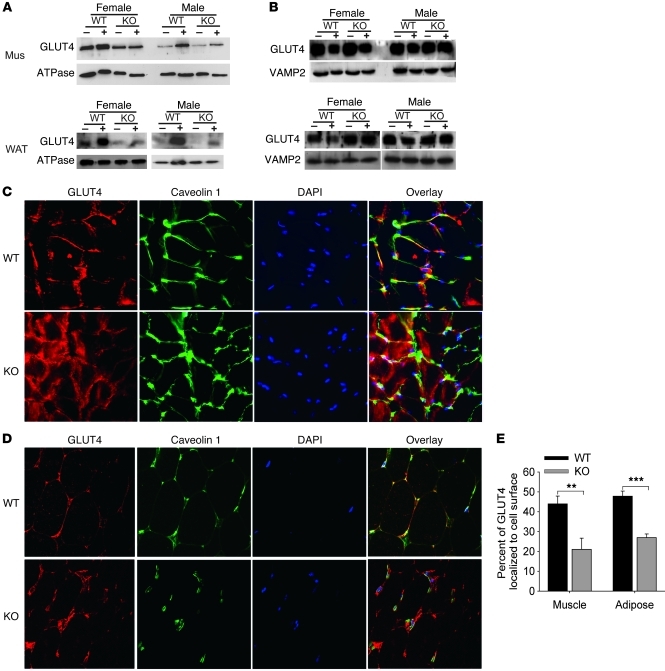
Glucose transport in muscle and WAT is achieved by redistribution of the intracellular glucose transporter 4 (GLUT4) to the plasma membrane (21). Subcellular fractionation and immunoblotting demonstrated decreased translocation of intracellular GLUT4 to the plasma membrane in response to insulin for female and male Col5a3–/– skeletal muscle and WAT (Figure 8A), despite intracellular stores of GLUT4 that were at similar levels in Col5a3–/– and wild-type skeletal muscle and at increased levels in Col5a3–/– WAT, compared with those in wild-type counterparts (Figure 8B). Similarly, whereas immunofluorescent staining showed colocalization of most GLUT4 with caveolin 1 in plasma membranes of wild-type skeletal muscle (Figure 8C) and WAT (Figure 8D), marked amounts of GLUT4 remained unmobilized in cytoplasms of both Col5a3–/– tissues upon stimulation with insulin. Thus, Col5a3–/– insulin resistance correlates with deficits in GLUT4 translocation, and glucose uptake, in skeletal muscle and WAT.
Figure 8. Immunoblot and immunofluorescence analysis of insulin-stimulated GLUT4 translocation to plasma membranes in skeletal muscle and WAT.
Immunoblots are shown of (A) plasma membrane proteins or (B) intracellular membrane proteins isolated from skeletal muscle (mus) or WAT of wild-type or Col5a3–/– mice that had been injected with either PBS (–) or insulin (+). Staining with antibodies to (A) Na+/K+ ATPase or (B) VAMP2 was performed to provide loading controls and plasma membrane–specific and intracellular membrane–specific protein markers, respectively. These experiments were repeated twice, with reproducible results. Frozen sections of (C) soleus muscle or (D) epididymal fat pads from wild-type or Col5a3–/– mice were stained with antibody to GLUT4 and plasma membrane marker caveolin 1. Sections were counterstained with DAPI. Overlay panels show areas of colocalization (yellow) for GLUT4 and caveolin 1. Original magnification, ×40 (C); ×20 (D). (E) Immunofluorescent results from C and D were quantitated, as described in Methods, to show the percentage of GLUT4 in tissues colocalized at cell surfaces with caveolin 1. Data are presented as mean ± SEM. **P < 0.01; ***P < 0.001.
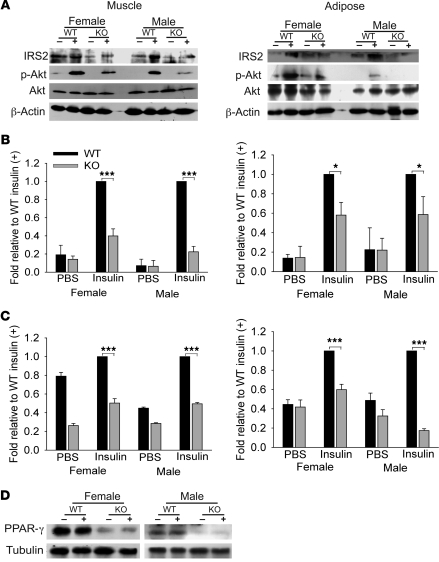
Insulin signaling in WAT and skeletal muscle leads to exocytosis of GLUT4-containing vesicles from intracellular stores to the plasma membrane (21). We thus tested for possible perturbed insulin signaling in Col5a3–/– muscle and WAT. Akt phosphorylation in response to insulin stimulation was decreased in Col5a3–/– WAT and even more so in muscle (Figure 9, A and B). Similarly, basal levels of IRS2 and levels in response to insulin were reduced in both Col5a3–/– tissues (Figure 9, A and C). However, levels of the insulin receptor and of PI3 kinase subunits p85 and p110 were not noticeably affected in Col5a3–/– muscle or WAT and neither were phosphorylation levels of p85 or the insulin receptor (data not shown). Interestingly, PPAR-γ, a nuclear receptor important to adipocyte differentiation, maintenance, and insulin sensitization (22), was at markedly decreased levels in Col5a3–/– WAT (Figure 9D).
Figure 9. Aberrations in insulin/IGF-1 signaling components and PPAR-γ levels in Col5a3–/– peripheral tissues.
(A) Representative immunoblots are shown of soleus muscle and epididymal fat pad extracts from wild-type and Col5a3–/– mice that had been injected with PBS (–) or insulin (+). Blots were stained with antibodies to IRS2, Akt, or phospho-Akt (Ser 473). Blots were also stained with anti–β-actin as a loading control. (B and C) Immunoblots were repeated 3 times, from 3 independent tissue preps (from different mice). Films were scanned, and results were quantified for (B) phospho-Akt and (C) IRS2, using NIH ImageJ software. In each histogram, results are normalized for values of insulin-treated wild-type mice, and Col5a3–/– values are given ± SEM. *P < 0.05; ***P < 0.001. (D) An immunoblot shows markedly decreased PPAR-γ levels in adipose of Col5a3–/– mice injected with PBS (–) or insulin (+).
α3(V) Knockdown in cell lines.
To demonstrate that the phenotypic features of Col5a3–/– mice are solely the result of α3(V) ablation and do not involve any additional, unforeseen genetic modifications, Col5a3 siRNA knockdown was performed in standard cell lines used for studies of β cell (β-TC6 and Min6 cell lines) and adipocyte (3T3-L1 cells) function to determine whether this type of α3(V) ablation generated defects similar to those observed in Col5a3–/– mouse tissues. In short, results were consistent with those obtained with Col5a3–/– tissues. Knockdown yielded decreased glucose-induced insulin secretion, cell proliferation, and levels of IRS2, Pdx1, and phospho-Akt in β-TC6 and Min6 β cells (Supplemental Figure 4, A–E). Knockdown also produced marked decreases in insulin-induced glucose uptake in 3T3-L1 cells, together with decreased IRS2 and phospho-Akt levels (Supplemental Figure 4, F and G). Interestingly, Col5a3–knocked-down 3T3-L1 cells also had markedly decreased levels of PPAR-γ and the impaired ability to fully mature into lipid-laden adipocytes (Supplemental Figure 4, G–I).
Metabolic effects and Col5a3–/– phenotypic rescue resulting from α3(V) overexpression.
As an additional control to demonstrate that phenotypic effects in Col5a3–/– tissues are due solely to α3(V) ablation, we attempted “rescue” of Col5a3–/– tissues and cells via transduction with α3(V)-expressing lentivirus. Transduced Col5a3–/– muscle, adipocytes, and islets expressed higher levels of α3(V) transcripts than did wild-type counterparts (Supplemental Figure 5A). Interestingly, glucose uptake of transduced Col5a3–/– adipocytes was not only rescued but was at significantly greater levels than in wild-type controls (Supplemental Figure 5B). Glucose uptake and insulin resistance were also successfully rescued in transduced Col5a3–/– muscle and islets, respectively, as they were at significantly higher levels than those in untransduced Col5a3–/– counterparts; however, levels were not greater than those in wild-type counterparts (Supplemental Figure 5, C and D). Presumably, rescue was more efficient in adipocytes, as these were in unicellular suspension, in which all cells would be available to transduction, whereas the interior cells of transduced intact muscle strips and islets would not have been as readily accessible to lentiviral vectors. In addition to effects on function, transduced muscle, adipocytes, and islets all showed increased levels of phospho-Akt and IRS2 compared with those of untransduced controls, while transduced Col5a3–/– adipocytes also showed increased PPAR-γ levels (Supplemental Figure 5E). The results thus demonstrate the ability of α3(V) overexpression to augment insulin sensitivity and perhaps insulin secretion as well.
Deficits in 1-year-old Col5a3–/– mice.
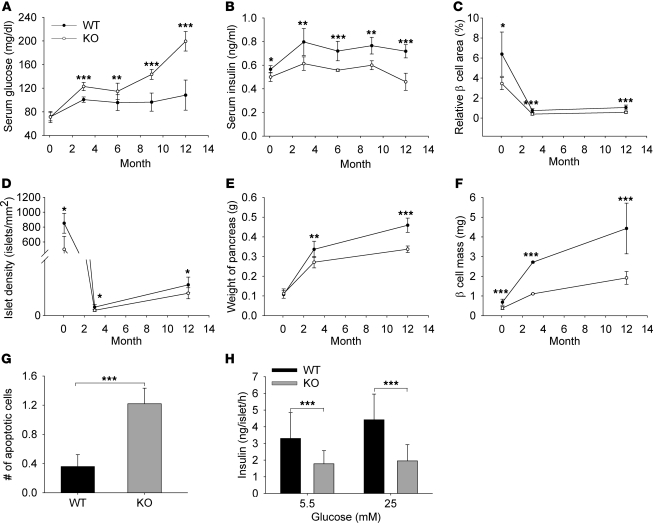
To obtain further insights into progression of the Col5a3–/– phenotype, fasting glucose and insulin levels were determined for 2-day-old and for 3-, 6-, 9-, and 12-month-old Col5a3–/– and wild-type mice. A striking difference was found in fasting glucose levels, which increased to near diabetic levels in 1-year-old Col5a3–/– mice, while remaining fairly constant in wild-type mice (Figure 10A). Col5a3–/– fasting insulin levels were consistently lower than those of wild-type mice in all age groups, and the disparity appeared to increase somewhat in 1-year-old mice (Figure 10B). As in newborns and 3-month-old mice, relative β cell area, islet density, pancreas weight, and β cell mass were all reduced in 1-year-old Col5a3–/– mice compared with that in wild-type mice (Figure 10, C–F). Interestingly, islets of 1-year-old mice contained greater than 3-fold more apoptotic cells than those of wild-type mice (Figure 10G), which may contribute to the drop in fasting serum insulin levels in these mice (Figure 10B). Consistent with the latter possibility, isolated Col5a3–/– islets appeared to have a greatly reduced ability to secrete insulin in vitro in response to glucose (Figure 10H). However, islets from 1-year-old Col5a3–/– mice were friable and difficult to isolate intact for in vitro assays, whereas islets from 1-year-old wild-type mice were not. Thus, mechanical damage upon isolation may contribute to the seemingly large decrease in insulin secretion by 1-year-old Col5a3–/– islets. Islet fragility also precluded in vitro assays of insulin/IGF-1 signaling and 3H-thymidine incorporation assays, which require relatively large numbers of isolated islets.
Figure 10. Effects of increasing age on the Col5a3–/– phenotype.
(A) Fasting glucose and (B) insulin levels were determined for 2-day-old and for 3-, 6-, 9-, and 12-month-old Col5a3–/– and wild-type mice. (C) Relative β cell area, (D) numbers of islets (islet density), (E) weight of pancreas, and (F) β cell mass are compared between Col5a3–/– and wild-type mice at 2 days, 3 months, and 1 year of age. (G) Numbers of lysotracker-positive (apoptotic) cells per islet and (H) levels of insulin secreted by isolated islets in response to 5.5 or 25 mM glucose are compared for 1-year-old Col5a3–/– and wild-type mice. Data are presented as mean ± SEM. *P < 0.05; **P < 0.01; ***P < 0.001.
As shown above, the hyperglycemia in 1-year-old Col5a3–/– mice was paralleled by particularly low levels of glucose uptake in muscle and adipocytes (Figure 7) and by insulin resistance (Figure 3B). In addition, as in 10- to 12-week-old mice (Figure 9), levels of insulin/IGF-1 signaling components IRS2 and phospho-Akt were decreased in WAT and skeletal muscle, and PPAR-γ levels were decreased in WAT of 1-year-old Col5a3–/– mice (Supplemental Figure 6).
Discussion
Findings that α3(V) chains are expressed at highest levels by adipocytes and are expressed by skeletal muscle and pancreatic islet cells are surprising, as col(V) has previously been associated only with effects on the geometry and strength of collagen fibrils in connective tissues such as skin and joints (3, 4). Nevertheless, the Col5a3–/– phenotype demonstrates the α3(V) chain to be an important component of ECM microenvironments that inform the functional behavior of adipocytes, skeletal muscle myofibers, and pancreatic islet cells. Col5a3 ablation effects on WAT/adipocytes are consistent with recent studies in which other ECM defects affected adipocyte biology (16, 23, 24), thus underscoring an emerging view of ECM as a major determinant of adipocyte behavior. Additionally, absence of α3(V) chains in 3T3-L1 preadipocyte cultures, but induction of such chains upon adipocytic differentiation, is consistent with an adipocyte-specific dimension to α3(V) function. Although effects on overall fat mass were relatively subtle in Col5a3–/– mice, effects on WAT function and the reduced PPAR-γ levels in Col5a3–/– WAT/adipocytes and reduced PPAR-γ levels and maturation deficits in Col5a3–knocked-down 3T3-L1 cells are consistent with an important role for the α3(V) chain in adipocyte function. As WAT is an important regulator of glucose tolerance and insulin sensitivity (11), these were assayed in Col5a3–/– mice. Although such parameters are usually associated with obesity, which also negatively impacts adipocyte function, nonobese Col5a3–/– mice were found to be glucose intolerant, insulin resistant, and hyperglycemic, even at 8 weeks of age. Clear evidence is also provided here of α3(V)-containing ECM in skeletal muscle, and a striking feature of the Col5a3–/– phenotype is shown to be marked impairment in insulin-induced glucose transport and in insulin-induced GLUT4 translocation to the plasma membrane in both skeletal muscle and adipocytes. As impaired glucose uptake can be the most significant rate-limiting defect in insulin resistance (25), these impairments in WAT and skeletal muscle may be of central importance to the Col5a3–/– metabolic phenotype. Since glucose uptake has also been described as the earliest defect in insulin resistance (25), GLUT4 translocation defects may lie closely downstream of the primary defect of Col5a3 ablation. This seems reasonable, as pericellular pNα3(V) chains are likely to affect cellular behavior via interactions with cell surface components, and GLUT4 translocation/glucose uptake are essentially cell surface phenomena. However, effects of Col5a3 ablation on GLUT4 translocation alone are unlikely to be sufficient to produce the Col5a3–/– phenotype, as the type of disruption of glucose homeostasis seen in Col5a3–/– mice is not obtained by ablation of the murine Glut4 gene (26).
β Cell dysfunction can also be an important contributor to glucose intolerance, and evidence is presented that islet β, α, and endothelial cells produce an ECM containing α1(V) chains and pNα3(V) chains, from which C-terminal but not N-terminal globular sequences have been cleaved. The latter is surprising, given previous suggestions that pro-α3(V) N-terminal sequences are cleaved by extracellular proteinases (8). Also, although previous studies have shown the α1(V)2α2(V) form of col(V) to be incorporated into col(I) fibrils (2), α, β, and islet endothelial cell ECM is shown to lack col(I). The apparently pericellular, rather than interstitial, distribution of the novel islet ECM provides the large and highly charged pNα3(V) N-terminal domain (9) with opportunities for extensive interactions with cell surface components. Previous reports that col(V) can occur as a pericellular/basement membrane–associated form (27–29) are consistent with the pericellular distribution of the pNα3(V)-containing islet ECM reported here and suggest that the latter may be associated with islet basement membrane components previously shown to be important to β cell survival and function (e.g., refs. 30, 31). Transplantation of β cells encapsulated in immunoprotective gels is a developing approach for treatment of insulin-dependent diabetes, and the survival and function of β cells encapsulated in such gels can be enhanced by including ECM components (31). Results presented here suggest α1(V)α2(V)pNα3(V) heterotrimers as candidate molecules for enhancing survival and function of primary β cells during culturing and upon encapsulation in gel environments for transplantation.
The importance of pNα3(V)-containing ECM to islet biology is evident in the reduced islet numbers and reduced insulin secretion by residual islets in 8- to 12-week-old mice. As whole pancreas insulin content was also reduced, reduced islet secretion is likely due to decreased insulin synthesis, rather than a secretion defect per se. A defect in insulin synthesis is consistent with the finding of somewhat decreased β cell levels of transcription factor Pdx1, which is involved in β cell differentiation and function (32). Although Pdx1 disruption can result in progressive β cell loss in adult mice (33), numbers of islets were already reduced in Col5a3–/– newborn pancreases, suggesting that reduced islet numbers at 8–12 weeks may result from developmental defects/delay, rather than progressive postnatal loss. Interestingly, whereas 8- to 12-week-old Col5a3–/– mice are hyperglycemic, Col5a3–/– newborn plasma levels are normal, consistent with the thesis that β cell dysfunction can occur well before hyperglycemia in progression toward type 2 diabetes (34). Consistent with previous reports that β cells are protected from stress-induced apoptosis by Pdx1 and by IRS2 (19, 20, 35), the latter of which was also at reduced levels in Col5a3–/– islets, islets in 8- to 12-week-old Col5a3–/– mice were approximately 7-fold more susceptible to STZ-induced apoptosis than wild-type islets. Similarly, islets in Col5a3–/– 1-year-old mice contained large numbers of apoptotic cells.
Interestingly, hyperglycemia reached near diabetic levels in 1-year-old Col5a3–/– mice. This may be attributed to the relatively severe insulin resistance noted in peripheral tissues of 1-year-old Col5a3–/– mice, along with failure of β cells to meet the demand created by the insulin resistance. A contributing factor to this failure may be the approximately 3-fold reduced proliferative potential demonstrated for Col5a3–/– islets, which may restrict increases in β cell mass. In addition, islets of 1-year-old Col5a3–/– mice were clearly aberrant, containing relatively large numbers of apoptotic cells and showing marked fragility upon isolation, defects which may arise from intrinsic Col5a3–/– β cell deficits exacerbated by the allosteric load resulting from increased insulin resistance.
Reduced phospho-Akt and IRS2 levels were observed in Col5a3–/– islets, WAT, and skeletal muscle. As insulin/IGF-1 signaling can affect β cell survival and insulin secretion (17), these reductions may contribute to Col5a3–/– defects in glucose metabolism. However, differences were not detected in levels of some other insulin/IGF-1 signaling pathway components in either islets or peripheral tissues. Moreover, defects in upstream insulin/IGF-1 signaling components may exacerbate rather than be central features of metabolic phenotypes or fail to be transmitted further downstream (36). It has also been suggested that such upstream defects in peripheral tissues are unlikely to be a major cause of deficits in glucose metabolism and are more likely the consequence than cause of insulin resistance (36). Thus, the extent to which apparent defects in insulin signaling may impact the Col5a3–/– phenotype remains to be determined.
Col5a3–/– mice are viable and fertile, suggesting the possibility of aberrant alleles of the orthologous COL5A3 gene in human populations. In this regard, it is of particular interest that the progressive decline in Col5a3–/– β cell function and the ultimate inability to compensate for increased insulin resistance in peripheral tissues are reminiscent of features underlying type 2 diabetes. However, insulin resistance and glucose intolerance, risk factors for diabetes, usually correlate with obesity. Thus, the combination of reduced adiposity, insulin resistance, and glucose intolerance suggests that Col5a3–/– mice have what we believe to be a novel constellation of phenotypic features, providing a — to our knowledge — unique model, capable of revealing new insights into mechanisms relevant to islet function, insulin resistance, obesity, lipodystrophies, and diabetes.
Methods
Generation of Col5a3–/– mice.
A targeting vector was designed to create a null Col5a3 allele, lacking all C-propeptide–encoding exons and containing a premature stop codon (Figure 1). See the Supplemental Methods for a detailed description. All animals were housed and treated in accordance with NIH guidelines, using protocols approved by the Research Animal Resources Center of the University of Wisconsin–Madison.
Mouse diets.
Unless otherwise specified, mice for the various studies were maintained on a normal chow diet (Teklad Rodent Diet 8604, Harlan). For the high-fat diet study (Figure 2D), 3-week-old mice were placed on a high-fat diet (D12451, Research Diets; 45 kcal % fat), with control mice maintained on normal chow. Mice for the latter study were weighed each of the 13 weeks on these diets.
3T3-L1 differentiation.
3T3-L1 cells were differentiated into adipocytes as described previously (37). Briefly, confluent cells in DMEM, 10% FBS (HyClone), and 1 mM l-glutamine were switched to basal differentiation medium (DMEM, 10% FBS, and 1.74 μM insulin [Sigma-Aldrich]) containing 1 μM dexamethasone (Sigma-Aldrich) and 1 μM isobutylmethylxanthine (Sigma-Aldrich) for 2 days. Subsequently, cells were maintained in basal differentiation medium alone, until day 6 after differentiation induction. Media were harvested in the presence of 0.1 mM PMSF, 1 mM N-ethylmaleimide, 1 mM p-aminobenzoic acid, and 10 mM EDTA. Cells were scraped into 4× Laemmli buffer containing the same protease inhibitors. Conditioned media were made 70% ethanol and incubated overnight at 4°C, and precipitates were resuspended in Laemmli buffer. Samples were made 5% β-mercaptoethanol, boiled, and immunoblotted.
Histology.
Ten-day-old mouse dorsal skin was fixed with 4% paraformaldehyde in PBS, dehydrated with an ethanol gradient, and paraffin embedded. Serial sections (10 μm) were mounted and stained with H&E.
Immunohistochemistry.
P10 inguinal fat pads were fixed in 4% paraformaldehyde/PBS and paraffin embedded. Ten-μm sections were deparaffinized; autofluorescence was quenched with 1% NaBH4; antigen retrieval was performed by autoclaving sections in 10 mM Na-Citrate, pH 4; and sections were treated with 1 mg/ml hyaluronidase (Type IV-S, Sigma-Aldrich). Sections were then blocked with 5% fish skin gelatin (Sigma-Aldrich) and incubated with anti-α3(V) antibodies, diluted 1:500, followed by Alexa Fluor 555 donkey anti-rabbit secondary antibodies.
Soleus muscle and epididymal fat pad were fixed in 10% buffered formalin and frozen in OCT or paraffin embedded, sectioned, and immunostained as described previously (38). Paraffin sections were deparaffinized prior to immunostaining. For immunostaining, sections were treated with 50 mM glycine to quench nonspecific binding sites. Samples were permeabilized and blocked with 1% BSA, 3% normal goat serum, and 0.1% saponin in PBS, followed by overnight incubation at 4°C with primary antibody, 1-hour incubation at room temperature with secondary antibody, and mounting. For some experiments, pancreatic islets were isolated, formalin fixed, and immunostained, as above. For quantitation of cell surface localization of GLUT4 (Figure 8E), NIH ImageJ software ( http://rsbweb.nih.gov/ij/) was used to separately determine total fluorescent values of GLUT4 and GLUT4 colocalized at cell surfaces with caveolin 1. The percentage of GLUT4 signal at cell surfaces was then divided by the total GLUT4 signal. Four sections, with over 5 cells per section, were quantified for each sample. See the Supplemental Methods for a more detailed description of immunohistochemical methods.
β Cell area/mass analyses.
Pancreases were weighed, fixed in 10% buffered formalin, paraffin embedded, horizontally cross-sectioned, deparaffinized, and immunostained with anti-insulin antibodies. All insulin-positive cells were imaged, and islet areas were determined in a section from each pancreas from 6 to 8 mice (8 to 12 weeks old) for each combination of gender and genotype or from 3 to 4 newborns (2 day old) using AxioVision AC Rel software (Carl-Zeiss). Relative β cell area was cross-sectional area occupied by insulin-positive cells divided by total pancreas cross-sectional area, determined by analysis of DAPI staining. β Cell mass was the product of relative β cell area times pancreas weight.
STZ treatment and apoptosis assay.
Mice were fasted overnight and were injected i.p. with 100 mg/kg STZ in 0.05 M citrate saline. Two weeks later, TUNEL assays were performed. Spleen and pancreas samples were co-embedded in paraffin to provide positive apoptosis controls. Sections were labeled using the FragEL Kit (Calbiochem), followed by insulin immunofluorescent staining. Numbers of TUNEL-positive cells were divided by total insulin-positive area per section to obtain apoptotic cells/mm2.
Whole pancreas insulin content.
Pancreases were blotted on gauze and placed in separate 20 ml glass scintillation vials containing ice-cold acid ethanol (21 ml H2O, 75 ml ETOH, and 1.5 ml 37% HCl). Pancreases were then chopped into approximately 1-mm3 pieces and placed at –20°C for approximately 18 hours. Samples were then neutralized with 65 μl 10 N NaOH, diluted 10,000-fold, and insulin ELISAs were performed, as above.
Glucose tolerance, insulin sensitivity, and ELISAs.
For glucose tolerance, 8-week-old mice were fasted 16 hours, then injected i.p. with 2 g/kg glucose. Bleeds were at time 0 (prior to injection) and at 5, 15, 30, 60, and 120 minutes after injection. Serum glucose levels were measured with a Glucose Oxidase Kit (Thermo). For insulin sensitivity, 10-week-old mice were fasted 6 hours and injected i.p. with 0.75 U/kg bovine insulin. Bleeds were at time 0 (prior to injection) and 15, 30, 60, and 120 minutes after injection. Glucose levels were measured as above. Serum insulin levels were measured in 0-, 30-, and 60-minute samples from the glucose tolerance studies, using the Ultrasensitive Mouse Insulin ELISA kit (Alpco Diagnostics).
Islet isolation.
Mice were fasted overnight and sacrificed, and pancreases were inflated via bile ducts with cold 0.5 mg/ml type V collagenase (C9263, Sigma-Aldrich). Pancreases were then incubated for approximately 20 minutes at 37°C, with shaking, followed by straining through stainless steel mesh and washing in 4°C Hanks balanced salt solution. Islets were centrifuged on a 25%, 23%, 20%, and 11% Ficoll gradient, harvested from the 11%–20% interface, washed in Hanks balanced salt solution, and then cultured overnight in RPMI medium, 11 mM glucose, 7.5% FBS, and 10 mM HEPES. Islets were then extracted in Laemmli buffer for immunoblotting, or 3 islets each were placed in microfuge tubes containing 1.0 ml RPMI, 1% gelatin, and 5.5 or 25 mM glucose and incubated 1.5 hours at 37°C, and medium was collected for analysis of secreted insulin using the Ultrasensitive Mouse Insulin ELISA Kit (Alpco Diagnostics). Results are from 7 to 8 mice (3 islets per mouse) for each combination of genotype and gender.
[3H]-thymidine incorporation.
[3H]-thymidine incorporation was as described previously (39), with minor modifications. Fifty islets per well were preincubated for 24 hours in 24-well plates in serum-free RPMI 1640 medium and 2.8 mM glucose, followed by 24 hours in RPMI 1640, 10% FBS, and 0.5 μCi/ml [3H]-thymidine. Islets were transferred to microfuge tubes, washed with ice-cold PBS, and then treated with ice-cold 10% trichloroacetic acid. Liquid was aspirated off, and the pellet was washed with cold PBS and then dissolved in 0.3 N NaOH. Incorporated radioactivity was measured by liquid scintillation counting. Proliferation assays for cultured cells were performed similarly.
LysoTracker Red apoptosis assay.
Pancreases were incubated for 30 minutes at room temperature in 1 μM LysoTracker Red DND-99 in DMEM. Tissues were then washed with prewarmed medium, frozen in OCT, sectioned, and immunostained with insulin antibody, as above.
Glucose uptake.
Ten- to twelve-week-old female mice were sacrificed after a 5-hour fast. Adipocytes were isolated as described previously (40). Adipocytes were placed in 6-well plates and left to recover for 3 hours at 37°C. Cells were then washed with KRH buffer (50 mM HEPES, pH 7.4, 136 mM NaCl, 4.7 mM KCl, 1.25 mM MgSO4, and 1.25 mM CaCl2) plus 0.1% BSA and incubated in KRH buffer/0.1% BSA at 37°C. After 30 minutes, the buffer was changed to KRH buffer/0.1% BSA supplemented with 2.5 mM cytochalasin B (nonspecific uptake control) and basal (no insulin), 10 nM, or 100 nM insulin for 15 minutes, before adding 5 μCi/ml 2-deoxy-D-[2,6-3H]glucose (Amersham) and 1 mM 2-deoxyglucose (Sigma-Aldrich).
Soleus muscle was dissected with a needle into longitudinal strips in Krebs-Henseleit bicarbonate (KHB) buffer supplemented with 0.1% BSA. Strips were rinsed with glucose-free KHB buffer and incubated in the same buffer for 30 minutes at 30°C. Buffer was then changed and glucose uptake measured as described previously (41). Briefly, strips were incubated in glucose-free KHB buffer containing 0.1% BSA, 2.5 mM cytochalasin B, and 0 (basal), 10, or 100 nM insulin for 15 minutes, prior to adding 5 μCi/ml 2-deoxy-D-[2,6-3H]glucose and 1 mM 2-deoxyglucose. All KHB buffers were pregassed with 95% O2–5% CO2. Uptake was stopped by centrifuging strips from media, resuspending them, and washing them in ice-cold PBS. Subsequent to assays, adipocytes and muscle strips were solubilized in 0.2% SDS, followed by mixing with Econo-safe (Research Products International) and measurement in a scintillation counter.
Plasma membrane protein extraction.
Ten- to twelve-week-old mice were fasted for 16 hours and then stimulated for 7.5 minutes with 1 U/kg insulin. Epididymal fat pads and soleus muscle were frozen, ground in liquid nitrogen, and then homogenized on ice with 2–3 volumes of Homogenization Buffer (Biovision). Homogenate was centrifuged for 10 minutes at 700 g at 4°C, and the supernatant was centrifuged for 30 minutes at 12,000 g at 4°C to yield a cytosol-containing supernatant and a pellet containing total cellular membrane proteins. The pellet was resuspended in 200 μl Upper Phase Solution, followed by addition of 200 μl Lower Phase Solution (Biovision), vortexing, incubation for 5 minutes on ice, and then centrifugation for 5 minutes at 1,000 g. The 2 phases were separated and then diluted with 5 volumes of water. After 5 minutes on ice, samples were centrifuged for 10 minutes at 16,000 g at 4°C. Upper phase and lower phase pellets, containing plasma and intracellular membrane proteins, respectively, were separately resuspended in Laemmli buffer and immunoblotted with GLUT4 (ab654), VAMP2 (ab70222), and Na+/K+-ATPase (ab7671) antibodies (Abcam).
Statistics.
Analyses were performed with 2-tailed Student’s t test, with differences considered significant at P < 0.05.
Supplementary Material
Acknowledgments
We thank Alan Attie, Summer M. Raines, and members of the laboratory of Colin Jefcoate for helpful comments. This work was supported by NIH grants R01-AR47746, R01-GM71679, and R01-AR53815 (to D.S. Greenspan).
Footnotes
Conflict of interest: Daniel S. Greenspan owns stock in FibroGen Inc. and is on the scientific advisory board of ImmuneWorks.
Citation for this article: J Clin Invest. 2011;121(2):769–783. doi:10.1172/JCI45096.
Gaoxiang Ge’s present address is: Institute of Biochemistry and Cell Biology, Shanghai Institutes for Biological Sciences, Chinese Academy of Sciences, Shanghai, China.
References
- 1. Fichard A, Kleman JP, Ruggiero F. Another look at collagen V and XI molecules. Matrix Biol. 1995;14(7):515–531. doi: 10.1016/S0945-053X(05)80001-0. [DOI] [PubMed] [Google Scholar]
- 2. Birk DE, Fitch JM, Babiarz JP, Doane KJ, Linsenmayer TF. Collagen fibrillogenesis in vitro: interaction of types I and V collagen regulates fibril diameter. J Cell Sci. 1990;95(pt 4):649–657. doi: 10.1242/jcs.95.4.649. [DOI] [PubMed] [Google Scholar]
- 3. Toriello HV, et al. A translocation interrupts the COL5A1 gene in a patient with Ehlers-Danlos syndrome and hypomelanosis of Ito. Nat Genet. 1996;13(3):361–365. doi: 10.1038/ng0796-361. [DOI] [PubMed] [Google Scholar]
- 4. Richards AJ, Martin S, Nicholls AC, Harrison JB, Pope FM, Burrows NP. A single base mutation in COL5A2 causes Ehlers-Danlos syndrome type II. . J Med Genet. 1998;35(10):846–848. doi: 10.1136/jmg.35.10.846. [DOI] [PMC free article] [PubMed] [Google Scholar]
- 5. Abedin MZ, Ayad S, Weiss JB. Isolation and native characterization of cysteine-rich collagens from bovine placental tissues and uterus and their relationship to types IV and V collagens. Biosci Rep. 1982;2(7):493–502. doi: 10.1007/BF01115247. [DOI] [PubMed] [Google Scholar]
- 6. Brown RA, Shuttleworth CA, Weiss JB. Three new alpha-chains of collagen from a non-basement membrane source. Biochem Biophys Res Commun. 1978;80(4):866–872. doi: 10.1016/0006-291X(78)91324-4. [DOI] [PubMed] [Google Scholar]
- 7. Sage H, Bornstein P. Characterization of a novel collagen chain in human placenta and its relation to AB collagen. Biochemistry. 1979;18(17):3815–3822. doi: 10.1021/bi00584a027. [DOI] [PubMed] [Google Scholar]
- 8. Gopalakrishnan B, Wang W-M, Greenspan DS. Biosynthetic processing of the Pro-alpha1(V)Pro-alpha2(V)Pro-alpha3(V) procollagen heterotrimer. J Biol Chem. 2004;279(29):30904–30912. doi: 10.1074/jbc.M402252200. [DOI] [PubMed] [Google Scholar]
- 9. Imamura Y, Scott IC, Greenspan DS. The pro-alpha3(V) collagen chain. Complete primary structure, expression domains in adult and developing tissues, and comparison to the structures and expression domains of the other types V and XI procollagen chains. J Biol Chem. 2000;275(12):8749–8759. doi: 10.1074/jbc.275.12.8749. [DOI] [PubMed] [Google Scholar]
- 10. Chernousov MA, Stahl RC, Carey DJ. Schwann cells secrete a novel collagen-like adhesive protein that binds N-syndecan. J Biol Chem. 1996;271(23):13844–13853. doi: 10.1074/jbc.271.23.13844. [DOI] [PubMed] [Google Scholar]
- 11. Rondinone CM. Adipocyte-derived hormones, cytokines, and mediators. Endocrine. 2006;29(1):81–90. doi: 10.1385/endo:29:1:81. [DOI] [PubMed] [Google Scholar]
- 12. Prockop DJ. Mutations that alter the primary structure of type I collagen. J Biol Chem. 1990;265(26):15249–15352. [PubMed] [Google Scholar]
- 13. Bateman JF, Lamande SR, Dahl H-HM, Chan D, Mascara T, Cole WG. A frameshift mutation results in a truncated nonfunctional carboxyl-terminal pro alpha1(I) propeptide of type I collagen in osteogenesis imperfecta. J Biol Chem. 1989;264(19):10960–10964. [PubMed] [Google Scholar]
- 14. Bulleid NJ, Dalley JA, Lees JF. The C-propeptide domain of procollagen can be replaced with a transmembrane domain without affecting trimer formation or collagen triple helix folding during biosynthesis. EMBO J. 1997;16(22):6694–6701. doi: 10.1093/emboj/16.22.6694. [DOI] [PMC free article] [PubMed] [Google Scholar]
- 15. Su AI, et al. Large-scale analysis of the human and mouse transcriptomes. Proc Natl Acad Sci U S A. 2002;99(7):4465–4470. doi: 10.1073/pnas.012025199. [DOI] [PMC free article] [PubMed] [Google Scholar]
- 16. Chun T-H, Hotary KB, Sabeh F, Saltiel AR, Allen ED, Weiss SJ. A pericellular collagenase directs the 3-dimensional development of white adipose tissue. Cell. 2006;125(3):577–591. doi: 10.1016/j.cell.2006.02.050. [DOI] [PubMed] [Google Scholar]
- 17. Kulkarni RN. Receptors for insulin and insulin-like growth factor-1 and insulin receptor substrate-1 mediate pathways that regulate islet function. Biochem Soc Trans. 2002;30(2):317–322. doi: 10.1042/BST0300317. [DOI] [PubMed] [Google Scholar]
- 18. Kushner JA, et al. Pdx1 restores beta cell function in Irs2 knockout mice. J Clin Invest. 2002;109(9):1193–1201. doi: 10.1172/JCI14439. [DOI] [PMC free article] [PubMed] [Google Scholar]
- 19. Withers DJ, Burks DJ, Towery HH, Altamuro SL, Flint CL, White MF. Irs-2 coordinates Igf-1 receptor-mediated beta-cell development and peripheral insulin signalling. Nat Genet. 1999;23(1):32–40. doi: 10.1038/12631. [DOI] [PubMed] [Google Scholar]
- 20. Sachdeva MM, et al. Pdx1 (MODY4) regulates pancreatic beta cell susceptibility to ER stress. Proc Natl Acad Sci U S A. 2009;106(45):19090–19095. doi: 10.1073/pnas.0904849106. [DOI] [PMC free article] [PubMed] [Google Scholar]
- 21. Bryant NJ, Govers R, James DE. Regulated transport of the glucose transporter GLUT4. Nat Rev Mol Cell Biol. 2002;3(4):267–277. doi: 10.1038/nrm782. [DOI] [PubMed] [Google Scholar]
- 22. Sugii S, et al. PPARgamma activation in adipocytes is sufficient for systemic insulin sensitization. Proc Natl Acad Sci U S A. 2009;106(52):22504–22509. doi: 10.1073/pnas.0912487106. [DOI] [PMC free article] [PubMed] [Google Scholar]
- 23. Yang M, et al. Cathepsin L activity controls adipogenesis and glucose tolerance. Nat Cell Biol. 2007;9(8):970–977. doi: 10.1038/ncb1623. [DOI] [PubMed] [Google Scholar]
- 24. Scherer PE, Bickel PE, Kotler M, Lodish HF. Cloning of cell-specific secreted and surface proteins by subtractive antibody screening. Nat Biotechnol. 1998;16(6):581–586. doi: 10.1038/nbt0698-581. [DOI] [PubMed] [Google Scholar]
- 25. Petersen KF, Shulman GI. Etiology of insulin resistance. Am J Med. 2006;119(5 suppl 1):S10–S16. doi: 10.1016/j.amjmed.2006.01.009. [DOI] [PMC free article] [PubMed] [Google Scholar]
- 26. Katz EB, Stenbit AE, Hatton K, DePinho R, Charron MJ. Cardiac and adipose tissue abnormalities but not diabetes in mice deficient in GLUT4. Nature. 1995;377(6545):151–155. doi: 10.1038/377151a0. [DOI] [PubMed] [Google Scholar]
- 27. Konomi H, Hayashi T, Nakayasu K, Arima M. Localization of type V collagen and type IV collagen in human cornea, lung, and skin. Immunohistochemical evidence by anti-collagen antibodies characterized by immunoelectroblotting. Am J Pathol. 1984;116(3):417–426. [PMC free article] [PubMed] [Google Scholar]
- 28. Madri JA, Dreyer B, Pitlick FA, Furthmayr H. The collagenous components of the subendothelium. Correlation of structure and function. Lab Invest. 1980;43(4):303–315. [PubMed] [Google Scholar]
- 29. Gay S, Martinez-Hernandez A, Rhodes RK, Miller EJ. The collagenous exocytoskeleton of smooth muscle cells. Coll Relat Res. 1981;1(4):377–384. doi: 10.1016/s0174-173x(81)80014-3. [DOI] [PubMed] [Google Scholar]
- 30. Kaido T, Yebra M, Cirulli V, Montgomery AM. Regulation of human beta-cell adhesion, motility, and insulin secretion by collagen IV and its receptor alpha1beta1. J Biol Chem. 2004;279(51):53762–53769. doi: 10.1074/jbc.M411202200. [DOI] [PubMed] [Google Scholar]
- 31. Weber LM, Hayda KN, Anseth KS. Cell-matrix interactions improve beta-cell survival and insulin secretion in three-dimensional culture. Tissue Eng Part A. 2008;14(12):1959–1968. doi: 10.1089/ten.tea.2007.0238. [DOI] [PMC free article] [PubMed] [Google Scholar]
- 32. Bernardo AS, Hay CW, Docherty K. Pancreatic transcription factors and their role in the birth, life and survival of the pancreatic beta cell. Mol Cell Endocrinol. 2008;294(1–2):1–9. doi: 10.1016/j.mce.2008.07.006. [DOI] [PubMed] [Google Scholar]
- 33. Ahlgren U, Jonsson J, Jonsson L, Simu K, Edlund H. beta-cell-specific inactivation of the mouse Ipf1/Pdx1 gene results in loss of the beta-cell phenotype and maturity onset diabetes. Genes Dev. 1998;12(12):1763–1768. doi: 10.1101/gad.12.12.1763. [DOI] [PMC free article] [PubMed] [Google Scholar]
- 34. Kahn SE. Clinical review 135: The importance of beta-cell failure in the development and progression of type 2 diabetes. J Clin Endocrinol Metab. 2001;86(9):4047–4058. doi: 10.1210/jc.86.9.4047. [DOI] [PubMed] [Google Scholar]
- 35. Johnson JD, et al. Insulin protects islets from apoptosis via Pdx1 and specific changes in the human islet proteome. Proc Natl Acad Sci U S A. 2006;103(51):19575–19580. doi: 10.1073/pnas.0604208103. [DOI] [PMC free article] [PubMed] [Google Scholar]
- 36. Hoehn KL, et al. IRS1-independent defects define major nodes of insulin resistance. Cell Metab. 2008;7(5):421–433. doi: 10.1016/j.cmet.2008.04.005. [DOI] [PMC free article] [PubMed] [Google Scholar]
- 37. Cimafranca MA, Hanlon PR, Jefcoate CR. TCDD administration after the pro-adipogenic differentiation stimulus inhibits PPARgamma through a MEK-dependent process but less effectively suppresses adipogenesis. Toxicol Appl Pharmacol. 2004;196(1):156–168. doi: 10.1016/j.taap.2003.12.005. [DOI] [PubMed] [Google Scholar]
- 38. Malide D. Application of immunocytochemistry and immunofluorescence techniques to adipose tissue and cell cultures. Methods Mol Biol. 2008;456:285–297. doi: 10.1007/978-1-59745-245-8_21. [DOI] [PubMed] [Google Scholar]
- 39. Islam MS, Sjoholm A, Emilsson V. Fetal pancreatic islets express functional leptin receptors and leptin stimulates proliferation of fetal islet cells. Int J Obes Relat Metab Disord. 2000;24(10):1246–1253. doi: 10.1038/sj.ijo.0801370. [DOI] [PubMed] [Google Scholar]
- 40. Kanda H, et al. Adipocytes from Munc18c-null mice show increased sensitivity to insulin-stimulated GLUT4 externalization. J Clin Invest. 2005;115(2):291–301. doi: 10.1172/JCI22681. [DOI] [PMC free article] [PubMed] [Google Scholar]
- 41. Thompson AL, Lim-Fraser MY, Kraegen EW, Cooney GJ. Effects of individual fatty acids on glucose uptake and glycogen synthesis in soleus muscle in vitro. Am J Physiol Endocrinol Metab. 2000;279(3):E577–E584. doi: 10.1152/ajpendo.2000.279.3.E577. [DOI] [PubMed] [Google Scholar]
Associated Data
This section collects any data citations, data availability statements, or supplementary materials included in this article.


