

Abstract
Traditional methods for detection and identification of pathogenic viruses or bacteria tend to be slow and cumbersome. We have developed aptamer probes with the capacity to rapidly detect the presence of viral infection with specificity and sensitivity. Vaccinia virus (VV) was chosen as the model because it is closely related to variola virus that causes smallpox. A method known as cell-SELEX (Systematic Evolution of Ligands by Exponential Enrichment) was used to generate very selective and highly specific aptamers designed to recognize proteins expressed on the surface of VV-infected cells. Characterization of the aptamers showed that the virus-encoded hemagglutinin, a protein expressed on the surface of infected cells, is the preferential binding target. These studies show the feasibility of generating aptamers against a given specific infectious agent and will enable further development of aptamers as diagnostic and/or therapeutic tools against a broad range of infectious agents.
Introduction
Infectious diseases are caused by a variety of pathogenic agents, including viruses, bacteria, fungi, protozoa and parasites. According to the World Health Organization (WHO), infectious diseases account for almost 5% of total deaths worldwide.1 Although the influenza pandemic of 1918 is estimated to have caused 25 million deaths in one year.2, the single greatest killer of mankind has been attributed to smallpox.3 Smallpox (Variola) was declared eradicated via vaccination by the World Health Organization (WHO) in 1978, but recent terrorist acts have rekindled fears of smallpox as a potential biological weapon of mass destruction.4–6 Thus, the need for enhanced global protection argues for the development of new, more sensitive methods of detection for these viruses. Virus related to variola such as monkeypox can cause serious disease in the human population5. Ultimately diseases caused by various orthopoxviruses need to be differentiated for both political and medical reasons.
The detection and identification of a pathogenic agent involves an array of techniques, such as immunological and PCR-based assays, DNA/RNA hybridization, electron microscopy and cell-culture, including the production of cytopathic effects in cell culture7;8,9. This paper reports the developmet of nucleic acid-based aptamer probes that can recognize cells infected with VV, a prototype surrogate virus used to study aspects of smallpox (variola) infection as a “proof of principle system”. Aptamers have the advantage of high sensitivity, a defined, reproducible sequence which can be easily amplified, stability in a variety of storage conditions and rapid deployment. Moreover, aptamers can be readily labeled with a number of “tags” which facilitate detection.10 The 3-dimensional folding of an aptamer around its target provides the hydrogen bonding Van der Waals interactions, as well as other forces, that result in selectivity and affinity.11 Aptamers have been generated against ions, small molecules, drugs, peptides and proteins.12–16 In recent years, researchers have been able to increase the complexity of targets for SELEX by using cell-lysate, cell-membrane and whole cells.17–19 Typically aptamers are single-stranded DNA's containing 60–80 nucleotides. Aptamers are selected from DNA pools using a process known as SELEX (Systematic Evolution of Ligands by Exponential Enrichment).20,21 An adaptation of the SELEX method, called cell-SELEX is used if the target uses a cell. A library of ssDNA is prepared consisting of 1014–15 unique sequences flanked by a constant region on either side for PCR amplification. Enrichment is achieved by alternative binding cycles to infected and uninfected cells. Several rounds of incubation lead to selection of an ssDNA pool with higher affinity for the target. The pools with highest affinity are deconvoluted by sequencing and alignment software. Individual consensus sequences are then tested, resulting in aptamers which are further characterized to determine their apparent dissociation constants and binding properties.
Infected Cell- SELEX, exploits intrinsic differences between uninfected and infected cell surfaces, allowing selection of aptamers which target proteins expressed on the surface of infected cells, and hence bind to target proteins which may be highly antigenic and structurally unique.22 Nitsche et.al reported aptamers generated for VV that can specifically detect the presence of virus, but cannot detect infected cells.23 However, infected cells can be used to generate aptamers as shown in previous work in this laboratory24 There is an additional benefit to this approach, in that the target of an aptamer-binding biomolecule becomes a potential biomarker for a particular pathogen.25 This paper details the methods for aptamer generation and selection of aptamers for VV infected cells, as well as the identification of one primary aptamer target of VV-infected cells to be the virus-encoded hemagglutinin (HA, also known as A56R)), a protein previously identified on the surface of infected cells.
Materials and Methods
Cell lines, viruses and reagents
HeLa (Human cervical cancer), CV1 (African Green Monkey Kidney Fibroblasts), RK13 (Rabbit Kidney Epithelial cells) and PK15 (Pig Kidney Epithelial cells) were obtained from ATCC (American Type Culture Collection) and were cultured in F11 (also known as Minimum Essential medium from GIBCO) supplemented with 10% Fetal Bovine Serum (FBS) (heat- inactivated from GIBCO), 100 IU/mL penicillin-streptomycin, 2mM Glutamine and 100uM non-essential amino acids and 1mM sodium pyruvate. BSR T7 cells were grown in Dulbecco's Modified Eagle Medium with 8% FBS and 0.6mg/mL Genticin added at alternate passages to maintain expression of T7 RNA Polymerase.
Viruses VV WR, VV IHDJ, VV IHDW, Rabbitpox virus, Cowpox virus and myxoma virus were used for this work. For generation of aptamers, a recombinant VV expressing GFP under an early/late viral promoter was used. VV expressing T7 polymerase was used for the AlphaScreen™ assay. For testing the antiviral effects of aptamers, VV expressing luciferase under a T7 polymerase promoter was used.
Washing buffer used during SELEX contained 4.5g/l glucose and 5mM MgCl2 in Dulbecco's PBS (Sigma). To reduce nonspecific background binding, BSA (1mg/mL from Fisher) with t-RNA (0.1mg/mL) was added to make binding buffer from the wash buffer. Trypsin was purchased from Fisher, and PCR reagents and Taq polymerase were purchased from Takara. IP buffer for AlphaScreen experiments contained 100 mM NaCl, 100 mM Tris, pH 8.0 and 0.5% NP-40, containing 25 uL/mL Roche complete protease inhibitor.
Infection protocol
The virus stored at −80°C was freshly thawed and diluted in culture media without FBS. It was sonicated for 1 minute for uniform dispersal of viral particles and added to cells, which were freshly split and cultured 24 hours before infection. The cells were infected at a multiplicity of 10, unless otherwise stated, i.e., 10 viral particles per cell for one hour at 37°C on a rocking platform in an incubator to achieve uniform virus adsorption. The virus inoculum was removed, and fresh culture medium was added to continue the infection. At fifteen hours post-infection (hpi), the cells were monitored for GFP production by fluorescence microscopy.
SELEX primers and DNA library
The ssDNA library consisted of a randomized 45mer core with both ends having a fixed 18mer primer site for PCR amplification after each SELEX round. The primers each had a fluorescent label and a biotin label (primer A: Cy5ATCCAGAGTGACGCAGCA; and primer B: BiotinACTAAGCCACCGTGTCCA), to generate ssDNA after PCR amplification by using high performance streptavidin-coated sepharose beads from GE Healthcare. The sense strand with Cy5 label was used for the next round of selection, and flow cytometry was used to monitor the progress of selection. The primers were optimized by using Oligoanalyzer from IDT DNA Technologies, USA.
SELEX protocol
Infected cells in a 35mm diameter dish were incubated with 200ul ssDNA which was denatured at 95°C for 5 minutes and cooled on ice for 10 minutes to reduce the intermolecular hybridization. It was kept on a rocking platform at 4°C in a cold room for 60 minutes. The initial pool had a 20nmol DNA concentration, and later selection rounds had 100pmol of DNA dissolved in binding buffer. The buffer was removed and the cells washed with a milliliter of washing buffer. As the selection progressed, the stringency of selection was increased by slowly increasing the washing strength from 1.0mL to 5.0mL and reducing the incubation time from 60 minutes to 40 minutes. The cells were harvested in 500ul of binding buffer and the DNA eluted by heating at 95°C for 10 minutes. PCR amplification was performed with 10–20 cycles of denaturing, annealing and extension, using appropriate temperatures optimized after each round for nonspecific amplification. Counter selection with uninfected cells was introduced after the 5th round of SELEX and performed after every alternate round of selection to remove DNA binding to uninfected cells. The dsDNA obtained after PCR amplification was treated with streptavidin- coated sepharose beads. The biotin-coated DNA attached itself to the beads which were separated in a column. Sodium hydroxide (0.1 M) was then added to denature and release the sense ssDNA with a Cy-5 label for the next round of SELEX, and progress was monitored with a flow cytometer.
After the 20th round of selection, the DNA pool was amplified using unlabeled primers and cloned into Escherichia coli using a TOPO TA cloning kit from Invitrogen. Sequencing was done at the ICBR sequencing core at the University of Florida. The obtained sequences were aligned using Clustal X alignment software. The aptamers were grouped according to the number of repeats of the families.
Flow cytometric analysis
Infected cells (HeLa, CV1, RK13, and PK15) were treated with trypsin for 1 minute, removed from the dish, diluted in culture medium, and rocked for an hour to recover. One-half million cells were then incubated with 100ul 250nM Cy5-labeled ssDNA pool for 45 minutes at 4°C. Cells were then washed twice with 2.5mL of washing buffer and then resuspended in 250uL binding buffer. Thirty thousand cells were counted on a BD FACScan flow cytometer (Becton Dickinson Immunocytometry Systems, USA). The fluorescence readouts on channel 1 represented the GFP expression of infected cells, and channel 4 represented the affinity of the Cy5-labeled pools towards their target, the infected cells. The initial library was used as a control for all samples. After the generation of aptamers, FITC-labeled aptamers were used for characterization using cells infected with wild-type VV. The apparent dissociation constants (Kds) were measured by flow cytometry using the equation Y=Bmax X/(Kd+X) and flow cytometry in the following manner. Similar to the procedure noted above, a series dilution of the aptamers was incubated and analyzed on the flow cytometer. Also in a series dilution, the initial ssDNA library was monitored, and the mean fluorescence of the control library was subtracted from the mean fluorescence of the aptamer at that concentration. The values obtained were input to statistical software to determine the apparent Kd of the aptamer-cell interaction.
Competition experiments
In the first experiment, FITC- or Cy-5-labeled aptamer and an unlabeled aptamer in 10× excess were added together to vaccinia-infected HeLa cells. In the second experiment, labeled aptamer was added sequentially, and after 30 minutes of incubation, a 10× excess of unlabeled aptamer was incubated for another 30 minutes.
Target identification
a) Flow Cytometry
Different viruses, namely VV WR, VV IHDJ, VV IHDW, rabbitpox, cowpox, and myxoma, were used to infect cells. CV1 cells were infected at moi =10 and the binding of aptamer studied as stated above.
b) AlphaScreen
CV1 cells grown in a 12-well plate were infected with a recombinant VV T7 at moi =5 and transfected with plasmids to overexpress HA, SPI-3 and B5 using Lipofectamine 2000. Similarly, BSR T7 cells were grown in a 12-well plate and infected with RPV at moi = 5.0 and transfected with plasmids to express HA and SPI-3 using Lipofectamine 2000. At 15 hpi, the infected cells were incubated with aptamer for 1hr and harvested by scraping off the dish. The lysate was centrifuged at 8000rpm for 3 minutes, and the cell pellet was resuspended in 50ul IP buffer (100 mM NaCl, 100 mM Tris, pH 8.0, 0.5% NP-40, 25μl/ml Roche complete protease inhibitor) and kept on ice for 5 minutes and spun at 13000rpm. Five uL of supernatant was used for each AlphaScreen assay. This supernatant was incubated with Ni-chelate acceptor beads (20μg/mL), which can recognize the His tag for 1.5 hours in dark conditions (beads are light sensitive), in a 384-well plate. After this incubation, the streptavidin donor beads (20μg/mL) were added to the supernatant, mixed by pipetting, and incubated for another 1.5 hours in the dark. The final reaction volume was 25ul. The plate was read on an Envision Plate reader from Perkin-Elmer.
Application of aptamers
Detection of infection
CV1 cells were cultured in 8-well slides under standard conditions. The aptamer binding assay was performed with 200nM Alexa Fluor 594-labeled aptamers. The cells were fixed either before or after with 4% paraformaldehyde solution in PBS for 10 mins and quenched by PBS with 20mM glycine. Cells washed with PBS were blocked with PBS plus 10% FBS for 10 minutes if cells were fixed before aptamer incubation. The slides were then covered with nuclei- staining DAPI containing mounting medium VectaMount™. The imaging was performed on a Zeiss Axiovert 200M inverted fluorescence microscope.
Aptamers in complex media
Aptamer binding assay, as described above, were performed with increasingly complex media instead of binding buffer. Experiments were performed in 15% Fetal Bovine Serum (FBS from GIBCO) and 50% human plasma.
Antiviral effect luminescence assay
CV-1 cells were grown in a 96-well plate under standard conditions. The cells were infected with a modified VV expressing luciferase (VV Luc) with T7 polymerase promoter. The cells were adsorbed at different moi of 10, 1, 0.1, 0.0 and as low as 10 plaque forming units (pfu) per well for 1 hour at room temperature in an F11 medium without serum and phenol red. After adsorption, F11 medium with 10% FBS (without phenol red) was added to the wells, and luciferase activity was measured at different time intervals to quantify the amount of virus growth in the presence and absence of the aptamer.
Results and Discussion
Generation of aptamers using SELEX
The infected cell-SELEX methodology was used to generate aptamers utilizing the differences on cell surfaces of infected and uninfected cells (Supplementary Figure S1). Although VV completes its replication cycle in 12–24 hours, cell-surface changes do not occur immediately upon infection. As the infection progresses, the infected cell surface is modified by viral proteins and also becomes fragile and porous, ultimately leading to cell lysis. As a result, as the infection time increases, the number of apoptotic and/or dead cells increases, leading to a nonspecific uptake of the DNA aptamers inside the infected cells. Since the rationale underlying infected cell SELEX is to isolate aptamers that recognize unique cell-surface markers expressed only on the infected cells, non-specific uptake of aptamers is counterproductive. To exploit the changes caused by the expression of viral proteins on the surface of infected cells, the time for SELEX was optimized at 15 hrs post-infection (hpi).
For each round of SELEX, the target HeLa cells were maintained at a steady state and infected using a VV strain expressing GFP to facilitate monitoring of the infection by flow cytometery. Twenty nmol of the random aptamer ssDNA library was incubated with VV-infected HeLa cells for the initial round of SELEX. For later rounds, DNA concentration was fixed at 100pmol for incubation with target cells. After five rounds of SELEX with infected cells, a counter selection was performed using uninfected cells after every positive selection with infected cells to minimize non-specific binding of aptamers to uninfected cell surfaces. Flow cytometry was employed to monitor the enrichment and specificity of fluorescently labeled aptamer pools obtained by using a Cy-5-labeled primer for PCR after each round of SELEX, while the percent of infected cells was monitored using the GFP channel on the flow cytometer. After 12 rounds of selection, signal enhancement reached a plateau (Supplementary Figure S2). The highly enriched pools after 12, 14 and 20 rounds were cloned using a TOPO TA cloning kit and were sequenced as described in the methods section. An enrichment pattern was evident as potential aptamer candidates began to dominate the pools from the increase in its number of duplicate clones (reflected as homology in alignment, Supplementary Figure S3) from SELEX rounds 12 to 20 (Table 1).
TABLE. 1.
Sequences of four individual aptamers selected by SELEX using VV-infected HeLa cells as the target. Also shown are the Kds of the individual aptamers. The evolution of aptamers is represented by a decrease in sequence diversity. The proportion of the potential aptamer candidate (depicted as percentage) increases in the selected pool as SELEX progresses
| Name (No. of bases) | Aptamer Sequence | Kd nM | Evolution of Aptamers from SELEX rounds | |||
|---|---|---|---|---|---|---|
| 12 % | 14 % | 17 % | 20 % | |||
| PP2 (72) | ATCCAGAGTGACGCAGCA | 122.63 ± 17.13 | 16.4 | 20.3 | 28.4 | 32.2 |
| CACCGTTTGTATTCTGCATTGTTTTGCATTCTACA | ||||||
| TGGACACGGTGGCTTAGT | ||||||
| PP3 (77) | ATCCAGAGTGACGCAGCA | 3.24 ± 0.63 | 5.3 | 8.8 | 11.8 | 9.0 |
| CGAGCCAGACATCTCACACCTGTTGCATATACATTTTGCA | ||||||
| TGGACACGGTGGCTTAGT | ||||||
| PP4 (75) | ATCCAGAGTGACGCAGCA | 1.45 ± 0.30 | 14.3 | 12.1 | 12.9 | 7.5 |
| TCGACCTCTGTGCGAGCGGGTTGCATATATATTTTGCA | ||||||
| TGGACACGGTGGCTTAGT | ||||||
| PP5 (66) | ATCCAGAGTGACGCAGC | 27.54 ± 3.70 | 0 | 0.7 | 2.1 | 7.8 |
| CACTTGCATATACACTTTGCATTATAGGG | ||||||
| TGGACACGGTGGCTTAGT | ||||||
Red: Primer region Black: Central Core
Characterization of aptamers
Sequences from four different families were further individually tested against different vaccinia-infected cell lines namely, HeLa (Figure 1 (A) and (B), CV1, PK15 and RK13 (Supplementary Figure S4), which, when compared to uninfected cells, showed a shift to the right (compare panels) on a flow cytometer histograms. This strongly suggests that the target of these aptamers is a virus-encoded protein synthesized in a cell-line independent manner. To determine whether these aptamers bind to different, similar or identical targets, a competition experiment was performed. Infected cells were incubated with a 10-fold excess of an unlabeled aptamer PP2, PP3, PP4 or PP5 in the presence of a fluorescently labeled aptamer PP3. To our surprise, we found that all four aptamers competed with each other, showing a decrease in fluorescence signal, reflected by the loss of shift observed on the flow cytometer histogram in the presence of excess unlabeled aptamer. The data suggested that the aptamers bind either to identical targets or targets which are in close physical proximity (Figure 1 (C).
Figure 1.
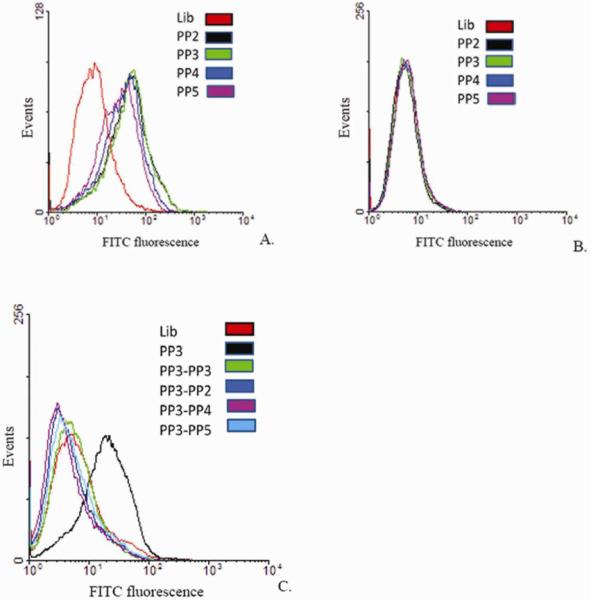
Individual aptamers tested against infected and uninfected cells. (A) VV Infected HeLa cells treated with FITC-labeled aptamers PP2, PP3, PP4 and PP5; (B) Uninfected HeLa cells; (C) Competition experiments with aptamers. Fluorescently labeled Aptamer PP3 in the presence of 10× excess either unlabeled aptamer PP2, PP3, PP4 or PP5.
The apparent Kds of these aptamers were determined using saturation analysis with a flow cytometer (Table 1 and Supplementary Figure S5).
Target Identification
Initally, cells infected with different orthopoxviruses related to VV were examined, because it would be reasonable to expect that the virus protein target should be conserved among most, if not all, of the cell types.
Aptamer PP3 was tested against cells infected with additional orthopoxviruses, including cowpox, vaccinia IHD-J, vaccinia IHD-W and rabbitpox viruses. As a non-orthopoxvirus control, cells infected with myxoma virus were also examined. Unlike VV, myxoma virus belongs to the leporipoxvirus genus of the poxvirus family. These viruses are well studied, and their entire genomes have been sequenced.25–27 Aptamer PP3 recognized cells infected by cowpoxvirus, as well as vaccinia strains WR and IHDJ, but it did not bind cells infected with rabbitpoxvirus, VV IHDW or myxoma viruses (Figure 2). The failure of rabbitpox and VV IHD-W to bind aptamer PP3 was initially unexpected. However, it is known that the WR, IHDJ and cowpox each synthesizes a hemagglutinin (HA, also known as A56R), but the gene is defective and the protein is absent in both IHDW and rabbitpox virus infected cells.28 Myxoma virus, does not encode a hemagglutinin. These results are consistent with HA being the target of the aptamer PP3.
Figure 2.

Aptamer PP3 binds HeLa cells infected with different viruses. HeLa cells infected with Hemagglutinin (HA)-expressing strains such as (A) VV WR (B) VV IHDJ (D) cowpox virus. Non-HA expressing strains (C) VV IHDW; (E) rabbitpox virus and (F) myxoma, a leporipoxvirus.
To confirm HA as the aptamer target, we conducted a proximity-based assay known as AlphaScreen™. “Alpha” stands for amplified luminescent proximity homogenous assay. It is a non-radioactive, bead-based assay which is designed to study biomolecular interactions.29, 30 When a donor bead is excited with a laser at 680nm, ambient oxygen is converted into singlet oxygen with a lifetime of ~4μs that diffuses ~200nm in solution and reaches the acceptor bead in the presence of a biological interaction which brings the beads together. Chemical energy is then transferred from singlet oxygen to thioxene derivates within the acceptor beads which leads to light generation at 520–620nm.
Hemagglutinin in vaccinia is closely associated with at least one other virus-encoded protein, SPI-3, which is a serpin. HA and SPI-3 colocalize on both the infected cell membrane surface and the extracellular, enveloped form (EEV) of the virus. As previously shown, correct localization of SPI-3 on plasma membrane requires HA,31 and HA is necessary to retain SPI-3 on the surface of infected cells. HA and SPI-3 interact and prevent cell fusion. The biological significance of cell-cell fusion following infection is unclear.31 Therefore, the results discussed so far would also be consistent with SPI-3 as the aptamer target. An AlphaScreen™ based assay was therefore performed by overexpressing myc-His-tagged HA, SPI-3 and a third viral protein, B5 which is expressed on the surface of infected cells, but has not been reported to colocalize with HA.32 Total cell lysates were used for AlphaScreen™ and a preliminary Western blot was performed to compare the expressed myc-His-tagged proteins using anti-His antibody (data not shown). The results in figure 3 (A) show a signal only for the myc-tagged HA protein, further suggesting HA as the target of aptamer PP3. The data presented thus far are consistent with the aptamer target being the HA protein. However, any of the ancillary proteins dependent on HA for cell surface trafficking would also give the same pattern of aptamer recognition with the orthopoxviruses we examined as absence of the HA would prevent such proteins from reaching the cell surface because the aptamers were generated against cell surface proteins. To provide further evidence that HA is the target of aptamer PP3; an experiment was performed using BSR T7 cells which express T7 RNA polymerase constitutively. These cells were infected with rabbitpox virus and transfected with plasmids containing either tagged VV SPI-3 or VV HA under the control of T7 promoter.33 Samples for this experiment, use the entire cell extract and hence provide a complete virus protein background except for the HA protein. No signal was observed for SPI-3 overexpressing RPV-infected BSR T7 cells, thus eliminating SPI-3 and other proteins from the entry fusion complex that interacts directly with the SPI-3-HA multimer34, 35. Only the tagged HA sample showed a signal with aptamer PP3 (Figure 3 B.), further suggesting HA as the target of aptamer PP3.
Figure 3.

AlphaScreen™ confirms Hemagglutinin (HA) as the target. (A). CV 1 cell lysates infected with VV T7 and overexpressing myc-His-tagged proteins GFP (control), SPI-3, HA and B5 were probed using biotinylated aptamer PP3 and a control DNA library. The control DNA library did not show a signal for any sample. (B) AlphaScreen™ with cell lysates from BSR T7 cells, which express T7 RNA polymerase infected with RPV at moi = 5.0, transfected with plasmids to overexpress myc-His-tagged VV HA and SPI-3. RPV-infected only cells and SPI-3 samples show a nonspecific background signal with aptamer PP3 and DNA library
Frequently, cell-surface proteins are further modified by lipids or carbohydrates. It is possible, therefore, that the aptamer recognizes the associated sugars or lipids instead of recognizing the HA protein. HA is a non-essential glycoprotein synthesized throughout the infection, expressed on surface of infected cell and EEV. Deletion of HA attenuates VV WR. Two forms of HA (an 85 and a 68 kDa) protein are produced during VV infection, due in part to differences in glycosylation patterns.36, 37 To investigate if the glycosylation process is important in aptamer-target interactions, infected CV-1 cells were incubated with aptamer PP3 in the presence of glycosylation inhibitors. Tunicamycin is an antibiotic that inhibits the synthesis of all N-linked glycoproteins. Similarly, monensin is an antibacterial compound that stops the synthesis of O-linked glycosylation.36, 38 These antibiotics affect the transport of protein to the cell surface, and substantial amounts of protein remain in the cytoplasm. VV-infected cell recognition by aptamer PP3 was affected when the cells were infected in the presence of 5μg/mL tunicamycin or monensin. While infected cells are clearly recognized by aptamer PP3, as shown in Figure 4 (A), only a small signal can be observed in the presence of the glycosylation inhibitors tunicamycin (Figure 4 (B) or monensin (Figure 4 (C). The loss of shift in the histograms could result from poor trafficking of unglycosylated HA to the membrane or it could mean that target recognition is associated with sugar residues and not with the HA protein. To further explore the role of glycosylation pattern in the recognition of infected cells with aptamer PP3, the AlphaScreen assay was conducted with total cell lysates from VV infected CV-1 cells in the presence and absence of tunicamycin or monensin. A reduced AlphaScreen signal was observed for cells infected in the presence of tunicamycin and monensin (Figure 4 (D). This assay ruled out the possibility that the smaller shift in flow cytometry experiments was caused solely by reduced localization of the HA protein on the infected cell surface, implying that the glycosylation pattern of HA plays a role in aptamer recognition.
Figure 4.

Aptamers recognize glycosylated protein HA encoded by VV. (A) VV WR infected untreated cells (B) VV WR infected cells in the presence of 5μg/mL tunicamycin (C) VV WR infected cells in the presence of 5μg/mL monensin. (D) The interaction between myc-His-tagged HA and the aptamer is reduced in the presence of glycosylation inhibitors. CV-1 cells infected in the presence of 5μg/mL tunicamycin or monensin that are N-linked and O-linked glycosylation inhibitors, respectively.
Application of aptamers
Aptamers have been used in various applications, especially diagnostics and therapeutics.39–41 Figure 5 shows the detection of glycosylated HA expressed on the surface of infected cells with fluorescence microscope using Alexa Fluor 594-labeled aptamer PP3. To explore the feasibility of aptamer recognition in biological samples aptamer PP3 was tested in complex biological buffers. Aptamer PP3 recognized its target in increasingly complex media containing fetal bovine serum, human plasma, rabbit serum and rabbit blood (Figure 6).
Figure 5.

Detection of infection using fluorescence microscopy (A) Aptamer PP3 binding on the surface of infected cells; (B) Phase contrast image; (C) DNA library control treated infected cells; (D) Phase contrast image; (E) Aptamer PP3 treated uninfected HeLa cells. (F) Phase contrast image; (G) DNA library treated uninfected cells; (H) Phase contrast image.
Figure 6.

Aptamers can recognize their target in complex biological media (A) 15% fetal bovine serum; (B) 15 % rabbit serum; (C) 50% human plasma, and (D) Rabbit whole blood spiked with VV WR-infected HeLa cells.
The effect of the aptamer on virus spread was examined42,43, 44 Virus spread can be by either intracellular or extracellular virus. These different infectious forms of VV play different roles in the spread of infection.45, 46 We asked whether the binding of aptamer PP3 to infected cells might inhibit virus spread. The cell-to-cell spread of VV was tested using an extracellular luminescence-based assay. CV1 cells were infected with VV luciferase at different multiplicities of infection (moi) = 10, 1, 0.1, 0.01 and 10 plaque forming units (pfu). The amount of luminescence, which reflects the amount of virus in each sample, was measured on a microplate reader in the presence and absence of 1μM aptamer PP3. Figure 7 shows luminescence data for CV-1 cells infected at 10pfu at 50 hrs post infection (hpi). The presence of DNA affected luciferase production nonspecifically, and only a negligible effect of aptamer PP3 was observed at 50hpi, indicating that PP3 had no effect on the cell-to-cell spread of virus.
Figure 7.
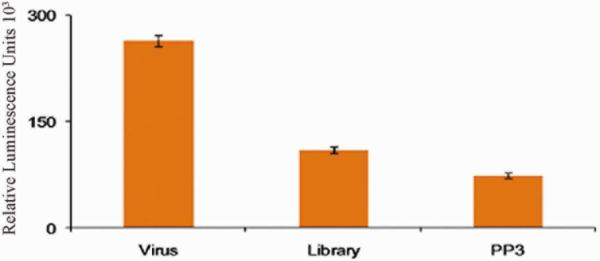
Effect of 1μM aptamer PP3 on cell-to-cell spread of VV infection was measured with CV1 cells infected with 10pfu VV luciferase at 50hpi.
Conclusions
Using the SELEX technology, we isolated aptamers which recognize VV-infected cell surface proteins with high selectivity and affinity. Through the use of different viruses and biochemical assays, it was determined that one of the primary aptamer targets was the virus-encoded hemagglutinin protein, which is known to be on the cell surface during infection. Cell-surface HA is known to be glycosylated. Inhibition of glycosylation abrogates aptamer recognition, suggesting that glycosylation is involved in creating the aptamer binding site.
Surprisingly, five independently isolated aptamers all recognized the HA protein, indicating a clear propensity for certain proteins. The reason for the propensity to isolate HA aptamers is not clear, as there are other, more abundant extracellular viral proteins present at the cell surface, and HA is not required for virus growth in cell culture.
Attempts to isolate aptamers by the procedure described using vaccinia infected cells lacking the HA gene, selected aptamers which do not compete with the aptamers described here, indicating that aptamers to other virus surface proteins await identification (unpublished results). We can conclude that molecular level probing of the differences between healthy and infected cells with cell-SELEX can reveal new information about the changes which occur at the cell surface during the process of infection. As a consequence, infected cell-SELEX can be used to extract a map of these changes. In summary, the methods we describe allow the isolation of aptamers directed against virus-encoded surface proteins. These procedures can now be exploited to generate additional aptamers for use as diagnostics and this strategy can also be applied to detect the subtle differences in expression of viral proteins from various sub-types of a virus. We also anticipate that some of these aptamers will inhibit virus infection. Inhibitory aptamers would not only serve as diagnostic tools, but as potent antiviral agents, hence allowing therapeutic applications for the control of viral infections.
Supplementary Material
ACKNOWLEDGMENTS
This work was supported by NIH GM079359, GM06613 and NIH-SERCEB 1-U54-AI-057157 grant. The funding organizations played no role in the design of study, collection, analysis and interpretation of data or preparation or approval of the paper for publication. We thank Dr.Grant McFadden for access to Alphascreen™ Envision reader. We are grateful to Jeff Browning and Kwame Sefah for help on this work and Dr.Kathryn Williams for help with the manuscript.
Footnotes
SUPPORTING INFORMATION PARAGRAPH Appendix A Supplementary Data Additional information as noted in the text
REFERENCES
- (1).World Health Organization, W. Primary Health Care now more than ever. World Health Organization Press; Geneva: 2008. [Google Scholar]
- (2).Patterson KD, Pyle GF. Bulletin of the History of Medicine. 1991;65:4–21. [PubMed] [Google Scholar]
- (3).Hopkins Donald R. The Greatest Killer: Smallpox in History. University of Chicago Press; Chicago: 2002. [Google Scholar]
- (4).Riedel S. BUMC Proceedings. 2004;17:400–406. doi: 10.1080/08998280.2004.11928002. [DOI] [PMC free article] [PubMed] [Google Scholar]
- (5).Cleri Dennis J., R. B. P., Ricketti Anthony J., Ramos-Bonner Luz S., Vernaleo John R. Infect Dis Clin North Am. 2006;20:329–357. doi: 10.1016/j.idc.2006.03.005. [DOI] [PubMed] [Google Scholar]
- (6).Riedel S. Proc (Bayl Univ Med Cent) 2005;18 doi: 10.1080/08998280.2005.11928026. [DOI] [PMC free article] [PubMed] [Google Scholar]
- (7).Lazcka O, Campo FJD, Muñoz FX. Biosensors and Bioelectronics. 2007;22:1205–1217. doi: 10.1016/j.bios.2006.06.036. [DOI] [PubMed] [Google Scholar]
- (8).Ropp S, Jin Q, Knight J, Massung R, Esposito J. J. Clin. Microbiol. 1995;33:2069–2076. doi: 10.1128/jcm.33.8.2069-2076.1995. [DOI] [PMC free article] [PubMed] [Google Scholar]
- (9).Putkuri N, Piiparinen H, Vaheri A, Vapalahti O. Journal of Medical Virology. 2009;81:146–152. doi: 10.1002/jmv.21385. [DOI] [PubMed] [Google Scholar]
- (10).Jayasena SD. Clinical Chemistry. 1999;45:1628–1650. [PubMed] [Google Scholar]
- (11).Hermann T, Patel DJ. Science. 2000;287:820–825. doi: 10.1126/science.287.5454.820. [DOI] [PubMed] [Google Scholar]
- (12).Wrzesinski J, Ciesiolka J. Biochemistry. 2005;44:6257–6268. doi: 10.1021/bi047397u. [DOI] [PubMed] [Google Scholar]
- (13).Lorsch JR, Szostak JW. Biochemistry. 1994;33:973–982. doi: 10.1021/bi00170a016. [DOI] [PubMed] [Google Scholar]
- (14).Famulok M. Current Opinion in Structural Biology. 1999;9:324–329. doi: 10.1016/S0959-440X(99)80043-8. [DOI] [PubMed] [Google Scholar]
- (15).Weiss S, Proske D, Neumann M, Groschup M, Kretzschmar H, Famulok M, Winnacker E. J. Virol. 1997;71:8790–8797. doi: 10.1128/jvi.71.11.8790-8797.1997. [DOI] [PMC free article] [PubMed] [Google Scholar]
- (16).Bock LC, Griffin LC, Latham JA, Vermaas EH, Toole JJ. Nature. 1992;355:564–566. doi: 10.1038/355564a0. [DOI] [PubMed] [Google Scholar]
- (17).Shangguan DH, Meng L, Cao ZHC, Xiao ZY, Fang XH, Li Y, Cardona D, Witek RP, Liu C, Tan WH. Analytical Chemistry. 2008;80:721–728. doi: 10.1021/ac701962v. [DOI] [PubMed] [Google Scholar]
- (18).Tang JJ, Xie JW, Shao NS, Yan Y. Electrophoresis. 2006;27:1303–1311. doi: 10.1002/elps.200500489. [DOI] [PubMed] [Google Scholar]
- (19).Javaherian S, Musheev MU, Kanoatov M, Berezovski MV, Krylov SN. Nucl. Acids Res. 2009;37:e62. doi: 10.1093/nar/gkp176. [DOI] [PMC free article] [PubMed] [Google Scholar]
- (20).Ellington AD, Szostak JW. 1990;346:818–822. doi: 10.1038/346818a0. [DOI] [PubMed] [Google Scholar]
- (21).Tuerk C, Gold L. Science. 1990;249:505–510. doi: 10.1126/science.2200121. [DOI] [PubMed] [Google Scholar]
- (22).Mallikaratchy P, Tang ZW, Kwame S, Meng L, Shangguan DH, Tan WH. Molecular & Cellular Proteomics. 2007;6:2230–2238. doi: 10.1074/mcp.M700026-MCP200. [DOI] [PubMed] [Google Scholar]; Shangguan S, Cao Z, Meng L, Mallikaratchy P, Sefah K, Wang Hui, Li Ying, Tan Weihong. Journal of Proteome Research. 2008;7:2133–2139. doi: 10.1021/pr700894d. [DOI] [PMC free article] [PubMed] [Google Scholar]
- (23).Nitsche A, Kurth A, Dunkhorst A, Panke O, Sielaff H, Junge W, Muth D, Scheller F, Stocklein W, Dahmen C, Pauli G, Kage A. BMC Biotechnology. 2007;7:48. doi: 10.1186/1472-6750-7-48. [DOI] [PMC free article] [PubMed] [Google Scholar]
- (24).Tang Z, Parekh P, Turner P, Moyer RW, Tan W. Clin Chem. 2009;55:813–822. doi: 10.1373/clinchem.2008.113514. [DOI] [PMC free article] [PubMed] [Google Scholar]
- (25).Li G, Chen N, Roper RL, Feng Z, Hunter A, Danila M, Lefkowitz EJ, Buller RML, Upton C. J Gen Virol. 2005;86:2969–2977. doi: 10.1099/vir.0.81331-0. [DOI] [PubMed] [Google Scholar]
- (26).Johnson GP, Goebel SJ, Paoletti E. Virology. 1993;196:381–401. doi: 10.1006/viro.1993.1494. [DOI] [PubMed] [Google Scholar]
- (27).Mackett M, Archard LC. J Gen Virol. 1979;45:683–701. doi: 10.1099/0022-1317-45-3-683. [DOI] [PubMed] [Google Scholar]
- (28).Brown CK, Bloom DC, Moyer RW. Virus Genes. 1991;5:235–242. doi: 10.1007/BF00568973. [DOI] [PubMed] [Google Scholar]
- (29).Beaudet L, Bédard J, Breton B, Mercuri RJ, Budarf ML. Genome Research. 2001;11:600–608. doi: 10.1101/gr.1725501. [DOI] [PMC free article] [PubMed] [Google Scholar]
- (30).Patel R, Pollner R, de Keczer S, Pease J, Pirio M, DeChene N, Dafforn A, Rose S. Clin Chem. 2000;46:1471–1477. [PubMed] [Google Scholar]
- (31).Brum LM, Turner PC, Devick H, Baquero MT, Moyer RW. Virology. 2003;306:289–302. doi: 10.1016/s0042-6822(02)00017-x. [DOI] [PubMed] [Google Scholar]
- (32).Mathew EC, Sanderson CM, Hollinshead R, Smith GL. Journal of General Virology. 2001;82:1199–1213. doi: 10.1099/0022-1317-82-5-1199. [DOI] [PubMed] [Google Scholar]
- (33).Buchholz UJ, Finke S, Conzelmann K-K. J. Virol. 1999;73:251–259. doi: 10.1128/jvi.73.1.251-259.1999. [DOI] [PMC free article] [PubMed] [Google Scholar]
- (34).Wagenaar TR, Moss B. J. Virol. 2007;81:6286–6293. doi: 10.1128/JVI.00274-07. [DOI] [PMC free article] [PubMed] [Google Scholar]
- (35).Wagenaar TR, Ojeda S, Moss B. J. Virol. 2008;82:5153–5160. doi: 10.1128/JVI.00162-08. [DOI] [PMC free article] [PubMed] [Google Scholar]
- (36).Brown CK, Turner PC, Moyer RW. Journal of Virology. 1991;65:3598–3606. doi: 10.1128/jvi.65.7.3598-3606.1991. [DOI] [PMC free article] [PubMed] [Google Scholar]
- (37).Shida H, Matsumoto S. Cell. 1983;33:423–434. doi: 10.1016/0092-8674(83)90424-5. [DOI] [PubMed] [Google Scholar]
- (38).Shida H. Molecular and Cellular Biology. 1986;6:3734–3745. doi: 10.1128/mcb.6.11.3734. [DOI] [PMC free article] [PubMed] [Google Scholar]
- (39).Parekh P, Martin J, Chen Y, Colon D, Wang H, Tan WH. Protein - Protein Interaction. 2008;110:177–194. doi: 10.1007/10_2008_104. [DOI] [PubMed] [Google Scholar]
- (40).Torres-Chavolla E, Alocilja EC. Biosensors and Bioelectronics. 2009;24:3175–3182. doi: 10.1016/j.bios.2008.11.010. [DOI] [PMC free article] [PubMed] [Google Scholar]
- (41).Sefah K, Phillips JA, Xiong X, Meng L, Simaeys DV, Chen H, Martin J, Tan W. The Analyst. 2009;134:1765–1775. doi: 10.1039/b905609m. [DOI] [PubMed] [Google Scholar]
- (42).James W. Journal of General Virology. 2007;88:351–364. doi: 10.1099/vir.0.82442-0. [DOI] [PubMed] [Google Scholar]
- (43).Yamamoto Rika, Katahira Masato, Nishikawa Satoshi, Baba Tadashi, Taira Kazunari, Kumar Penmetcha K. R. Genes to Cells. 2000;5:371–388. doi: 10.1046/j.1365-2443.2000.00330.x. [DOI] [PubMed] [Google Scholar]
- (44).Gopinath SCB, Misono TS, Kawasaki K, Mizuno T, Imai M, Odagiri T, Kumar PKR. J Gen Virol. 2006;87:479–487. doi: 10.1099/vir.0.81508-0. [DOI] [PubMed] [Google Scholar]
- (45).Blasco R, Moss B. J. Virol. 1992;66:4170–4179. doi: 10.1128/jvi.66.7.4170-4179.1992. [DOI] [PMC free article] [PubMed] [Google Scholar]
- (46).Blasco R, Moss B. J. Virol. 1991;65:5910–5920. doi: 10.1128/jvi.65.11.5910-5920.1991. [DOI] [PMC free article] [PubMed] [Google Scholar]
Associated Data
This section collects any data citations, data availability statements, or supplementary materials included in this article.