Abstract
Purpose
To quantify daily variations in the anatomy of patients undergoing radiation therapy for prostate carcinoma, to estimate their effect on dose distribution, and to evaluate the effectiveness of current standard planning and set-up approaches employed in proton therapy.
Methods
We used series of CT data, which included the pre-treatment scan, and between 21 and 43 in-room scans acquired on different treatment days, from 10 patients treated with intensity-modulated radiation therapy at Morristown Memorial Hospital. Variations in femur rotation angles, thickness of subcutaneous adipose tissue, and physical depth to the distal surface of the prostate for lateral beam arrangement were recorded. Proton dose distributions were planned with the standard approach. Daily variations in the location of the prescription iso-dose were evaluated.
Results
In all 10 datasets, substantial variation was observed in the lateral tissue thickness (standard deviation of 1.7–3.6 mm for individual patients, variations of over 5 mm from the planning CT observed in all series), and femur rotation angle (standard deviation between 1.3–4.8°, with the maximum excursion exceeding 10° in 6 out of 10 datasets). Shifts in the position of treated volume (98% iso-dose) were correlated with the variations in the lateral tissue thickness.
Conclusions
Analysis suggests that, combined with image-guided set-up verification, the range compensator expansion technique prevents loss of dose to target due to femur rotation and soft tissue deformation, in the majority of cases. Anatomic changes coupled with the uncertainties of particle penetration in tissue restrict possibilities for margin reduction in proton therapy of prostate cancer.
Keywords: prostate cancer, 3D-conformal proton therapy, treatment set-up, interfractional motion, serial CT scans
INTRODUCTION
Prostate carcinoma patients represent a growing share of proton therapy recipients worldwide, and constitute the majority of treatments at some proton therapy centers. However, concerns persist about many uncertainties associated with delivery of therapeutic dose to such deep-seated, mobile targets, in close proximity to sensitive critical organs. Variations in daily set-up have been widely reported, and their effect on target coverage has been evaluated in studies, which simulated translational [1,2] and rotational errors [3].
To ensure complete irradiation of the target volume, liberal planning margins are typically used, along with expanded spread-out peak modulation, and modification of the range compensator for possible misalignment of tissue heterogeneities [1,4]. All of these measures lead to increased dose to healthy surrounding organs. As a result, while protons offer potential advantages in dose conformation, currently there is little clinical evidence of proton’s superiority over other radiation therapy modalities, such as IMRT and brachytherapy. A reduction of the planning margins in proton therapy may allow for better dose conformation, and potential reduction of treatment toxicity. Refinements in prostate immobilization and localization techniques are, thus, essential.
Although various techniques are applied to achieve prostate localization, including ultrasound [4], in-room-CT fusion [1], and radiography with fiducial markers [2], their relative advantages are not currently well established. Discrepancies have been reported between corrections based on various methods [5]. Serial computed tomography (CT), and target motion models have been used to study interfractional changes, and to refine IMRT set-up and planning procedures [6]. Serial CT scans also provide the data, which allow one to model and parametrize variations in patient’s set-up and anatomy. Such models can be used to reduce the sensitivity of proton therapy delivery to uncertainties [7].
In this study, we use serial CT data to investigate the distortions in delivered dose distributions due to daily variations in patient anatomy and immobilization, to evaluate the effectiveness of current planning and set-up approaches employed at the Massachusetts General Hospital (MGH) proton center, and to develop recommendations for improved management of uncertainties. Intrafractional motion is not considered in this study, and it is assumed that stable and reproducible set-up can be achieved, and intrafractional position drifts and spontaneous, transient motion of prostate (see, e.g., [8]) can be minimized with the use of rectal balloons and similar immobilization devices.
METHODS
Data selection
At MGH, patients do not routinely undergo serial CT scanning during the course of proton therapy. The data sets for this study were requested from colleagues at Morristown Memorial Hospital (MMH, Morristown, NJ). After approval by the respective MGH and MMH Investigational Review Boards, ten patients were randomly selected from the MMH database.
Selected patients presented with stage T1 (N=7) or T2 (N=3) disease, and were treated with intensity-modulated radiation therapy (IMRT) to 77.4 Gy in 43 fractions. The median prostate gland volume was 38 ml. Body-mass index (BMI) was calculated as the weight in kilograms, divided by the height squared (in m2). Staging, prostate volume and BMI data are summarized in Table 1. Five of the 10 patients had BMI over 30, classified as obese according to the World Health Organization definition.
Table 1.
Prostate cancer staging, gross tumor volumes, body-mass indeces, and the number of CT scans acquired during fractionated treatment of 10 selected patients.
| Case | Stage | GTV Volume [ml] | Body-mass index [kg/m2] | Number of in- room CT scans |
|---|---|---|---|---|
| 1 | T1cN0M0 | 24.0 | 33.4 | 43 |
| 2 | T1cN0M0 | 114.5 | 52.8 | 21 |
| 3 | T1cN0M0 | 18.2 | 34.8 | 43 |
| 4 | T1cN0M0 | 24.4 | 38.8 | 43 |
| 5 | T2N0M0 | 44.0 | 25.8 | 43 |
| 6 | T1cN0M0 | 96.2 | 28.4 | 41 |
| 7 | T1cN0M0 | 62.4 | 22.8 | 42 |
| 8 | T2cN0M0 | 19.3 | 25.1 | 43 |
| 9 | T2bN0M0 | 34.3 | 44.4 | 41 |
| 10 | T1cN0M0 | 41.5 | 26.7 | 29 |
Abbreviations: CT = computed tomography, GTV= Gross tumor volume (prostate)
CT scanning was performed at MMH with the resolution of 1.27 mm in the axial planes for Patient 2, and between 0.95 and 0.98 mm for the other nine patients. Slice thickness was 5 mm for all scans. Each series consisted of a pre-treatment CT scan, and between 21 and 43 scans acquired on different days throughout the course of treatment with a CT-on-rails scanner (Primatom, Siemens Medical Solutions, Concord, CA).
Patient immobilization and treatment set-up
All patients were treated at MMH in supine position with their legs extended straight. To minimize rotational variation in the hip joints, leg rest cushions with grooves are placed under the patient’s knees, and toe straps are used to keep the patient's feet together. A similar procedure is followed at MGH. Both institutions employ lateral and abdominal skin surface marks for the initial alignment of the patient on the treatment couch.
For final treatment set-up, MMH uses fusion of in-room and planning CT to calculate the translational adjustments in the couch position [6]. At MGH proton center, couch corrections are calculated based on visual alignment, on daily ultrasound images compared to the pre-treatment image, of the prostate-bladder and prostate-rectal interface. Orthogonal X-ray images are used for confirmation of bony anatomy position, and to ensure that relative displacement is within the allowance (smearing radius), provided by the range compensator expansion [4].
Data preparation
A radiation oncologist outlined the entire prostate, the most caudal 1-cm section of the seminal vesicles, the entire rectal wall between the junction of sigmoid colon and the anus, urinary bladder, and femoral heads. For proton patients at MGH, the prostate gland is considered the gross tumor volume (GTV), and the clinical target volume (CTV) includes the whole prostate and caudal seminal vesicles. To account for intrafractional motion, planning target volumes, PTV1 and PTV2 are defined as 5-mm uniform expansions around the CTV and the GTV, respectively. Proton patients typically receive 50 Gy (biologically equivalent dose) to PTV1 in 2-Gy fractions, followed with 28 Gy to PTV2, to total of 78 Gy in 39 fractions.
In treatment plan, at least 98% of the PTV should receive full dose, and the minimum dose should be greater than 98% of prescription. Required proton beam range and modulation of spread-out Bragg peak (SOBP) are selected based on the PTV depth and thickness. Due to the uncertainties in the proton penetration in tissue, range is further increased by 3.5%, and modulation is increased accordingly, to create distal and proximal margins. To maintain dose coverage of the distal edge of PTV despite the daily variations in patient set-up, and alignment of tissue heterogeneities with the target position, the range compensator is expanded with a 10-mm smear radius [4]. The beam aperture is expanded by 10 mm from the beam’s-eye-view projection of the PTV, to account for penumbra broadening, and to ensure lateral coverage of the PTV.
Quantification of interfractional set-up and anatomical variations
Variations in the femur set-up angle, the thickness of lateral subcutaneous adipose tissue, and physical depth to the distal surface of the prostate for the lateral beam approach were recorded, as illustrated in Figure 1. For each patient, all tissue thickness measurements were performed in equivalent CT slices, from the skin surface at the iso-center level. The femur rotation angle was defined as the angle between the horizontal plane and the flat section of anterior surface of the femoral neck, at the level roughly 1 cm below the superior surface of the collum femoris.
Figure 1.
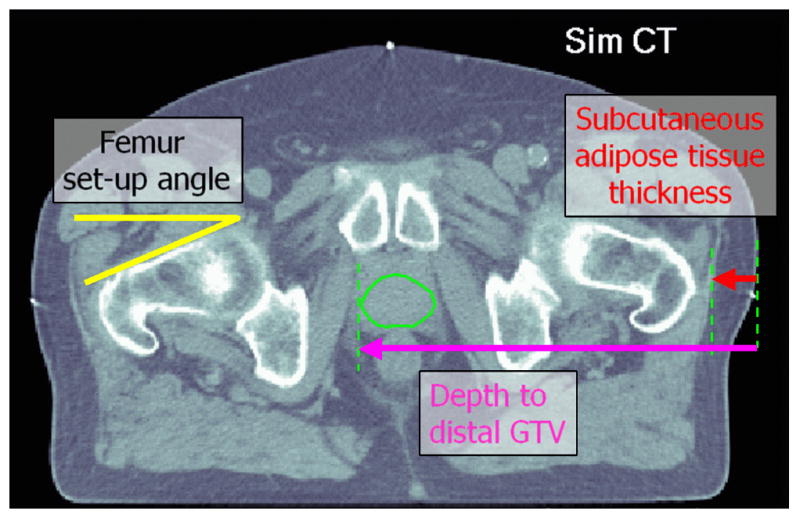
Parameters estimated from serial CT data (Patient 5). All distances were measured from the skin surface at the iso-center level. The femur angles were measured 1 cm below the superior surface of the collum femoris.
Measurements were performed using the public-domain software ImageJ (National Institutes of Health, Japan, http://rsbweb.nih.gov/ij/). For linear measurements, the error was estimated as the sum, in quadratures, of the 1-pixel uncertainties in the position of the start and end point of the vector (i.e., 1.4 times the pixel size). The uncertainty in the measurement point is due to imperfect alignment of CT sets, and the limited resolution of CT. For the femur rotation angle, several measurements were performed, and averaged for each data point, to reduce the observer error and evaluate the uncertainties. The uncertainty was estimated to be 1.1 degrees per millimeter of the CT pixel size.
Planning and estimation of dose distribution delivered per fraction
Plan design and dose calculation were performed with a Matlab (MathWorks, Natick, MA) application written specifically for this study, which allowed automated data upload and reapplication of treatment plan to various CT scans from the series. The software replicated the standard procedures for selection of the proton range and modulation width, and the compensator design used at the MGH proton center. Proton depth doses and penumbra data, measured at the MGH were used for simplified dose calculation based on the pencil beam algorithm. Dose calculation was compared to XiO (CMS, St. Louis, MO) software, used for clinical proton treatment planning. Disagreements were found mainly in the lateral penumbra, due to the simplified treatment of aperture edge effects in the Matlab simulation. The agreement within PTV and in distal penumbra was good, within the tolerance of either 3% of dose, or 2 mm distance to agreement.
Pre-treatment (simulation) CT sets were used for planning of the dose distribution for PTV2, the volume that receives full prescription dose of 78 Gy. For this study, planned dose distributions were designed without distal and proximal margins, as the CT conversion to stopping powers is not investigated here, and the uncertainties were assumed to affect all CT sets similarly (i.e., scanner calibration is constant). Given the parameters of planned treatment beams (range, SOBP modulation, aperture, compensator and beam fluence), daily CT sets were used to estimate the dose, which the treatment plan would deliver in the presence of variations in set-up and anatomy. Field set-up approximated the ultrasound-based approach used at MGH, and was performed by manually aligning the prostate contour from simulation CT with the daily treatment-room CT, and emphasizing the match to the bladder-prostate and rectum-prostate interfaces. Daily variations in the shape and position of the treated volume, encompassed by the target coverage iso-dose (98% of prescription dose [9]) were then evaluated.
Position of the coverage iso-dose contour in the transversal slice containing the iso-center was compared between different fractions, and its mean deviation from the planned iso-dose was evaluated. Local deviation of the iso-dose due to interfractional variations was calculated as the standard deviation of the iso-dose locations in different simulated treatment fractions. The 65% and 95% confidence intervals of the iso-dose position were estimated, respectively, as 1- and 2-standard-deviation bands around the mean iso-dose position. With 41–43 test CT sets in most series used here, it is expected that, on average, two contours would shift outside of the 95% confidence bands.
Mean values of the shift in the iso-dose curve positions were analyzed for correlation with the physical parameters of the instances of anatomy captured by serial CT, such as the femur rotation, tissue thickness in transit to the target. Covariance matrices, correlation coefficients, and the p-values of the probability of observing the correlation by random chance were calculated in Matlab, using standard function libraries. A correlation was considered to be significant if the p-value was below 0.05.
RESULTS
Tissue set-up and anatomical variations
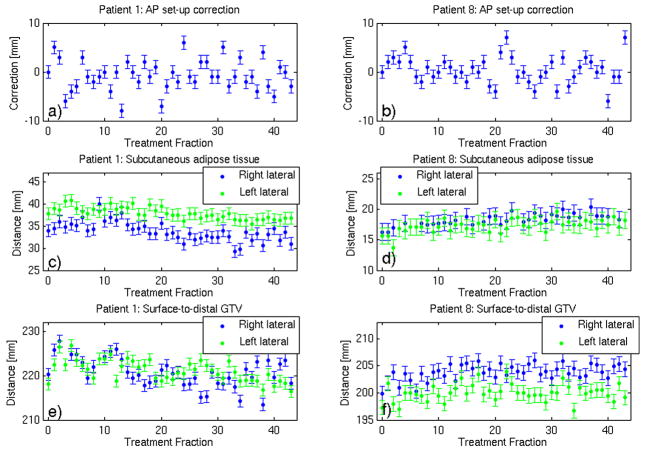
Figures 2 shows calculated anteroposterior set-up adjustments (from external marker-based to CT-based set-up), and variation, throughout the course of treatment, in the lateral subcutaneous adipose tissue thickness (ATT), and depth to the distal tumor volume surface (D2DT), for Patients 1 and 8. Although variations are dominated by the measurement uncertainties, systematic trends are detectable. E.g. for Patient 1 (Figure 2(c,e)) the mean ATT and D2DT values for the first half of the course are statistically significantly higher than for the second half. I.e., in fractions 1–21 vs. 22–43, respectively, mean ATT was 35.3±0.5 vs 32.2±0.4 mm (right side), 38.9±0.4 vs. 36.8±0.5 (left), and D2DT was 222.2±0.7 vs 219.0±0.7 mm (right), 222.2±0.6 vs. 220.0±0.5 (left).
Figure 2.
Variation, with the treatment fraction, in (a,b) anteroposterior set-up correction (c,d) the thickness of lateral subcutaneous adipose tissue, and (e,f) depth to the distal surface of the prostate, respectively, for Patients 1 and 8. “Fraction 0” designates planning CT.
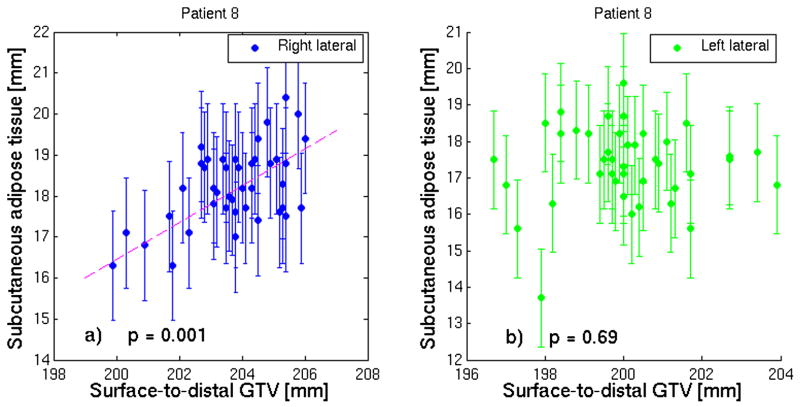
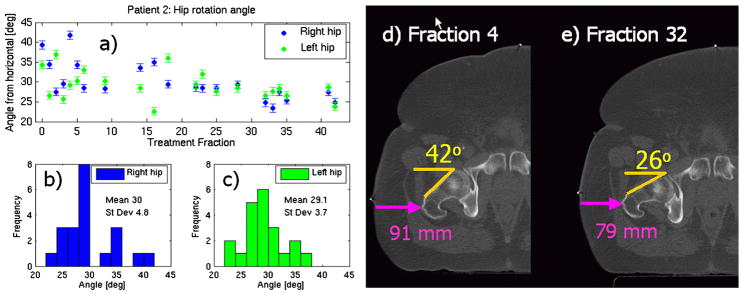
Since ATT is included within the total D2DT, a certain degree of correlation between the two is to be expected. However, as shown in Figure 3, this correlation is not always significant, due to other factors contributing to the D2DT. Figure 4 illustrates daily variation of the femur set-up angle, and its distributions for the right and left femora for Patient 2. Neither ATT nor D2DT or femur angle are correlated to set-up adjustments.
Figure 3.
Correlation between the thickness of subcutaneous adipose tissue and the surface-to-distal-GTV distance, for patient 8, for (a) right and (b) left lateral approach.. The correlation is significant (p<0.05) in (a), but not in (b). The fit line is given to guide the eye.
Figure 4.
(a) the daily variation of the femur rotation angle, and its distributions for (b) the right and (c) left femora. The first set of data points (“fraction 0”) is from the planning CT. CT scans (d, e) from treatment fractions show a variation in the femur setup, and the resulting change in the skin contour, and lateral thickness of soft tissue.
The observed variations in the right femur rotation, and ATT for the right lateral approach are summarized in Table 2. The summary of variation in the depth to the distal surface of the GTV (prostate) is given in Table 3. In all 10 datasets, substantial variation was observed in the depth to the distal surface of the prostate: for individual patients, the standard deviation in the depth throughout the treatment course was between 1.7 and 3.6 mm. Deviations of 10 mm or more from the planning CT were observed in individual fractions for all 10 patients. For the femur rotation angle, the standard deviation was between 1.3 and 4.8 degrees for individual patients, and the maximum excursion in the set-up angle exceeded 10 degrees in 6 out of 10 datasets.
Table 2.
Summary of variations in the femur set-up angle, and subcutaneous adipose tissue thickness, observed in CT scans (right side only).
| Case | Right femur rotation angle |
Right lateral adipose tissue thickness |
||||
|---|---|---|---|---|---|---|
| Plan CT [degrees] | In-room CT |
Plan CT [mm] | In-room CT |
|||
| Range: min- max [degrees] | Mean ± standard deviation [degrees] | Range: min- max [mm] | Mean ± standard deviation [mm] | |||
| 1 | 28.4±1.1 | 14.2–25.0 | 21.8 ± 2.3 | 34± 1 | 29–40 | 34 ± 2 |
| 2 | 39.3±1.4 | 23.4–41.8 | 30.0 ± 4.8 | 64± 2 | 56–66 | 61 ± 3 |
| 3 | 27.3±1.1 | 23.5–41.8 | 34.4 ± 4.1 | 25± 1 | 26–31 | 29 ± 1 |
| 4 | 23.4±1.1 | 19.2–25.0 | 22.0 ± 1.6 | 51± 1 | 53–59 | 55 ± 1 |
| 5 | 24.9±1.1 | 18.9–39.5 | 22.6 ± 3.7 | 20± 1 | 19–23 | 21 ± 1 |
| 6 | 23.4±1.1 | 20.0–31.4 | 26.3 ± 2.5 | 18± 1 | 20–24 | 21 ± 1 |
| 7 | 37.3±1.1 | 25.7–38.7 | 32.7 ± 3.5 | 13± 1 | 11–16 | 14 ± 1 |
| 8 | 18.0±1.1 | 14.6–20.9 | 18.4 ± 1.5 | 16± 1 | 16–20 | 18 ± 1 |
| 9 | 10.4±1.1 | 8.9–14.8 | 11.6 ± 1.3 | 38± 1 | 36–41 | 38 ± 1 |
| 10 | 14.3±1.1 | 14.0–19.9 | 17.6 ± 1.7 | 26± 1 | 21–30 | 24 ± 2 |
Abbreviation: CT = computed tomography scan
Table 3.
Variations in the depth to the distal tumor volume surface (D2DT) correlated with variations in position of the distal prescription iso-dose. (The data are for the right lateral beam only). Statistically significant correlations with the D2DT and the femur setup angle are highlighted in bold.
| Case | Plan CT |
In-room CT |
||||||
|---|---|---|---|---|---|---|---|---|
| Proton range [mg/mm2] | SOBP mod [mg/mm2] | D2DT [mm] | D2DT range [mm] | D2DT mean ± standard deviation [mm] | Deviation in the distal iso-dose [mm] | Correlation p-value |
||
| D2DT | Femur angle | |||||||
| 1 | 252 | 74 | 220 ± 1 | 214–228 | 221 ± 3 | −0.4 ± 3.1 | 0.001 | 0.107 |
| 2 | 295 | 88 | 277 ± 2 | 274–290 | 281 ± 4 | 2.1 ± 2.9 | 0.169 | 0.022 |
| 3 | 248 | 65 | 226 ± 1 | 223–231 | 228 ± 2 | 2.3 ± 2.3 | 0.052 | 0.001 |
| 4 | 272 | 80 | 241 ± 1 | 237–254 | 244 ± 3 | 2.5 ± 2.0 | 0.023 | 0.199 |
| 5 | 224 | 64 | 202 ± 1 | 200–208 | 204 ± 2 | 3.0 ± 2.4 | 0.049 | 0.002 |
| 6 | 232 | 80 | 206 ± 1 | 203–212 | 206 ± 2 | 2.7 ± 2.5 | 0.009 | 0.309 |
| 7 | 218 | 92 | 192 ± 1 | 187–195 | 191 ± 2 | −0.4 ± 2.1 | 0.021 | 0.063 |
| 8 | 236 | 86 | 200 ± 1 | 200–206 | 204 ± 1 | −3.4 ± 1.5 | 0.029 | 0.372 |
| 9 | 263 | 75 | 230 ± 1 | 228–236 | 232 ± 2 | −0.7 ± 1.9 | 0.001 | 0.857 |
| 10 | 233 | 76 | 207 ± 1 | 197–208 | 204 ± 2 | 2.8 ± 2.4 | 0.023 | 0.308 |
Abbreviations: CT = computed tomography scan, SOBP = spread-out Bragg peak, D2DT = depth to distal tumor volume surface
Variation in the dose distribution
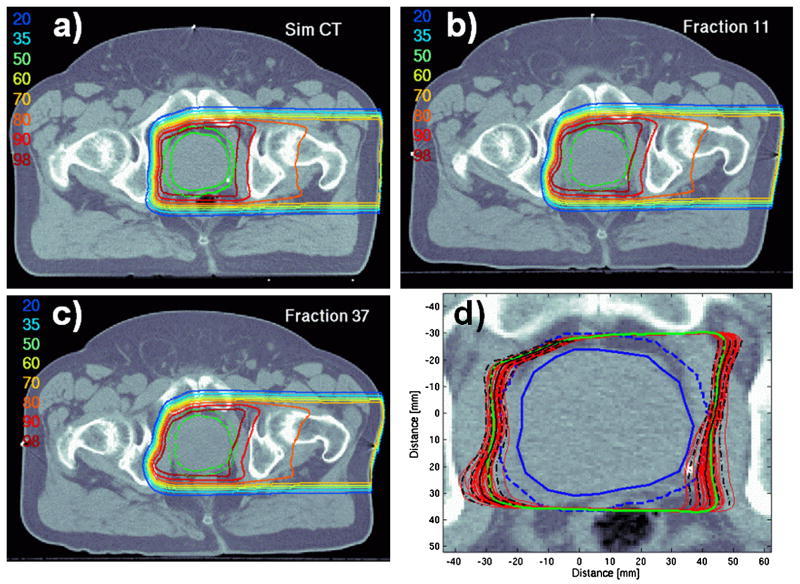
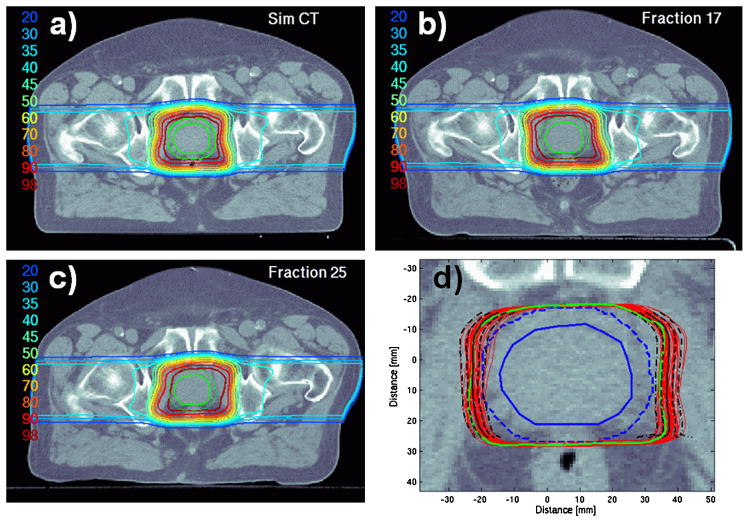
The effect of interfractional variations in the patient’s set-up and the anatomy is illustrated in Figure 5, for a single left lateral proton beam, and Figure 6, for the combined dose from two lateral parallel-opposed beams. The variation in position of the 98%-iso-dose contour in these two cases is shown in Figures 5(d) and 6(d).
Figure 5.
Examples of dose distributions from a single lateral beam for Patient 6: (a) planned on the pre-treatment (simulation) CT set, and (b,c) recalculated on in-room CT data with evident variation in the set-up of the ipsilateral skin surface, and femur. Panel (d) shows the overlay of the 98% iso-dose contours (plan in green, estimated delivery on various days in red) on the simulation CT. The mean position of 98%-iso-dose is shown as a solid black line, the 65% and 95% confidence intervals are shown as dashed and dot-dashed lines, respectively.
Figure 6.
Examples of combined dose distributions from two lateral-opposed beams for Patient 5: (a) planned on the pre-treatment (simulation) CT set, and recalculated (b,c) on in-room CT data with evident variation in the rectal filling, and set-up of the skin surface, and femora. Plot (d) shows the overlay of the 98% iso-dose contours, as in Figure 5.
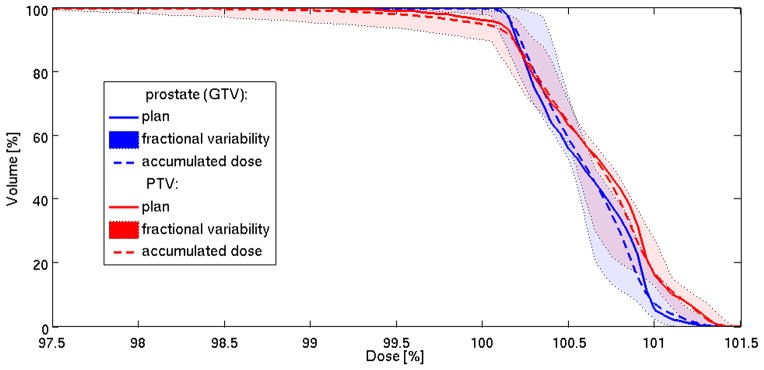
Figure 7 illustrates the effect of such variation on the dose-volume histogram (DVH) for patient 5: although the minimum dose and target coverage may fall below the desired 98%-level in individual fractions, the effect on total accumulated dose is reduced. (Fractional and accumulated DVHs were calculated, assuming that prostate rotations and deformations were negligible.)
Figure 7.
Dose-volume histograms (DVH) of the gross tumor volume (GTV), and planning target volume (PTV) for patient 5. Solid lines show the planned DVH (Figure 6(a)); tinted bands designate the range of variation in the DVH of the 43 simulated daily distributions (see Figure 6(d)), and dashed lines show accumulated DVH.
The observed shifts in the position of the treated volume (98% iso-dose) are summarized in Table 3, for the right lateral beam alone, and in Table 4 for the combined two-beam treatment fractions. For the single-beam configuration, similar results were obtained for the left and right lateral approaches. The iso-dose shifts were significantly correlated with the variations in the depth to the distal prostate surface in 8 patients out of 10, and with the femur rotation angle in the 2 other patients (Table 3). The examples of such correlated distributions are given in Figure 8.
Table 4.
Variations in the lateral depth to the distal tumor volume surface (D2DT), and the position of the prescription iso-dose (combined dose from 2 lateral beams). For both left and right sides, the positive shift is defined as the expansion of the iso-dose towards the respective lateral surface.
| Case | Plan CT D2DT [mm] |
In-room CT |
||||
|---|---|---|---|---|---|---|
| D2DT mean ± standard deviation [mm] | Shift in the position of prescription iso-dose [mm] | |||||
| Left | Right * | Left | Right * | Left | Right | |
| 1 | 218 | 220 | 221 ± 2 | 221 ± 3 | 0.9 ± 2.3 | −0.5 ± 2.1 |
| 2 | 282 | 277 | 280 ± 3 | 281 ± 4 | 3.1 ± 2.8 | −0.4 ± 2.5 |
| 3 | 237 | 226 | 235 ± 2 | 228 ± 3 | −1.2 ± 1.6 | −1.2 ± 1.6 |
| 4 | 243 | 241 | 249 ± 3 | 244 ± 3 | −1.6 ± 1.6 | −0.7 ± 1.6 |
| 5 | 199 | 202 | 200 ± 2 | 204 ± 2 | 1.7 ± 1.9 | −0.7 ± 1.8 |
| 6 | 199 | 206 | 204 ± 2 | 206 ± 2 | 1.0 ± 1.8 | −1.7 ± 1.8 |
| 7 | 190 | 192 | 191 ± 2 | 191 ± 2 | −0.5 ± 1.4 | −0.5 ± 1.3 |
| 8 | 197 | 200 | 200 ± 2 | 204 ± 1 | 0.1 ± 1.4 | 1.0 ± 1.4 |
| 9 | 232 | 230 | 237 ± 2 | 232 ± 2 | 0.1 ± 1.5 | 0.8 ± 1.3 |
| 10 | 208 | 207 | 206 ± 2 | 204 ± 2 | 0.1 ± 2.1 | −2.2 ± 2.2 |
Repeated from Table 3 for convenience
Abbreviations: CT = computed tomography scan, D2DT = depth to distal tumor volume surface
Figure 8.
Distribution of variation in the mean shift in the distal 98%-iso-dose as a function of the variation, with respect to the planning CT, in the (a) lateral subcutaneous adipose tissue thickness (ATT), (b) depth to distal tumor volume surface (D2DT), and (c) ipsilateral femur set-up angle, for the right beam approach. The fit lines are given to guide the eye.
The largest deviations in the femur and soft tissue set-up were observed in Patient 2, who had the highest BMI. However, overall, the correlation between the calculated variation in the iso-dose position and body-mass index for 10 patients was insignificant.
DISCUSSION
From this review of 10 series of CT data acquired during multiple fractions of the course of radiotherapy, it is evident that variations in patient’s body set-up and internal anatomy are inevitable even with some of the most thorough and technically advanced alignment and immobilization procedures.
Systematic differences between the pre-treatment and in-room set-up, especially in the skin surface and soft tissue immobilization, as well as changes in patient’s weight are additional factors contributing to variations of the treated volume, both in the shape and mean position (depth). Additionally, changes in the volume of the prostate during the treatment course have been reported [10], and can lead to a reduction in dose conformity and increased irradiation of adjacent healthy organs. Misalignment (including systematic shifts between the plan and in-room set-up) of the bony anatomy with respect to the prostate is, generally, well addressed by the compensator expansion, as long as it remains within the assumed smearing radius (10 mm at MGH).
We quantified a number of parameters of set-up variation, and evaluated the effect on the location of the 98% iso-dose with respect to the target in the iso-center slice, which typically represents the largest cross-section of the prostate. Possible limitations of our analysis are the use of simplified dose calculation, assumptions of constancy of CT calibration. For our data selection, we conclude that with the single exception of Patient 2, the standard deviation in the position of boundaries of the treated volume was within 2.5 mm (Table 4). Thus the 5 mm PTV margin, exceeds the standard deviation by a factor of 2 or more, which is adequate for a random set-up error (see, e.g., [11]). However, the standard 5 mm margin may not suffice in the treatment of severely obese patients, similar to Patient 2 in this study, with protons, due to the increased difficulty of target localization, and alignment and immobilization of the internal bony anatomy [12].
The effect of the prostate interfractional motion in the left-right direction, parallel to the beam axis is considered in this study, along with anatomical variations. However, we did not evaluate the effect of superoinferior and anterorposterior misalignments of the treatment field with respect to the target volume, orthogonal to the beam direction. Although due to the application of margins the coverage of the target is likely to remain satisfactory [2], the dose to healthy tissues would increase. In the case of random shifts of the treated volume (the coverage 98%-iso-dose) with a standard deviation of 2-3 mm in the anterior-posterior position in a fractionated treatment course, the lateral penumbra (80–20%) of the combined dose would increase by 1 mm: from 10–15 mm for the typical prostate treatments at MGH [13] to 11–16 mm. However, given the lateral dose fall-off at roughly 4 Gy per mm away from the PTV in a typical plan, a systematic misalignment could substantially increase the dose to the rectum or bladder. E.g., a 2.5 mm systematic shift towards the posterior would result in the increase of 10 Gy in the dose to tissues within the penumbra, i.e., the rectal volumes treated to 70 Gy (V70) will actually approach the V60 of the original plan. Therefore, image-guided set-up procedures are essential for preventing misalignments between the treatment field and the prostate gland, and reducing the irradiation of surrounding tissues.
In this study we did not apply the additional margins along the beam direction, since we attempted to isolate and quantify the effect of interfractional changes. Distal and proximal margins are used in particle therapy to account for the uncertainties in the conversion of the CT numbers to proton stopping powers, which are determined not only by the electron density, but also the molecular composition of the irradiated tissue. The accuracy with which the proton range can be determined from CT has been estimated to be in soft and bony tissue, respectively, on the order of 1.1% and 1.8% [14]. Consequentially, typical margins are on the order of 3.5% of the range, or 6-10 mm for prostate patients [1,15], which is larger than typical PTV expansion margins [1,2,4].
A reduction in the range uncertainty will allow for the use of smaller distal and proximal margins in proton therapy, and reduction in the integral dose. We estimate that, from the MGH experience, the skin dose increases by 0.3% of the target dose for every mm of SOBP modulation width. Thus, for a range of 25 cm, PTV width of 7 cm, the 3.5% distal and proximal expansion will add 15 mm to the margins, and some 5% increase in the dose to skin, and in the integral dose in transit to prostate. The accuracy of proton range prediction in patient can be improved with the use of proton radiography [16]. In-vivo range verification methods have been proposed including prompt gamma-ray emission [17], and positron-emission tomography (PET) [18].
Were the range margins reduced, soft tissue immobilization would become ever more critical. Figures 5 and 6 illustrate the substantial effect of the deformation of the skin surface on the range of proton fields. Skin immobilization devises, such as casts, pods or thin fitted siding walls attached to the couch, might serve as relatively low-cost means of minimizing the variation in the lateral depth due to soft tissue deformation, and would be especially relevant in treatment of overweight patients.
In some prostate treatment protocols, each 2 Gy treatment fraction is delivered with a single beam, alternating between the left and right lateral beams daily. Comparison of the shifts of the 98%-prescription iso-dose for one- and two-beam treatments in Tables 3 and 4, shows that the standard deviation in the position of the treated volume is significantly higher (p=0.003), on a case by case basis, by an average of 25% when dose is delivered with one beam per day. Should the range uncertainty margins be reduced for such treatments, our recommendation would be to deliver both beams daily.
Parametrization of dose perturbations due to uncertainties is of interest for modeling of expected variations in robust treatment planning techniques for intensity-modulated proton therapy (IMPT) [7]. Robust planning can reduce the effect of uncertainties associated with IMPT delivery, help achieve improved dose conformality to the target, and reduction in the secondary scattered dose, compared to standard broad-beam proton therapy. Notably, at MGH, IMPT will allow the extension of proton treatments to those patients who require a proton range of 290–320 mg/mm2 [19], currently unavailable with the scattered beam delivery. IMPT with scanned pencil beams is also expected to produce a sharper lateral penumbra, compared to the broad-beam 3D-conformal treatments [13].
It is a general expectation that with further development of the uncertainty-robust treatment planning, image-guided set-up and delivery verification technologies, reduction in safety margins could become possible, paving the way for dose escalation to the prostate, and more conformal treatments both with scattered-beam conformal therapy and pencil-beam IMPT. We conclude from our study, that, complementary to accurate prostate localization set-up, bony anatomy and skin contour immobilization are essential in achieving conformation of the delivered dose to the plan, and that the practice of delivering multiple fields per day is recommended in order to reduce the daily variation in the dose.
CONCLUSIONS
Femur rotation, and soft tissue deformation may cause substantial perturbation in the shape of prescription iso-dose volume. The application of the standard target margin expansion in the longitudinal direction, and compensator expansion technique prevent loss of dose to target in the majority of cases. In-room set-up verification is essential for precise targeting, and maintaining the target coverage. While improved target immobilization may allow one to reduce PTV and compensator expansion margins, the uncertainties in the proton penetration in tissue remain as the biggest contribution to the margin expansion. Consequentially, refinements in in-vivo proton range verification methods may potentially have the biggest impact on the margin reduction, and confirmation of the treated volume to the target.
Acknowledgments
The project was supported by the Federal Share of program income earned by Massachusetts General Hospital on C06-CA059267, Proton Therapy Research and Treatment Center. AT thanks Scott Mauceri and Ilja Frank Ciernik, M.D. for assistance with the data preparation and review.
Footnotes
Conflict of Interest Notification: The authors declare no conflict of interest.
Publisher's Disclaimer: This is a PDF file of an unedited manuscript that has been accepted for publication. As a service to our customers we are providing this early version of the manuscript. The manuscript will undergo copyediting, typesetting, and review of the resulting proof before it is published in its final citable form. Please note that during the production process errors may be discovered which could affect the content, and all legal disclaimers that apply to the journal pertain.
References
- 1.Zhang X, Dong L, Lee AK, et al. Effect of anatomic motion on proton therapy dose distributions in prostate cancer treatment. Int J Radiat Oncol Biol Phys. 2007;67:620–629. doi: 10.1016/j.ijrobp.2006.10.008. [DOI] [PMC free article] [PubMed] [Google Scholar]
- 2.Yoon M, Kim D, Shin DH, et al. Inter- and intrafractional movement-induced dose reduction of prostate target volume in proton beam treatment. Int J Radiat Oncol Biol Phys. 2008;71:1091–1102. doi: 10.1016/j.ijrobp.2007.11.031. [DOI] [PubMed] [Google Scholar]
- 3.Sejpal SV, Amos RA, Bluett JB, et al. Dosimetric changes resulting from patient rotational setup errors in proton therapy prostate plans. Int J Radiat Oncol Biol Phys. 2009;75:40–48. doi: 10.1016/j.ijrobp.2008.08.042. [DOI] [PubMed] [Google Scholar]
- 4.Trofimov A, Nguyen PL, Coen JJ, et al. Radiotherapy treatment of early-stage prostate cancer with IMRT and protons: a treatment planning study. Int J Radiat Oncol Biol Phys. 2007;69:444–453. doi: 10.1016/j.ijrobp.2007.03.018. [DOI] [PMC free article] [PubMed] [Google Scholar]
- 5.Owen R, Kron T, Foroudi F, et al. Comparison of CT on rails with electronic portal imaging for positioning of prostate cancer patients with implanted fiducial markers. Int J Radiat Oncol Biol Phys. 2009;74:906–912. doi: 10.1016/j.ijrobp.2009.01.054. [DOI] [PubMed] [Google Scholar]
- 6.Wong J, Gao Z, Uematsu M, et al. Interfractional prostate shifts. Int J Radiat Oncol Biol Phys. 2008;72:1396–1401. doi: 10.1016/j.ijrobp.2008.03.045. [DOI] [PubMed] [Google Scholar]
- 7.Unkelbach J, Bortfeld T, Martin BC, et al. Reducing the sensitivity of IMPT treatment plans to setup errors and range uncertainties via probabilistic treatment planning. Med Phys. 2009;36:149–163. doi: 10.1118/1.3021139. [DOI] [PMC free article] [PubMed] [Google Scholar]
- 8.Langen KM, Willoughby TR, Meeks SL, et al. Observations on real-time prostate gland motion using electromagnetic tracking. Int J Radiat Oncol Biol Phys. 2008;71:1084–1090. doi: 10.1016/j.ijrobp.2007.11.054. [DOI] [PubMed] [Google Scholar]
- 9.Bussière MR, Adams J. Treatment planning for conformal proton radiation therapy. Technol Cancer Res Treat. 2003;2:389–399. doi: 10.1177/153303460300200504. [DOI] [PubMed] [Google Scholar]
- 10.Zechmann CM, Aftab K, Didinger B, et al. Changes of prostate gland volume with and without androgen deprivation after intensity modulated radiotherapy. Radiother Oncol. 2009;90:408–412. doi: 10.1016/j.radonc.2008.09.006. [DOI] [PubMed] [Google Scholar]
- 11.van Herk M. Errors and margins in radiotherapy. Semin Radiat Oncol. 2004;14:52–64. doi: 10.1053/j.semradonc.2003.10.003. [DOI] [PubMed] [Google Scholar]
- 12.Wong JR, Gao Z, Merrick S, et al. Potential for higher treatment failure in obese patients: correlation of elevated body mass index and increased daily prostate variations from the radiation beam isocenters. Int J Radiat Oncol Biol Phys. 2009;75:49–55. doi: 10.1016/j.ijrobp.2008.07.049. [DOI] [PubMed] [Google Scholar]
- 13.Safai S, Bortfeld T, Engelsman M, et al. Comparison between the lateral penumbra of a collimated double-scattered beam and uncollimated scanning beam in proton radiotherapy. Phys Med Biol. 2008;53:1729–1750. doi: 10.1088/0031-9155/53/6/016. [DOI] [PubMed] [Google Scholar]
- 14.Schaffner B, Pedroni E. The precision of proton range calculations in proton radiotherapy treatment planning: experimental verification of the relation between CT-HU and proton stopping power. Phys Med Biol. 1998;43:1579–1592. doi: 10.1088/0031-9155/43/6/016. [DOI] [PubMed] [Google Scholar]
- 15.Moyers MF, Miller DW. Range, range modulation, and field radius requirements for proton therapy of prostate cancer. Technol Cancer Res Treat. 2003;2:445–447. doi: 10.1177/153303460300200509. [DOI] [PubMed] [Google Scholar]
- 16.Schneider U, Besserer J, Pemler P, et al. First proton radiography of animal patient. Med Phys. 2004;31:1046–51. doi: 10.1118/1.1690713. [DOI] [PubMed] [Google Scholar]
- 17.Polf JC, Peterson S, Ciangaru G, et al. Prompt gamma-ray emission from biological tissues during proton irradiation: a preliminary study. Phys Med Biol. 2009;54:731–743. doi: 10.1088/0031-9155/54/3/017. [DOI] [PubMed] [Google Scholar]
- 18.Parodi K, Paganetti H, Shih HA, et al. Patient study of in vivo verification of beam delivery and range, using positron emission tomography and computed tomography imaging after proton therapy. Int J Radiat Oncol Biol Phys. 2007;68:920–934. doi: 10.1016/j.ijrobp.2007.01.063. [DOI] [PMC free article] [PubMed] [Google Scholar]
- 19.Kooy HM, Clasie BM, Lu HM, et al. A case study in proton pencil-beam scanning delivery. Int J Radiat Oncol Biol Phys. 2010;76:624–630. doi: 10.1016/j.ijrobp.2009.06.065. [DOI] [PubMed] [Google Scholar]


