
Figure 5.
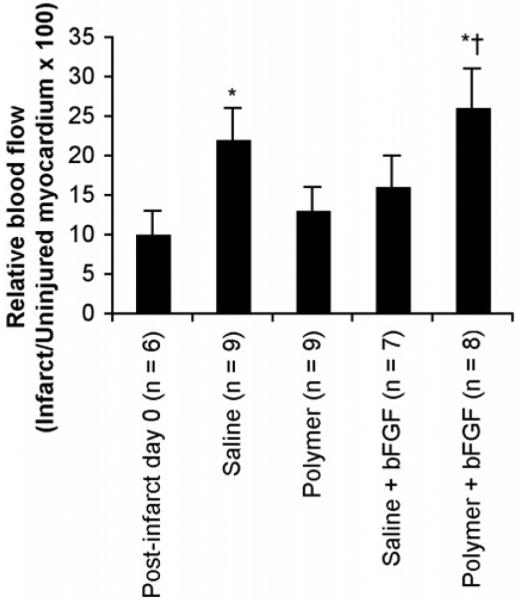
Regional myocardial blood flow to infarct region after 28 days of treatment, expressed as a percentage of the blood flow to the uninjured myocardium. Relative flow quantified using fluorescent polystyrene microspheres. Post-infarct day 0 indicates baseline data from red-orange microspheres injected on day 0, while saline, polymer, saline+bFGF, and polymer+bFGF groups indicate data from green microspheres injected at the time of sacrifice (28 days post-surgery). Infarcted and uninjured tissue samples were isolated at 28 days post-injection at the time of sacrifice, and fluorescence intensity values were normalized to tissue weights. Values shown are mean±SEM. *p<0.05 versus post-infarct day 0, †p<0.05 versus polymer at 28 days.