Abstract
The contrast mechanisms used for photoacoustic tomography (PAT) and fluorescence imaging differ in subtle but significant ways. Design of contrast agents for each or both modalities requires an understanding of the spectral characteristics as well as intra- and intermolecular interactions that occur during formulation. We found that fluorescence quenching that occurs in the formulation of near infrared (NIR) fluorescent dyes in nanoparticles results in enhanced contrast for PAT. The ability of the new PAT method to utilize strongly absorbing chromophores for signal generation allowed us to convert a highly fluorescent dye into an exceptionally high PA contrast material. Spectroscopic characterization of the developed NIR dye-loaded perfluorocarbon-based nanoparticles for combined fluorescence and PA imaging revealed distinct dye-dependent photophysical behavior. We demonstrate that the enhanced contrast allows detection of regional lymph nodes of rats in vivo with time-domain optical and photoacoustic imaging methods. The results further show that the use of fluorescence lifetime (FLT) imaging, which is less dependent on fluorescence intensity, provides a strategic approach to bridge the disparate contrast reporting mechanisms of fluorescence and PA imaging methods.
Keywords: cancer, metastasis, prognosis, optical, biopsy, perfluorocarbon
The nodal status of cancer is an important prognostic indicator for patients diagnosed with melanoma,1 gynecological cancers,2 breast cancer,3 prostate cancer,4, 5 and other forms of solid cancer. Metastatic spread of cancer cells occurs by the local invasion of adjacent tissue and dissemination in the blood stream via the lymphatic system. Cancer cells that migrate from the primary tumor may become lodged in the first lymph nodes draining the tumor area. From that lymph node, the tumor cells migrate further into other lymph nodes and blood stream, leading to wider spread of cancer. The closest lymph node that drains the tumor area is called the sentinel lymph node (SLN). The SLN represents the most probable first location of metastatic spread.3 Identification of the SLN is commonly performed in clinics invasively using a colloid of radionuclide, such as 99mTc-labeled sulfur colloid6, 7 and/or injection of a dye, such as isosulfan blue or methylene blue8, 9 subcutaneously in tissue surrounding the tumor location at the time of surgery. After initial clearance of the probe, the nearby tissue is dissected and the location of the SLN is determined by a hand-held scintillator as a hot spot or visually as a blue-stained tissue. The SLN is removed and examined immediately by pathologist using standard intraoperative histological protocol.10–12 If cancer cells are detected in SLN, surgical resection of the secondary lymph nodes (radical resection) is performed to eradicate the tumor or prevent further metastasis. Although these techniques have improved surgical practice and prevented further spread of cancer, less invasive, highly sensitive, and more accurate localization of SLNs would further improve patient care. Toward these goals, optical and hybrid methods for non-invasive SLN detection have been developed, including fluorescence detection13, 14 and photoacoustic (PA) imaging.15, 16
Fluorescent optical imaging is a well-known method for in vivo imaging and PA imaging is a recent development that combines optical absorption contrast and fine ultrasonic resolution. The advantage of the lymph node detection using PA imaging has been demonstrated at depths more than 30 mm with resolution of 0.5 mm.15 Both, fluorescence and PA imaging modalities utilize non-ionizing radiation and are therefore safer to patients and medical staff relative to nuclear imaging methods.
To improve detection sensitivity, both fluorescence and PAT methods require contrast reagents with high absorption coefficients in the NIR spectral region. Unfortunately, commonly used blue dyes for SLN imaging absorb light below 700 nm, minimizing the assessment of deep tissue since endogenous chromophores will rapidly attenuate light penetration depth. In the first clinical trial, indocyanine green (ICG), a NIR fluorescent dye emitting at ~ 800 nm, has been successfully evaluated as a new method for SLN biopsy in breast cancer patients. The method facilitated noninvasive visualization of lymphatic vessels and nodes as well as intraoperative identification of SLN.17 In contrast to fluorescence methods that require probes with high fluorescence quantum efficiency, the probes for PAT should be minimally emissive, enhancing conversion of absorbed light energy to heat and subsequently to acoustic signal. Correspondingly, a combined modality requires a probe with moderate fluorescence quantum yield to generate both emission and PA signal simultaneously. To accomplish these goals, we explored the potential of starting with dyes with high and low fluorescence yields. However, lymphatic vessels are permeable, allowing the diffusion of small molecules back into tissue. Retaining molecular probes exclusively in the lymphatic vessels, therefore, requires their conjugation to macromolecules or formulation in nanoparticles. In addition to minimizing the spread of imaging probes beyond SLN area, minimum retention of the probe at the site of injection is essential for accurate localization of SLN.18 Currently used radioactive 99mTc-labeled sulfur colloid tends to remain at the site of administration, slowly diffusing to a lymph node and therefore producing a weak signal at SLN.19 Due to their small molecular size, blue dyes quickly pass to secondary nodes, leading to difficulties in distinguishing SLN from other nodes. It has been demonstrated that the solution to the problem lies in the application of hydrophilic nanoparticles, such as 99mTc-labeled liposomes with encapsulated dyes20 and other nanoparticles,18 which can rapidly move through the lymphatic system to the SNL and are retained there for a period long enough for surgery to be performed.
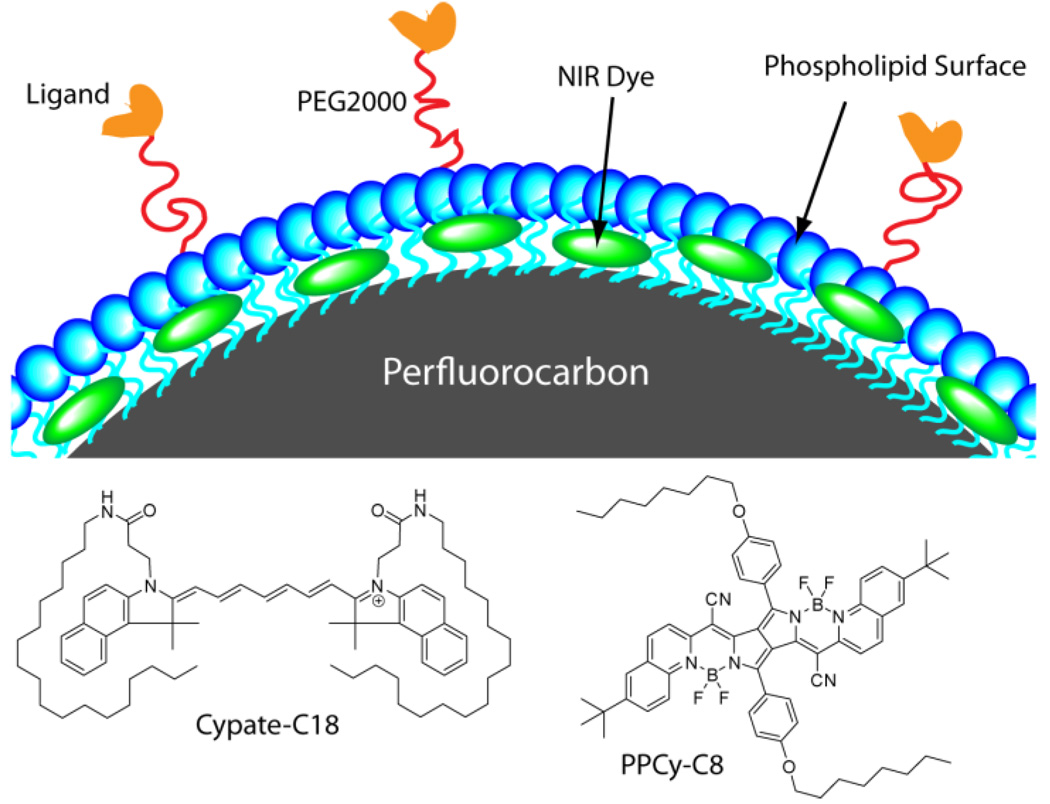
Herein, we investigated new perfluorocarbon (PFC) nanoparticles loaded with NIR dyes as potential contrast reagents for SLN mapping in rats using PA and fluorescence contrast in vivo (Figure 1). We previously demonstrated that receptor targeted PFC nanoparticles have great potential for biomedical imaging and drug delivery applications21, 22 and can be utilized for fluorescence imaging.23 Two different NIR fluorescent probes with disparate fluorescence efficiency were used in the new PFC-based nanoparticle formulations to provide fluorescence and PA contrast (Figure 1). Our results demonstrate the efficacy of lymph node mapping with both modalities. More importantly, formulation of the NIR dye with high fluorescence efficiency resulted in high PA signal due to intermolecular fluorescence quenching effect.
Figure 1.
Structure of NIR fluorescent dyes cypate-C18 and diketopyrrolopyrrole cyanine (PPCy-C8) and schematic of dye-loaded PFC nanoparticles. Perfluorocarbon core is encapsulated in amphiphilic phospholipid layer (blue) containing hydrophobic dyes (green).
RESULTS AND DISCUSSION
The detection of lymph nodes in vivo was previously demonstrated using the NIR fluorescent agent, ICG24 but very high concentrations of the dye were needed. We hypothesized that incorporation of NIR dyes in the PFC nanoparticles would improve PA contrast at relatively smaller dye content. We explored PFC-based nanoparticles incorporating two different NIR fluorescent dyes, PPCy-C8 and cypate-C18, as PA and fluorescence imaging agents in this study. The contrast agents were first analyzed in vitro by fluorescence lifetime (FLT) and PA measurements of dyes and nanoparticles in solution. This characterization was followed by in vivo time-domain diffuse optical imaging and a handheld PAT system to demonstrate potential applications of these novel contrast agents in biomedical imaging.
While a variety of biocompatible emulsion-based nanoparticle systems have been developed for optical imaging,25, 26 PFC-based nanoparticles are viable materials for non-invasive detection. PFC is a biocompatible component that has a 3-day half-life in the body and is completely eliminated through expired air via the lungs.21 We have developed methods for decorating the surface of PFC nanoparticles with contrast and targeting agents by non-covalent mechanisms, eliminating complex and low-yield synthetic steps.27 Thus we developed NIR fluorescent PFC nanoparticles for optical and PA imaging by incorporating NIR hydrophobic dyes, cypate-C1823 and PPCy-C828 (C18 and C8 indicate the number of carbons in a hydrophobic chain) in the surface layer.
Spectroscopy
We explored the use of two NIR fluorescent dyes, PPCy-C8 and cypate-C18, as PA and fluorescence imaging agents in this study. The synthesis and optical properties of these dyes (absorption, emission and FLT) were reported previously.23, 28, 29 Both dyes possess high molar absorptivity in NIR range >200,000 M−1 cm−1. Cypate-C18 has a moderate fluorescence quantum yield and a relatively short FLT due to the flexible excited state structure.23, 30 In contrast, PPCy-C8 with its highly rigid skeleton ensured by complexation with disubstituted boron possesses high fluorescence quantum yield and much longer FLT (Table 1). Both dyes have long hydrophobic tails for stable insertion into the phospholipid layer on the surface of the nanoparticles. The dyes were successfully loaded in PFC nanoparticles using a standard protocol (see Methods). All nanoparticles were uniformly distributed with 220 +/− 11 nm mean diameter and less than 10% polydispersity as determined by DLS. Upon incorporation in phospholipid shell, cypate-C18 retained the NIR absorption and emission properties of the base molecule in 0.1 mol% to 0.3 mol%. The detailed optical characterization of cypate-C18/PFC-nanoparticle was reported previously.23
Table 1.
Optical properties of Cypate-C18 and PPCy-C8 free in solution and incorporated in PFC-based nanoparticles.
| Probes | solvent | λ, abs | λ, em | ε, M−1 cm−1 | Φ | τ, ns | Soluble in water |
Ref |
|---|---|---|---|---|---|---|---|---|
| Cypate-C18 | DMSO | 790 | 815 | 242,000 | 0.09 | 0.83 | no | 23 |
| PPCy-C8 | chloroform | 754 | 766 | 205,000 | 0.59 | 4.36 | no | 28 |
| Cypate-C18/PFC | water | 797 | 813 | 283,000 | 0.04 | n/m | yes | 23 |
| PPCy-C8/PFC | water | 789 | n/f | 50,000 | n/f | n/f | yes |
ε – molar absorptivity, Φ – quantum yield, τ – FLT, n/f – non fluorescent, n/m – not measured, DMSO – dimethylsulfoxide
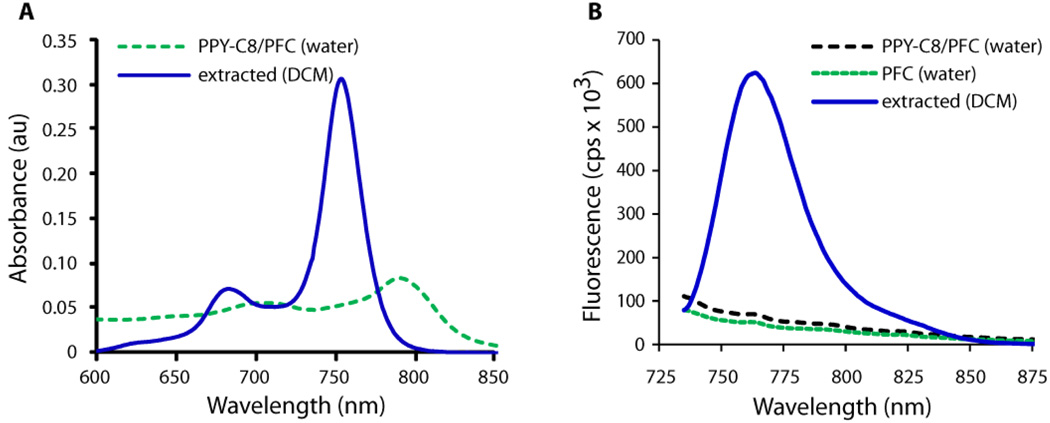
In contrast to cypate-C18, the PPCy-C8 fluorescence properties were altered upon incorporation in nanoparticles. The absorption spectrum of the incorporated dye showed a significant bathochromic shift from 754 nm in chloroform to 789 nm in the PFC nanoparticle system in water (Table 1 and Figure 2A). The shift was accompanied by a substantial decrease in molar absorptivity and fluorescence yield. Highly emissive properties of the PPCy-C8 dye completely disappeared and the emission spectrum of the PPCy-C8/PFC nanoparticles in water was very similar to the emission spectrum of the control PFC nanoparticles with no dye (Figure 2B). The optical properties of the pure dyes Cypate-C18 and PPCy-C8 were determined in organic solvents because they are not soluble in water.
Figure 2.
Absorption (A) and emission (B) of PPCy-C8/PFC nanoparticles in water and after extraction of the dye from liposome with dichloromethane (DCM). Ex. 720 nm. Absorption spectrum of PPCy-C8/PFC was corrected by the absorption of PFC with no dye.
The drastic alteration in optical properties of PPCy-C8/PFC nanoparticles could be attributed to a variety of factors, including chemical instability of the dye upon formulation. To demonstrate stable incorporation, the dye was extracted with DCM and the optical properties of the extract were recorded. Absorption and emission properties of the extract were identical to that of the original dye (Supplemental Information, Fig. S1), clearly demonstrating the structural integrity of the dye.
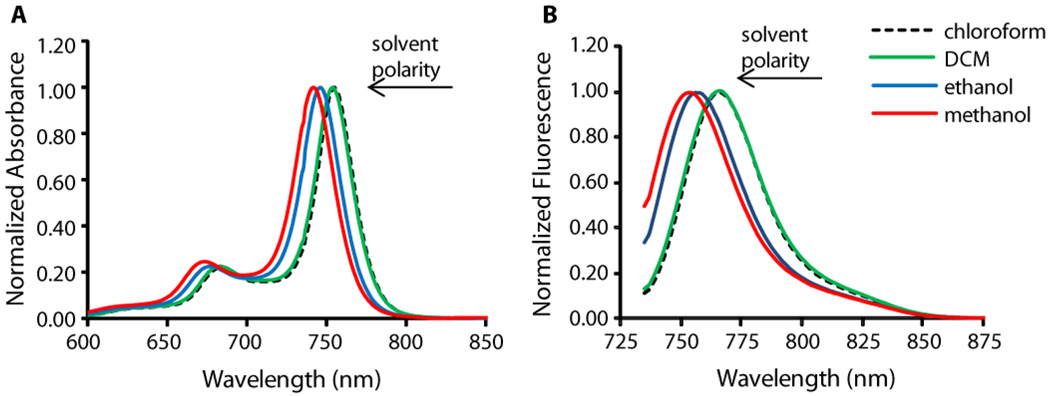
To further understand the underlying mechanism of changes in the optical properties, we investigated the behavior of the dye in different solvents. The change in polarity from chloroform to methanol caused a hypsochromic shift (Figure 3) while retaining strong fluorescence. Thus, solvent polarity alone is not a compelling reason for spectral change. However, we observed an alteration of the absorption spectra of PPCy-C8 in methanol over time from a spectrum similar to PPCy-C8 in DCM to that of PPCy-C8/PFC in water (Figure S2). This transformation suggests aggregation of the hydrophobic dye in a polar environment. Similar changes in the absorption spectra with characteristic peaks at ~ 790 nm and ~ 710 nm were also observed upon addition of water to a methanol solution of the dye (Figure S3A and 3B), resulting in similar optical properties (Figure S3C) and indicating similar mechanism of interaction in both solvent systems. Alterations of the absorption spectra were accompanied by strong fluorescence quenching (Figure S3B). Based on these results, we postulate that the change in absorption spectra and fluorescence quenching of the dye incorporated in PFC nanoparticles were due to dye aggregation promoted by the presence of water.
Figure 3.
Shift in absorption (A) and emission (B) of PPCy-C8 in different solvents (conc. 1.3 µM in all solutions, ex. 720 nm)
Addition of water (within the range of 5 – 10 volume%) on the time-scale of seconds gives time-dependent changes that is ascribed to diffusion processes. Clear isosbestic points (Figure S2) are good indicators that neither significant precipitation nor a variety of differently large aggregates occurred. The observed effects can be explained with the formation of dimers rather than higher aggregates with the monomeric units shifted longitudinally and with an angle of about 30 to 60 degrees between the long axes, representing the direction of the transition moment of the first electronic transition. These interpretations are supported by the observed isosbestic points in the absorption spectra and the occurrence of a short wavelength band in addition to the long wavelength band as shown by the splitting of the 740 nm band into bands at 796 nm and 703 nm, respectively (Figure 2). Due to a relatively flat twisting (torsional) potential, a significant variation of the angle between the monomer transition moments is expected at room temperature. Thus, around the thermodynamically most preferred angle, a dynamic equilibrium of conformations with larger or smaller angles produces an increase of the band half-widths under dimerization. This mobility (low torsional rigidity) in the first excited electronic state should be an efficient channel for the radiationless deactivation, resulting in loss of radiative transfer fluorescence.
The increased loading of the dyes on PFC from 0.1 % to 0.3 % did not affect optical properties of particles. Absorption properties of PPCy-C8/PFC were proportional to the loading change, making the nanoparticles greener in hue, with no increase in fluorescence observed. Optical properties of the PPCy-C8/PFC helped to elucidate the structural features of the nanoparticles. Specifically, the data suggest that the PPCy-C8 molecules in PPCy-C8/PFC nanoconstruct are exposed to the solvent and therefore lie outside the shell. The nanoconstruct is stable because the addition of bovine serum albumin solution to the nanoparticle solutions did not changed the absorption and emission spectra. Addition of albumin helps to identify if the dye is stably incorporated into a nanoparticle. Hydrophobic dyes bind non-covalently to hydrophobic pockets of albumin and the binding effect can be detected by a change in fluorescence intensity. Since no change in fluorescence intensity was observed after the addition of albumin, the result unequivocally demonstrated that the dye is stably incorporated within the PFC nanoparticles.
Upon loading in PFC nanoparticles, the dyes behaved differently with respect to quantum yield of fluorescence and FLT. We hypothesized that lower fluorescence quantum yield of dyes within the PFC nanoparticles would improve PA contrast due to higher heat yield, which in turn would generate stronger ultrasound signal (thermal expansion).16 Non-quenched nanoparticles are expected to produce higher fluorescence intensity but poor PA signal. Enhanced fluorescence quenching was realized with PPCy-C8 upon formulation in PFC nanoparticles, which retained relatively high absorption coefficient of the dye (~50,000 M−1 cm−1, see Table 1)
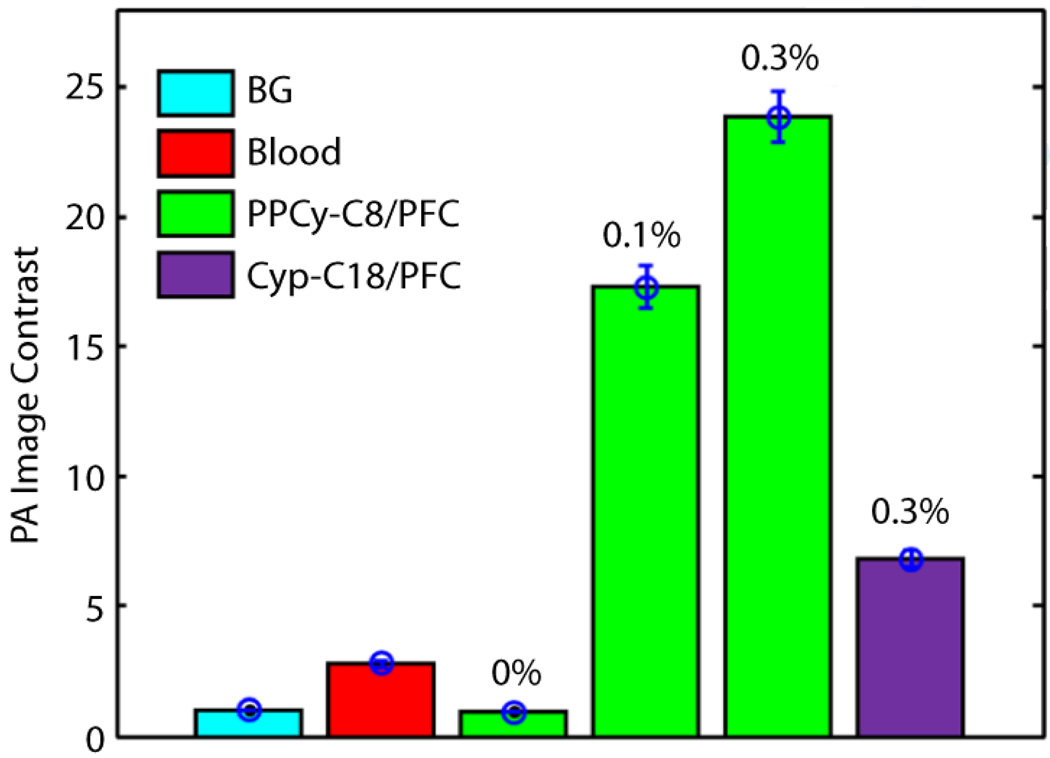
PA signals for free dyes and dye-loaded PFC nanoparticles were measured in solution using a non-contact PA microscopy system.15 We confirmed that no PA signal (comparable to the signal from background) was observed from PFC nanoparticles without loading any NIR dye (Figure 4). PPCy-C8/PFC nanoparticles produced ~ 3.5 times greater PA amplitude than comparable concentration (0.3 mol%) of cypate-C18/PFC and significantly higher signal (~9 times) than whole blood (Figure 4). We found that the free dyes did not produce sufficient PA signal in vitro for further applications at equivalent dye concentrations for in vivo study (data not shown).
Figure 4.
Comparison of PPCy-C8/PFC and cypate-C18/PFC nanoparticle PA image contrast relative to whole blood at an optical wavelength of 767 nm. The concentration of PPCy-C8 varied from 0.1 mol% to 0.3 mol%. BG: background
Fluorescence quenching of PPCy-C8 in the PFC nanoparticles could be attributed to exposure to aqueous medium or self-aggregation. Either way, the net result is the conversion of absorbed light to heat, which improved the PA contrast through tissue thermal expansion. The high PA signal of PPCy-C8/PFC nanoparticles relative to equivalent concentrations of cypate-C18/PFC (Figure 4) is likely due to the difference in fluorescence properties of the dyes after formulation rather than before. This assumption is corroborated by the intense quenching present in the PPCy-C8/PFC nanoparticles as evidenced by lower fluorescence yield and very short FLT. The cypate-C18/PFC nanoparticles are approximately 3 times higher in fluorescence yield relative to PPCy-C8/PFC, in contrast to the yield of the free dyes.
In Vivo Imaging
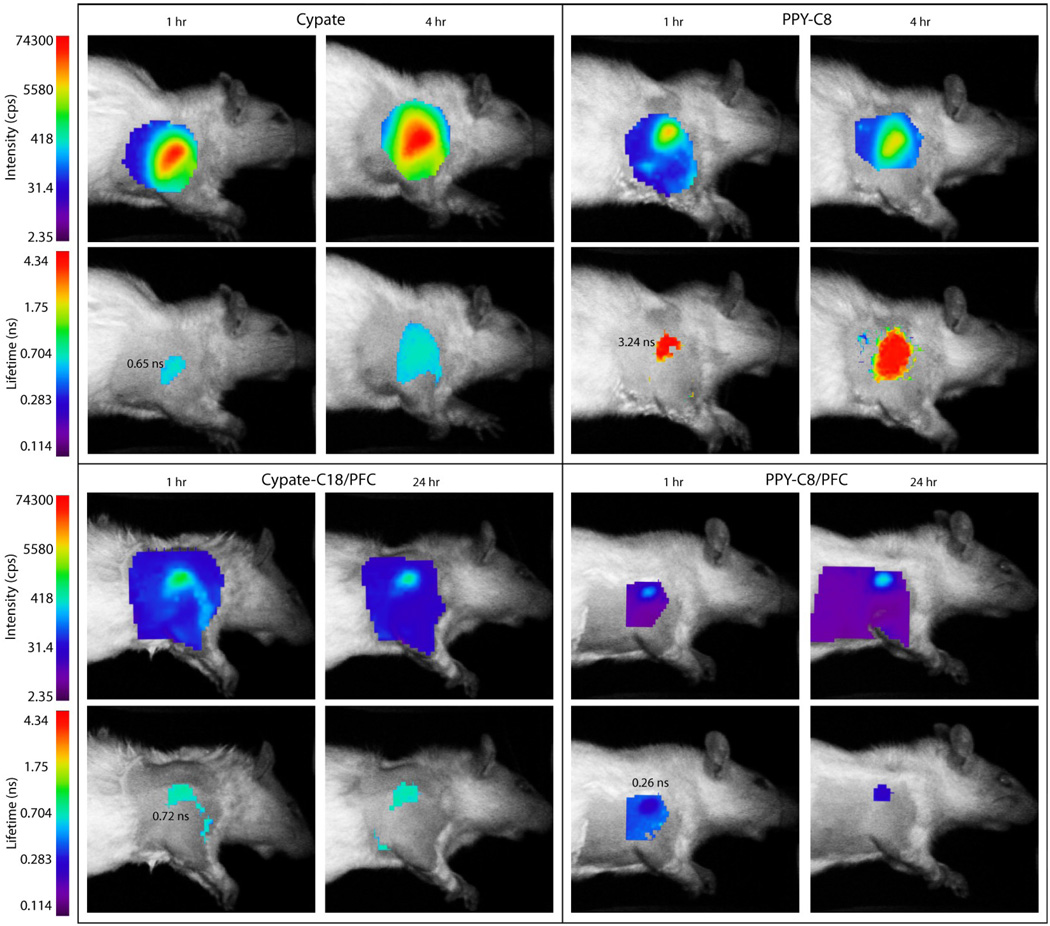
Before the injection of nanoparticles, the measured autofluorescence intensity in the lymph node region was low and FLTs could not be calculated (Figure S5). After injection of PFC-based nanoparticles subcutaneously in the forepaw of rats, fluorescence from the lymph nodes was distinct at 1 hour and 24 hours after injection (Figure 7). Data comparison shows that the measured fluorescence intensity for the lymph node region was not higher than 4 cps (normalized by laser power and integration time) for the pre-injection scans, approximately 200 cps for PPCy-C8/PFC nanoparticles, and greater than 600 cps for cypate-C18/PFC. The significant (P>0.01) increase in fluorescence for cypate-C18/PFC compared to PPCy-C8/PFC particles was a direct consequence of highly quenched PPCy-C8 dye and possible exposure to water.
Figure 7.
Fluorescence intensity and lifetime maps of rats at indicated times after subcutaneous injection of contrast agents in the forepaw. The intensity maps indicate the relative concentration of contrast agents within the axillary area at given times while the FLT maps show the differences in contrast agents used. The FLTs of cypate and cypate-C18/PFC nanoparticles are almost equal while the free PPCy-C8 has much higher FLT relative to the PPCy-C8/PFC nanoparticles.
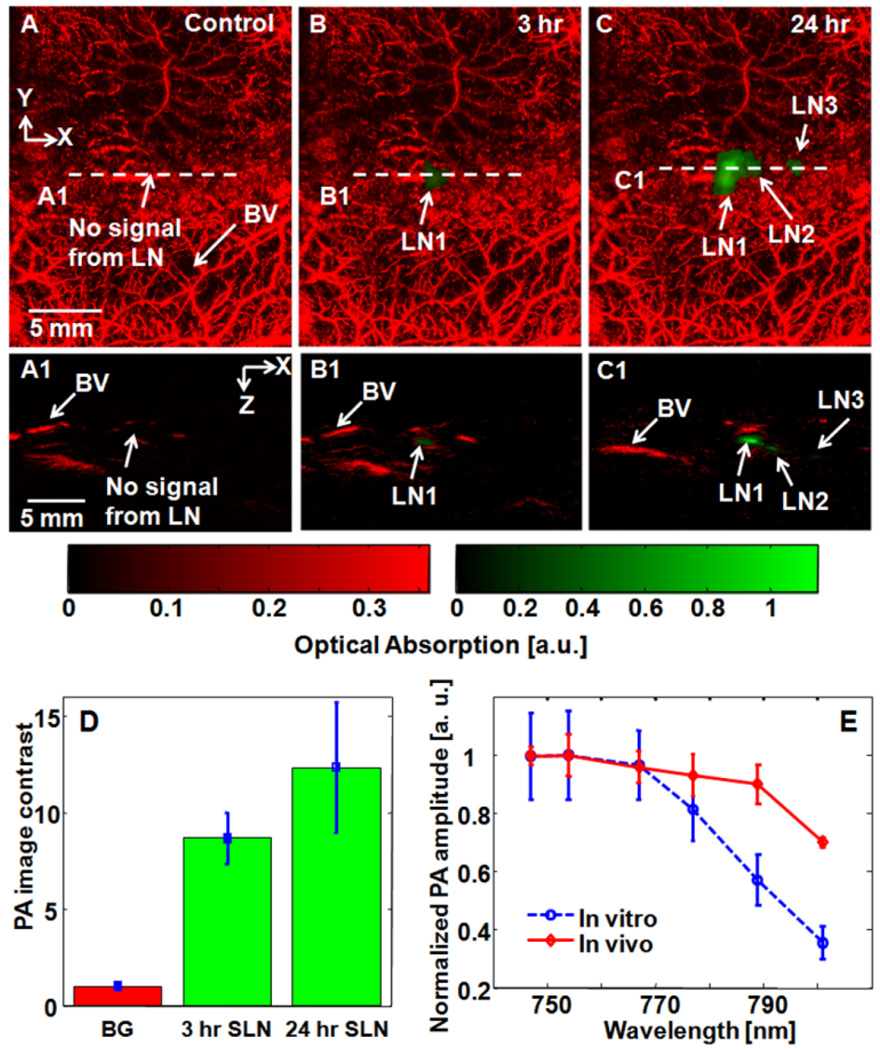
PAT was performed using the same rat model described above after subcutaneous injection of contrast agent solutions in the front paws. Lymph nodes were detected by PAT at 3 hours after injection, with excellent contrast at 24 hours after injection (Figure 5A, B, and C). The corresponding B-scan images of lymph nodes clearly show the depth position of each lymph node (Figure 5A1, B1, and C1). The average PA image contrasts of SLNs (n = 3 rats) at 3 and 24 hrs post-injection are 8.7 ± 1.3 and 12.3 ± 3.4, respectively (Figure 5D). Based on in vivo spectroscopic PA analysis, which follows the trend of in vitro PA spectrum, we confirmed that the measured PA amplitudes in vivo stemmed from lymph nodes containing PPCy-C8/PFC nanoparticles (Figure 5E).
Figure 5.
Noninvasive PA MAP images of the left axillary region of a rat. (A) Control image acquired before PPCy-C8/PFC nanoparticles. (B) PA image at 3 hr post-injection. (C) PA image at 24 hr post-injection. (A1), (B1), and (C1) Corresponding B-scan images along the cuts A1, B1, and C1, in Figs. 5A, 5B, and 5C. (D) Average PA image contrast from SLNs at 3 and 24 hrs post-injection (n=3). Error bars represent SD. (E) Comparison of spectroscopic PA amplitudes between in vitro and in vivo results. BV: blood vessels; LN: lymph node; SLN: sentinel lymph node; BG: background. Red color: blood vessels; green color: lymph nodes.
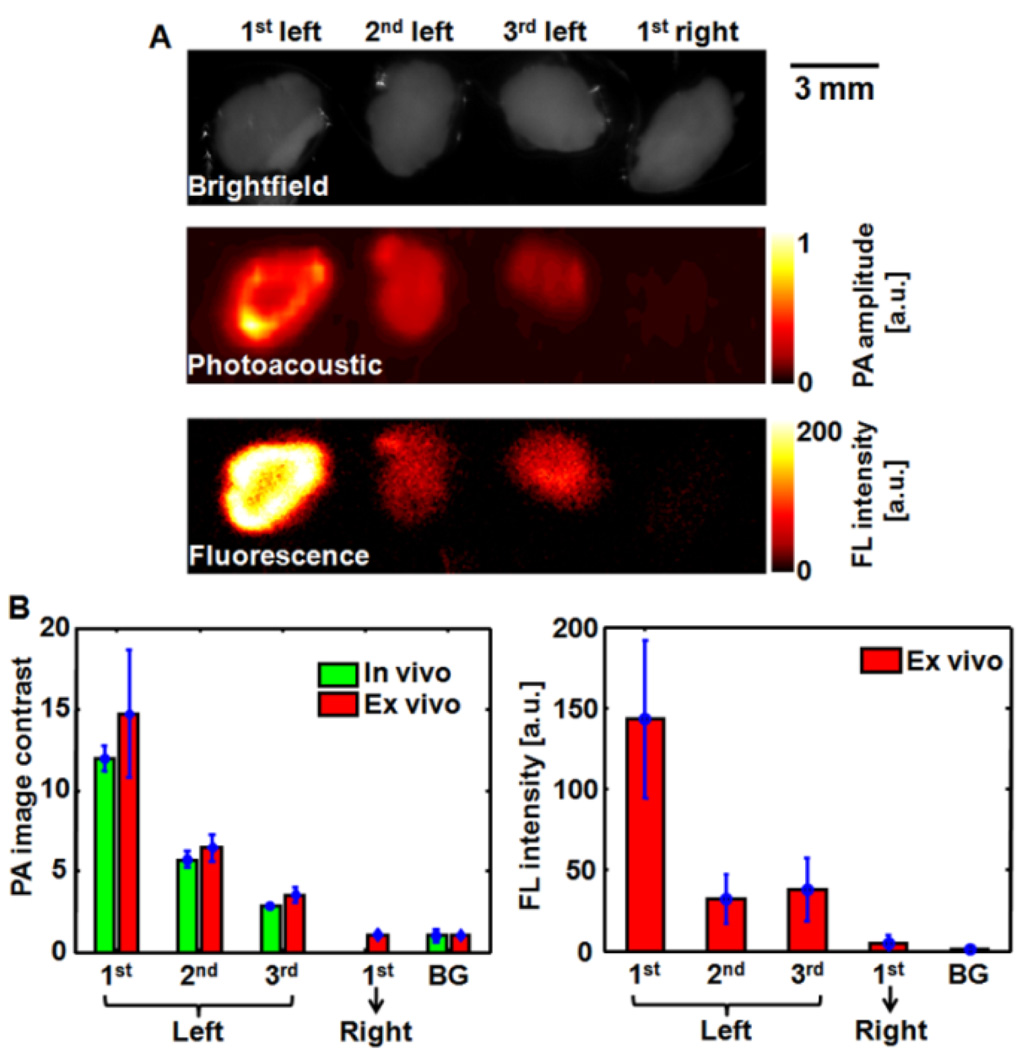
After imaging, the animals were euthanized and lymph nodes removed. PA and fluorescence imaging were performed ex vivo to confirm the location of the signal to the lymph node tissue and to assess the signal levels obtained in vivo relative to direct detection. The axillary lymph node chain detected in vivo and confirmed by ex vivo imaging (Figure 6A). Obvious fluorescence and PA signals were observed from three excised lymph nodes from the left lymph node region (injection site), whereas both signals were too weak in one dissected lymph node from the right region (no injection site). The PA image contrasts quantified from in vivo and ex vivo PA imaging results agreed well, and the ex vivo fluorescence imaging results confirmed this finding (Figure 6B), demonstrating the feasibility of using these nanoparticles for PA and fluorescence mapping of lymph nodes.
Figure 6.
(A) Brightfield, PA, and FL images of ex vivo lymph nodes 24 hours after intradermal administration of PPCy-C8/PFC nanoparticles into the left forepaw of the rat. (B) Comparison of PA image contrasts quantified from in vivo and ex vivo results, and fluorescence intensity from ex vivo results. PA: photoacoustic; FL: fluorescence; BG: background
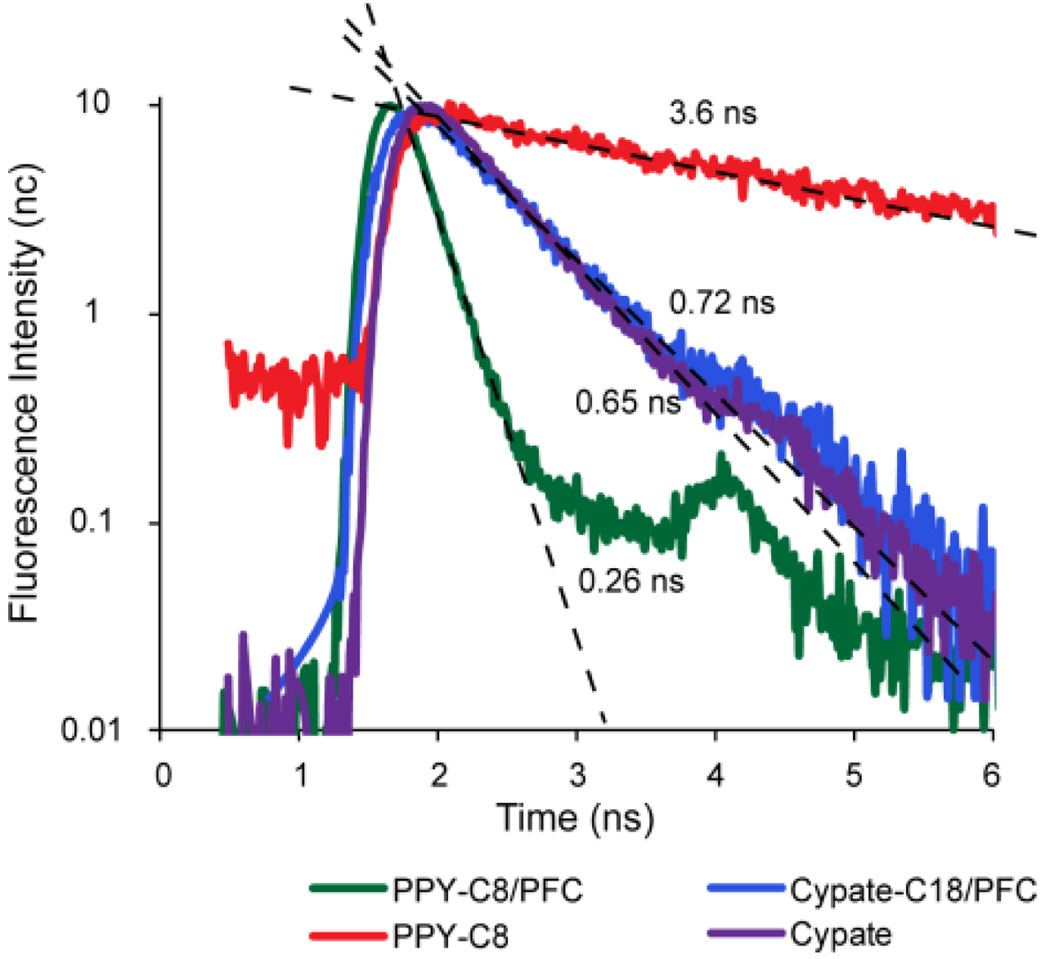
Fluorescence imaging was also performed for detecting lymph nodes in the same animal model. The fluorescence intensity and FLT maps for free dyes and dye-loaded PFC nanoparticles are shown in Figure 7. The Cypate and PPCy-C8 were transported to the regional lymph nodes faster than the nanoparticles and were imaged at 1 h and 4 h post-injection FLT measurements shown in Figure 7 and obtained from decay curves (Figure 8) demonstrated the quenched state of the PPCy-C8/PFC relative to cypate-C18/PFC nanoparticles. The FLT of free PPCy-C8 in the lymph node was greater than 3 ns while the PPCy-C8/PFC nanoparticles showed only 0.22 ns, close to the lowest minimum resolution of the imager. The fluorescence intensity from the PPCy-C8 nanoparticles was also very low relative to the free dye. In contrast, the mean FLT of cypate-C18/PFC was very close to that of the free dye.
Figure 8.
Normalized fluorescence decay curves with linear regression lines and calculated FLTs of free dyes and NIR fluorescent nanoparticles in the axillary lymph nodes measured by TD-DOI in living rats.
The FLTs were measured by single exponential fitting of the fluorescence decay curves acquired as temporal point spread functions by the time-correlated single photon counting (TCSPC) detector. Representative decay curves and fitted lifetimes are shown in Figure 8.
Both optical reporter systems provided contrast for fluorescence and PA detection, although the PPCy-C8/PFC nanoparticles demonstrated enhanced PA contrast. A possible alternative explanation of the drastic differences in the PA properties of the two dye-nanoparticle formulations is based on the orientation of the dyes within material. In the case of C18/PFC nanoparticles, both fluorescence quantum yield and lifetime measurements indicate that the dyes were sequestered inside the hydrophobic core of the nanoparticle formulation. This suggests that local heat generated by the system could be absorbed by the phospholipid outer layer, thereby attenuating the resultant PA signal. In contrast, the dye in the PPCy-C8/PFC formulation is possibly exposed to the outer aqueous phase, which results in direct deposition of heat to the immediate surrounding and detectable as PA signal. The concerted effect of many dye molecules per nanoparticles will further enhance the net PA signal. This reasoning provides a strategy for optimizing dye formulation for either PA or fluorescence contrast.
Interestingly, the PPCy-C8/PFC FLT remained low for the duration of the in vivo study, indicating that leakage of the dye from the nanoparticles did not occur in detectable amounts. It is possible that the dye was released but remained in a quenched state due to aggregation, though from previous reports, we would expect the lifetime to report on diffusion of the hydrophobic dye.31
Relative to the small molecule fluorophores, the C18/PFC nanoparticles provided higher SLN contrast due to more significant accumulation in the first lymph node. The small molecule agents traveled faster to the SLN, progressing to second and third lymph nodes, and draining into the circulatory system. Ex vivo fluorescence imaging of lymph nodes showed differences in diffusion patterns between free dyes and nanoparticles. The free dyes appear to have diffused along the lymph node chain, with fluorescence from cypate-C18 nearly equally distributed among the 3 lymph nodes. PPCy-C8 fluorescence was higher in the second and third lymph nodes than the first, which corresponds to the in vivo imaging results in Figure 6. The nanoparticles showed a more progressive diffusion pattern along the chain, with the first lymph node having significantly higher fluorescence intensity than the following two nodes (P < 0.05). Interestingly, the fluorescence intensity from the first lymph nodes was generally higher for the nanoparticles than for the free dyes. These differences are likely due to the faster transport of the free dyes through the lymph nodes relative to the nanoparticles. Previous studies have shown that fast migration is not a benefit in SLN detection but rather high accumulation in the LN of interest is more important.30 Thus, these PFC nanoparticles are excellent contrast agents for non-invasive SLN detection and subsequent biopsy or resection.
CONCLUSIONS
We have demonstrated contrast agents for identification of SLNs by both PA and fluorescence detection systems. Despite similar behavior of fluorescent dyes, loading of these dyes in PFC nanoparticles resulted in differential contrast for both optical and PA imaging. Enhancement of PA signal by PPCy-C8/PFC nanoparticles resulted from fluorescence quenching and possible exposure of the dye to aqueous environment. Since there are multiple dye molecules per nanoparticle, this feature is expected to increase thermal expansion of the immediate environment, leading to greater acoustic signal. These results also show the benefit of nanomaterials for enhancement of contrast by increased payload per particle. Although we have shown the advantage of a non-fluorescent system for PA imaging, this does not preclude agents for simultaneous detection by both systems. Fluorescence yield reduces PA contrast but does not abolish it. Development of fluorescent and PA contrast agents must take into account both absorption and fluorescence yield in the nanoparticle design. It is feasible to use PA for localization at early time points when the dyes are in a quenched state and fluorescence detection may be used to monitor longitudinally as PA contrast decreases. The different mechanisms of detection show the strengths and weaknesses of PA and fluorescence imaging and the advantage of combining the two modalities for noninvasive SLN mapping in cancer diagnosis. Lymph nodes were detected by diffuse optical imaging and PA imaging, showing the capabilities for non-invasive lymph node mapping.
METHODS
Materials
All reagents were spectroscopy grade or synthesized and purified to 95% or greater. DMSO, chloroform, DCM, ethanol and methanol (Spectroscopy grade) were purchased from Sigma-Aldrich (St. Louis, MO). The UV-vis absorption spectra of NPs were collected at room temperature using Beckman 640 UV-visible spectrophotometer and quartz cuvette with 10 mm of light path. The fluorescence spectra of NPs were obtained at room temperature Fluorolog III fluorescence spectrophotometer (Horiba. FLT was measured using TCSPS method as described previously. The FLTs were determined using excitation source Nanoled® 700 nm, monitored emission 775 nm with bandpass 20 nm In all measurement a three-exponential decay analysis was applied.
Synthesis
A hydrophobic derivative of cypate,32 cypate-C18,23 and diketopyrrolopyrrole cyanine, PPCy-C833 were synthesized as previously described. PFC nanoparticles with both hydrophobic dyes were formulated as previously described23 with the addition of NIR fluorescent dyes for optical and PA imaging. Briefly, the nanoparticles were comprised of 20% (v/v) perfluorooctylbromide (PFOB), 2.0% (w/v) of a surfactant co-mixture, and 1.7% (w/v) glycerin in distilled, deionized water. The surfactant co-mixture of nanoparticles included 98 mole% lecithin (Avanti Polar Lipids, Inc., Alabaster, AL, USA), 0.1 mole% of peptidomimetic ανβ3–integrin antagonist conjugated to PEG2000-phosphatidylethanolamine (Kereos, Inc, St. Louis, MO, USA), 1.9 mole% phosphatidylethanolamine (Avanti Polar Lipids, Inc., Alabaster, AL, USA). NIR dyes were substituted for lecithin on an equimolar basis from 0.1 to 0.3 mol%.The surfactant components were combined with the PFOB, water, and glycerin, the pH was adjusted to 7.5, and the mixture was emulsified (Microfluidics, Newton, MA, USA) at 20,000 psi for 4 minutes. Nominal particle sizes and polydispersity (220 +/− 11 nm with a polydispersity of 0.09) were measured by dynamic light scattering (DLS, Brookhaven Instrument Corp., Holtsville, NY, USA).
Spectroscopy
The spectral properties of these formulations were characterized relative to control nanoparticles without dye. The absorption and emission spectra of dye-loaded PFC nanoparticles were subtracted from absorption and emission of control nanoparticles. Solutions of free dye were formulated by dissolving dye in 20% DMSO in water at concentration of 40 µM. NIR fluorescent nanoparticles were aliquoted (100 µL) into 1 mL of PBS in a plastic cuvette and analyzed by absorption and fluorescence.
A stock solution of PPCy-C8 was prepared in DCM (26 mM). An aliquot 10 µL were diluted 200 times with chloroform, DCM, ethanol and methanol in quartz cuvette and the spectra (absorption, fluorescence) were recorded. FLT of the solutions was measured using Nanoled 700 nm (Horiba) for excitation and 775 nm filter for emission. For aggregation study, 70 µL of 0.5 mM of PPCy-C8 in DCM were added to a quartz cuvette filled with 1930 µL of methanol for a total concentration of 17 µM. Dye concentration and absorption coefficients within PFC nanoparticles were determined by absorption spectroscopy for the nanoparticles and after extraction with DMSO or DCM. Fluorescence quantum yield of the nanoparticles was determined with reference to ICG, which has a quantum yield of 0.01 in water.30
In vitro photoacoustic imaging
For measurement of PA signal from nanoparticles, Tygon® tubes were filled with aqueous suspensions of PPCy-C8 nanoparticles, cypate-C18 PFC NPs or dye-free nanoparticles and one tube filled with whole blood. The sealed tubes were embedded in a water bath.. PA amplitude from nanoparticle solutions was measured and compared with blood for PA contrast at 767 nm excitation using a PA imaging system and method as previously described.34
Animal models
All animal studies were approved by the animal studies committee at Washington University School of Medicine. Sprague-Dawley rats (Harlan, Indianapolis, IN) were anesthetized with ketamine and xylazine cocktail (87 mg/kg and 13 mg/kg, respectively, IP). Hair over the axillary region was removed by gentle clipping and depilatory cream. Contrast agent solutions (0.05 mL) were injected subcutaneously in the forepaw prior to imaging. For fluorescence imaging, rats were injected on both sides while for PAT rats were injected in the left forepaw only. Imaging was performed immediately after injection up to 4 hours after injection and again at 24 hours after injection.
In vivo fluorescence imaging
Fluorescence imaging was performed with the eXplore Optix time-domain diffuse optical imaging system (ART, Montreal, Canada). Animals were placed on the heated imaging platform and adjusted for optimal height. Pre-injection scans (n=2) were acquired of the axillary region with laser power of 500 µW and integration time of 0.3 s. Post-injection scans were acquired at 1 and 4 hours after injection for free dyes and 1 and 24 hours after injection for nanoparticles. Absorption and emission scans were performed sequentially for all acquisitions. Integration time was kept at 0.3 s per step while laser power was adjusted to achieve adequate signal strength for FLT measurement. Step size was 1 to 3 mm per step. Fluorescence intensity and lifetime maps were constructed from acquired data by integration or curve fitting of the fluorescence temporal point spread function (TPSF), respectively, using Optiview software (ART, Montreal, Canada) as previously described.31 Fluorescence intensity values are reported in counts per second and were normalized to laser power and integration time. Mean fluorescence intensity and FLT values were determined by ROI analysis.
In vivo photoacoustic imaging
After promising in vitro contrast with PPCy-C8 loaded nanoparticles, in vivo PA imaging was performed. The three-dimensional PA imaging system is detailed in a previous publication.15 A light wavelength of 767 nm was used for most of the experiments, but optical wavelengths were tuned from 747 to 801 nm for spectroscopic analysis. For imaging surrounding blood vessels, an optical wavelength of 570 nm was used. The light fluence on the skin was 4 mJ/cm2, within the current ANSI limit. A single-element 5-MHz (for sentinel lymph node imaging, V308, Panametrics-NDT) or 50-MHz (for surrounding vasculature imaging, V214-BB-RM, Panametrics-NDT) ultrasound transducer was used as an ultrasonic detector. Axial spatial resolutions of the 5-MHz and 50-MHz PA imaging systems are 144 and 15 µm, and lateral resolutions are 560 and 45 µm, respectively. The time of arrival of PA waves provides one-dimensional depth-sensitive images (A-line). Mechanical raster scanning in two lateral directions enables to form depth-resolved cross-sectional images (B-scans) and three-dimensional images. Volumetric images were expressed via maximum amplitude projection (MAP), which projected the maximum signal along each A-line onto the corresponding two-dimensional plane. The imaging acquisition time for a 25 mm × 30 mm field of view was about 25 minutes. PPCy-C8 nanoparticle solutions (0.5 mg) were administered by injection in the footpads of rats as described above. A series of PA images were acquired to 3 h post-injection, and we obtained another PA image at 24 h post-injection. The differential images of the SLNs before and after injection (i.e., images after injection minus images before injection) were overlaid on the images of blood vessels.
Animals were euthanized after final imaging time points at 24 hours (nanoparticles) and 4 hours (small molecules) after injection. Ex vivo fluorescence imaging of lymph nodes was performed with the Kodak IS4000MM planar reflectance imaging system (Carestream Health, New Haven, CT) with 755 nm excitation and 830 nm emission detection. Ex vivo PAT was performed by embedding dissected lymph nodes in gelatin phantom and imaging. For comparison of fluorescence and PAT contrast, gelatin-embedded lymph nodes were also imaged with planar reflectance imaging system.
Supplementary Material
Acknowledgements
These studies were funded in part by grants from the NIH (R01 EB008111, R01 EB008458 to S.A., and R01 EB000712, R01 EB008085, R01 CA134539, U54 CA136398, R01 EB010049, and 5P60 DK02057933 to L.V.W). L.V.W. has a financial interest in Microphotoacoustics, Inc. and in Endra, Inc., which, however, did not support this work.
Footnotes
Supporting Information Available: Figures depicting spectroscopic analysis of PPCy-C8 free dye and after extraction from PFC-based nanoparticles, absorption spectra of PPCy-C8 in methanol over time and absorption spectra of PPCy-C8 in methanol water solutions. This material is available free of charge via the Internet at http://pubs.acs.org.
REFERENCES
- 1.Phan GQ, Messina JL, Sondak VK, Zager JS. Sentinel Lymph Node Biopsy for Melanoma: Indications and Rationale. Cancer Control. 2009;16:234–239. doi: 10.1177/107327480901600305. [DOI] [PubMed] [Google Scholar]
- 2.Oonk MH, van de Nieuwenhof HP, de Hullu JA, van der Zee AG. The Role of Sentinel Node Biopsy in Gynecological Cancer: A Review. Curr. Opin. Oncol. 2009;21:425–432. doi: 10.1097/CCO.0b013e32832f3d53. [DOI] [PubMed] [Google Scholar]
- 3.Amersi F, Hansen NM. The Benefits and Limitations of Sentinel Lymph Node Biopsy. Curr. Treat. Options Oncol. 2006;7:141–151. doi: 10.1007/s11864-006-0049-y. [DOI] [PubMed] [Google Scholar]
- 4.Beri A, Janetschek G. Technology Insight: Radioguided Sentinel Lymph Node Dissection in the Staging of Prostate Cancer. Nat. Clin. Pract. Urol. 2006;3:602–610. doi: 10.1038/ncpuro0625. [DOI] [PubMed] [Google Scholar]
- 5.Winter A, Wawroschek F. Lymphadenectomy in Prostate Cancer. Radio-Guided Lymph Node Mapping: An Adequate Staging Method. Front. Radiat. Ther. Oncol. 2008;41:58–67. doi: 10.1159/000139879. [DOI] [PubMed] [Google Scholar]
- 6.Tsopelas C. Particle Size Analysis of (99m)Tc-Labeled and Unlabeled Antimony Trisulfide and Rhenium Sulfide Colloids Intended for Lymphoscintigraphic Application. J. Nucl. Med. 2001;42:460–466. [PubMed] [Google Scholar]
- 7.Wilhelm AJ, Mijnhout GS, Franssen EJ. Radiopharmaceuticals in Sentinel Lymph-Node Detection - an Overview. Eur. J. Nucl. Med. 1999;26:S36–S42. doi: 10.1007/pl00014793. [DOI] [PubMed] [Google Scholar]
- 8.Thevarajah S, Huston TL, Simmons RM. A Comparison of the Adverse Reactions Associated with Isosulfan Blue Versus Methylene Blue Dye in Sentinel Lymph Node Biopsy for Breast Cancer. Am. J. Surg. 2005;189:236–239. doi: 10.1016/j.amjsurg.2004.06.042. [DOI] [PubMed] [Google Scholar]
- 9.Simmons R, Thevarajah S, Brennan MB, Christos P, Osborne M. Methylene Blue Dye as an Alternative to Isosulfan Blue Dye for Sentinel Lymph Node Localization. Ann. Surg. Oncol. 2003;10:242–247. doi: 10.1245/aso.2003.04.021. [DOI] [PubMed] [Google Scholar]
- 10.Cochran AJ, Huang RR, Guo J, Wen DR. Current Practice and Future Directions in Pathology and Laboratory Evaluation of the Sentinel Node. Ann. Surg. Oncol. 2001;8:13S–17S. [PubMed] [Google Scholar]
- 11.Douglas-Jones AG, Woods V. Molecular Assessment of Sentinel Lymph Node in Breast Cancer Management. Histopathology. 2009;55:107–113. doi: 10.1111/j.1365-2559.2008.03218.x. [DOI] [PubMed] [Google Scholar]
- 12.Viale G, Bosari S, Mazzarol G, Galimberti V, Luini A, Veronesi P, Paganelli G, Bedoni M, Orvieto E. Intraoperative Examination of Axillary Sentinel Lymph Nodes in Breast Carcinoma Patients. Cancer. 1999;85:2433–2438. [PubMed] [Google Scholar]
- 13.Rasmussen JC, Tan IC, Marshall MV, Fife CE, Sevick-Muraca EM. Lymphatic Imaging in Humans with near-Infrared Fluorescence. Curr. Opin. Biotechnol. 2009;20:74–82. doi: 10.1016/j.copbio.2009.01.009. [DOI] [PMC free article] [PubMed] [Google Scholar]
- 14.Troyan SL, Kianzad V, Gibbs-Strauss SL, Gioux S, Matsui A, Oketokoun R, Ngo L, Khamene A, Azar F, Frangioni JV. The Flare Intraoperative near-Infrared Fluorescence Imaging System: A First-in-Human Clinical Trial in Breast Cancer Sentinel Lymph Node Mapping. Ann. Surg. Oncol. 2009;16:2943–2952. doi: 10.1245/s10434-009-0594-2. [DOI] [PMC free article] [PubMed] [Google Scholar]
- 15.Song KH, Stein EW, Margenthaler JA, Wang LV. Noninvasive Photoacoustic Identification of Sentinel Lymph Nodes Containing Methylene Blue in Vivo in a Rat Model. J. Biomed. Opt. 2008;13 doi: 10.1117/1.2976427. 054033. [DOI] [PMC free article] [PubMed] [Google Scholar]
- 16.Kim C, Favazza C, Wang LV. In Vivo Photoacoustic Tomography of Chemicals: High-Resolution Functional and Molecular Optical Imaging at New Depths. Chem. Rev. 2010;110:2756–2782. doi: 10.1021/cr900266s. [DOI] [PMC free article] [PubMed] [Google Scholar]
- 17.Hirche C, Murawa D, Mohr Z, Kneif S, Hunerbein M. Icg Fluorescence-Guided Sentinel Node Biopsy for Axillary Nodal Staging in Breast Cancer. Breast Cancer Res. Treat. 2010;121:373–378. doi: 10.1007/s10549-010-0760-z. [DOI] [PubMed] [Google Scholar]
- 18.Jain R, Dandekar P, Patravale V. Diagnostic Nanocarriers for Sentinel Lymph Node Imaging. J. Control Release. 2009;138:90–102. doi: 10.1016/j.jconrel.2009.05.010. [DOI] [PubMed] [Google Scholar]
- 19.Hung JC, Wiseman GA, Wahner HW, Mullan BP, Taggart TR, Dunn WL. Filtered Technetium-99m-Sulfur Colloid Evaluated for Lymphoscintigraphy. J. Nucl. Med. 1995;36:1895–1901. [PubMed] [Google Scholar]
- 20.Phillips WT, Klipper R, Goins B. Use of (99m)Tc-Labeled Liposomes Encapsulating Blue Dye for Identification of the Sentinel Lymph Node. J. Nucl. Med. 2001;42:446–451. [PubMed] [Google Scholar]
- 21.Tran TD, Caruthers SD, Hughes M, Marsh JN, Cyrus T, Winter PM, Neubauer AM, Wickline SA, Lanza GM. Clinical Applications of Perfluorocarbon Nanoparticles for Molecular Imaging and Targeted Therapeutics. Int. J. Nanomedicine. 2007;2:515–526. [PMC free article] [PubMed] [Google Scholar]
- 22.Kaneda MM, Caruthers S, Lanza GM, Wickline SA. Perfluorocarbon Nanoemulsions for Quantitative Molecular Imaging and Targeted Therapeutics. Ann. Biomed. Eng. 2009;37:1922–1933. doi: 10.1007/s10439-009-9643-z. [DOI] [PMC free article] [PubMed] [Google Scholar]
- 23.Akers WJ, Zhang Z, Berezin M, Ye Y, Agee A, Guo K, Fuhrhop RW, Wickline SA, Lanza GM, Achilefu S. Targeting of Aνβ3-Integrins Expressed on Tumor Tissue and Neovasculature Using Fluorescent Small Molecules and Nanoparticles. Nanomedicine. 2010;5:715–726. doi: 10.2217/nnm.10.38. [DOI] [PMC free article] [PubMed] [Google Scholar]
- 24.Kim C, Song KH, Gao F, Wang LV. Sentinel Lymph Nodes and Lymphatic Vessels: Noninvasive Dual-Modality in Vivo Mapping by Using Indocyanine Green in Rats--Volumetric Spectroscopic Photoacoustic Imaging and Planar Fluorescence Imaging. Radiology. 2010;255:442–450. doi: 10.1148/radiol.10090281. [DOI] [PMC free article] [PubMed] [Google Scholar]
- 25.Zhang Z, Chen J, Ding L, Jin H, Lovell JF, Corbin IR, Cao W, Lo PC, Yang M, Tsao MS, et al. Hdl-Mimicking Peptide-Lipid Nanoparticles with Improved Tumor Targeting. Small. 2010;6:430–437. doi: 10.1002/smll.200901515. [DOI] [PubMed] [Google Scholar]
- 26.Lim YT, Noh YW, Han JH, Cai QY, Yoon KH, Chung BH. Biocompatible Polymer-Nanoparticle-Based Bimodal Imaging Contrast Agents for the Labeling and Tracking of Dendritic Cells. Small. 2008;4:1640–1645. doi: 10.1002/smll.200800582. [DOI] [PubMed] [Google Scholar]
- 27.Winter PM, Caruthers SD, Kassner A, Harris TD, Chinen LK, Allen JS, Lacy EK, Zhang H, Robertson JD, Wickline SA, et al. Molecular Imaging of Angiogenesis in Nascent Vx-2 Rabbit Tumors Using a Novel Alpha(Nu)Beta3-Targeted Nanoparticle and 1.5 Tesla Magnetic Resonance Imaging. Cancer Res. 2003;63:5838–5843. [PubMed] [Google Scholar]
- 28.Fischer GM, Ehlers AP, Zumbusch A, Daltrozzo E. Near-Infrared Dyes and Fluorophores Based on Diketopyrrolopyrroles. Angew. Chem. Int. Ed. Engl. 2007;46:3750–3753. doi: 10.1002/anie.200604763. [DOI] [PubMed] [Google Scholar]
- 29.Berezin MY, Akers WJ, Guo K, Fischer GM, Daltrozzo E, Zumbusch A, Achilefu S. Long Fluorescence Lifetime Molecular Probes Based on near Infrared Pyrrolopyrrole Cyanine Fluorophores for in Vivo Imaging. Biophys. J. 2009;97:L22–L24. doi: 10.1016/j.bpj.2009.08.022. [DOI] [PMC free article] [PubMed] [Google Scholar]
- 30.Berezin MY, Lee H, Akers W, Achilefu S. Near Infrared Dyes as Lifetime Solvatochromic Probes for Micropolarity Measurements of Biological Systems. Biophys. J. 2007;93:2892–2899. doi: 10.1529/biophysj.107.111609. [DOI] [PMC free article] [PubMed] [Google Scholar]
- 31.Almutairi A, Akers WJ, Berezin MY, Achilefu S, Frechet JM. Monitoring the Biodegradation of Dendritic near-Infrared Nanoprobes by in Vivo Fluorescence Imaging. Mol. Pharm. 2008;5:1103–1110. doi: 10.1021/mp8000952. [DOI] [PMC free article] [PubMed] [Google Scholar]
- 32.Ye Y, Li WP, Anderson CJ, Kao J, Nikiforovich GV, Achilefu S. Synthesis and Characterization of a Macrocyclic near-Infrared Optical Scaffold. J. Am. Chem. Soc. 2003;125:7766–7767. doi: 10.1021/ja034186o. [DOI] [PubMed] [Google Scholar]
- 33.Fischer GM, Isomaki-Krondahl M, Gottker-Schnetmann I, Daltrozzo E, Zumbusch A. Pyrrolopyrrole Cyanine Dyes: A New Class of near-Infrared Dyes and Fluorophores. Chemistry. 2009;15:4857–4864. doi: 10.1002/chem.200801996. [DOI] [PubMed] [Google Scholar]
- 34.Cho EC, Kim C, Zhou F, Cobley CM, Song KH, Chen JY, Li ZY, Wang LHV, Xia YN. Measuring the Optical Absorption Cross Sections of Au-Ag Nanocages and Au Nanorods by Photoacoustic Imaging. J. Phys. Chem. C. 2009;113:9023–9028. doi: 10.1021/jp903343p. [DOI] [PMC free article] [PubMed] [Google Scholar]
Associated Data
This section collects any data citations, data availability statements, or supplementary materials included in this article.


