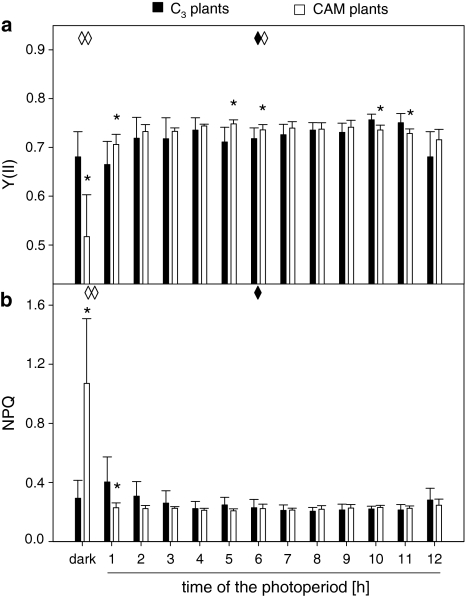
Fig. 1.
Diurnal changes in the quantum efficiency of PSII, Y(II) (a) and non-photochemical quenching, NPQ (b) in leaves M. crystallinum plants in C3 and CAM state. Values represent mean ± SD (n ≥ 9). Sign “asterisk” highlights a significant difference between C3 and CAM plants at the same time of the day, as revealed by t test at P < 0.05. Sign “filled diamond” indicates significant differences in a diurnal pattern of C3 plants at specific time points (12 h of dark, 6 and 12 h of light) in comparison to the value from first hour of light, as revealed by t test at P < 0.05. Signs “open diamond” and “open double diamond” indicate significant differences in a diurnal pattern of CAM plants at specific time points (12 h of dark, 6 and 12 h of light) in comparison to the value measured after the first hour of light, as revealed by t test at P < 0.05 and P < 0.001, respectively

