Abstract
We report cloning, expression in E. coli, and purification of cytochrome P450 from a deep-sea bacterium Photobacterium profundum strain SS9 (P450-SS9). The enzyme, which is predominately high-spin (86%) in the absence of any added ligand, binds fatty acids and their derivatives and exhibits the highest affinity for myristic acid. Binding of the majority of saturated fatty acids displaces the spin equilibrium further towards the high-spin state, whereas the interactions with unsaturated fatty acids and their derivatives (arachidonoyl glycine) have the opposite effect. Pressure perturbation studies showed that increasing pressure fails to displace the spin equilibrium completely to the low-spin state in the ligand-free P450-SS9 or in the complexes with either myristic acid or arachidonoyl glycine. Stabilization of high-spin P450-SS9 signifies a pressure-induced transition to a state with reduced accessibility of the active site. This transition, which is apparently associated with substantial hydration of the protein, is characterized by the reaction volume change (ΔV) around −100 – −200 mL/mol and P½ of 300-800 bar, which is close to the pressure of habitation of P. profundum. The transition to a state with confined water accessibility is hypothesized to represent a common feature of cytochromes P450 that serves to coordinate heme pocket hydration with ligand binding and the redox state. Displacement of the conformational equilibrium towards the “closed” state in P450-SS9 (even ligand-free) may have evolved to allow the protein to adapt to enhanced protein hydration at high hydrostatic pressures.
The interactions of proteins with solvent and, in particular, changes in protein hydration due to intermolecular interactions and ligand-induced conformational rearrangements are known to be of fundamental functional importance (1-5). The fact that protein interactions with solvent are highly sensitive to hydrostatic pressure (6-10) warrants the use of a pressure-perturbation approach to study the dynamics of protein bound water and its role in protein-ligand, protein-protein, and protein-DNA interactions (1, 11-13). This approach is especially valuable for studies of heme proteins, where the presence of the heme chromophore allows the use of various spectroscopic techniques for monitoring the transitions between different states of the enzyme. On the other hand, the sensitivity of protein hydration to hydrostatic pressure creates a challenge for structural adaptation of proteins from piezophilic organisms, such as deep-sea bacteria, in order to function at extreme pressures. The role of this adaptation is especially important in the case of proteins whose functional mechanisms involve hydration-dehydration dynamics. The structural and functional comparison of proteins from deep-sea organisms with their homologs from non-piezophilic species may help to elucidate the functional role of protein hydration and provide important information on the dynamics of protein-bound water in enzymatic mechanisms, ligand-induced conformational transitions, and protein-protein interactions.
In the present study we employ this concept for exploration of the mechanisms of enzyme-substrate interactions and associated conformational transitions in cytochromes P450, the hemethiolate enzymes that catalyze the oxidation of a wide variety of exogenous and endogenous lipophilic compounds and are present in all 5 kingdoms of life. The fundamental functional importance of the changes in water accessibility and the degree of active site hydration during the catalytic cycle of cytochromes P450 is well established (14-17). Application of elevated pressure to ferric cytochromes P450 is known to induce a reversible displacement of the spin equilibrium towards the low spin state (15, 18-22). A second barotropic process, which takes place at higher pressures and is not completely reversible, was identified as the conversion of cytochromes P450 into their inactive state known as cytochrome P420 (15, 21, 23, 24). The effect of pressure-induced changes on the content of the high spin form of cytochrome P450 in the presence of substrates reflects two concomitant processes – the dissociation of the enzyme-substrate complex and the changes in the spin equilibrium of both substrate-free and substrate-bound enzyme. The substrate-free states of cytochromes P450 exhibit values of standard volume change in the high-to-low spin transition (ΔVospin) in the range of −14 – −30 mL/mol (10, 21, 25, 26), which is consistent with expulsion of one molecule of water per molecule of enzyme (18 ml/mol). The value of ΔVospin for the complexes of cytochromes P450 is shown to be in linear correlation with the change in Gibbs energy of the spin transition (ΔGospin). Consequently, the substrate complexes characterized by a high content of the high-spin state are characterized by larger reaction volume changes in spin transition (22).
Our recent studies of human cytochrome P450 3A4 (CYP3A4) and bacterial cytochrome P450eryF (P450eryF) revealed an important difference from other P450 enzymes studied. These enzymes exhibit a well-pronounced cooperativity in ligand binding (see (27) for review) and a pressure-dependent equilibrium between two conformational states that differ considerably in the values of ΔVospin (25). Unusual stabilization of the high-spin state in substrate-bound CYP3A4 and P450eryF indicates a reduced solvent accessibility to the heme pocket in the complexes of these heme proteins with allosteric substrates. A pronounced effect of hydrostatic pressure on the cooperativity of CYP3A4 and P450eryF suggests an involvement of a pressure-sensitive conformational equilibrium in the mechanisms of P450 allostery (25, 26).
The cytochromes P450 from piezophilic organisms represent excellent subjects for the studies of pressure-sensitive conformational equilibria and their functional role in cytochromes P450. These heme proteins are expected to provide an example of structural adaptation to enhanced hydration at elevated pressures. Here we describe heterogeneous expression, isolation and purification of cytochrome P450 from the piezophilic bacterium Photobacterium profundum. We characterize this enzyme by probing its ability to bind various ligand (potential substrates)s and studying ligand-induced changes in spin equilibrium. We also use pressure-perturbation to study the role of the changes in protein hydration in ligand binding and spin transitions. These studies were prompted by the hypothesis that the adaptation to high hydrostatic pressures would alter the equilibrium between the open and closed conformers and therefore modify the dynamics of protein-bound water in substrate-induced transitions of the enzyme. Accordingly, the studies of the piezophilic cytochrome P450 enzymes may help to understand the general mechanisms of the functionally important changes in openness and accessibility of the heme pocket in substrate binding and catalysis in cytochromes P450.
Materials and Methods
Materials
The saturated fatty acids were from Acros Organics (Belgium). Arachidonic acid and arachidonoyl glycine were from Cayman Chemicals (Michigan, USA), and cis- parinaric was from Invitrogen (Oregon, USA). All other reagents were of ACS grade and used without additional purification. Genomic DNA of P. profundum strain SS9 was kindly provided by Dr. Douglas Bartlett from Scripps Institute of Oceanography, UCSD.
P450 cloning
The gene encoding P450-SS9 was obtained by amplification of the 3121790 gene from the chromosomal DNA of P. profundum using the oligonucleotides GCGGAATTCCATATGATGACGGAGTCAGTGGTACGGGA (SS9-NdeI-forward) and GCGGAGCTCGCGGCCGCTCTGCCCACAGGTTTGAGTC (SS9-NotI-reverse). The 1.5 kb PCR product was purified on a 0.8% agarose gel and digested with the corresponding restriction enzymes and inserted into pET29a (Novagen). The resulting plasmid, which also encodes a hexa-histidine tag at the C-terminus, is called pET29-P450SS9. The nucleotide sequence of the amplified gene was verified by DNA sequencing and found to be identical to the genomic sequence.
Expression and purification of P450-SS9
The enzyme was expressed in E. coli HMS173(DE3) using cells harboring the pET29-P450SS9 plasmid. Two liters of bacterial cultures were grown to mid-log phase (OD600≈0.6) and supplemented with 80 μg/ml of γ-ALA. Protein expression was induced by the addition of IPTG to a final concentration of 0.5 mM. Cells were grown for an additional 48 h at 25 °C and harvested by centrifugation. Crude extracts were prepared by resuspending the cell pellet in 5 volumes of 100 mM Hepes, pH 7.4, containing 400 mM NaCl, following by sonication of the cell suspension. The extracts were clarified from cell debris by centrifugation for 1 h at 100,000 g at 4 °C. The extracts were diluted with 100 mM HEPES pH 7.4 to decrease the NaCl concentration to 200 mM, passed through a column of DEAE cellulose equilibrated with the loading buffer, and loaded onto a nickel-NTA resin (Qiagen, USA) using the batch procedure. The column containing the protein-bound resin was washed consequently with 10 volumes of resuspension buffer, 5 volumes of 100 mM Hepes pH 7.4 buffer, 5 volumes of the same buffer containing 50 mM imidazole, and then eluted with the same buffer containing 250 mM imidazole. The P450-SS9-containing fractions were pooled and concentrated. The protein was transferred into storage buffer (100 mM Hepes, pH 7.4, 100 mM NaCl, 20% glycerol) by gel-filtration and stored at −80 °C. The yield of the purification procedure was approximately 200 nmol of the P450 protein per 1 L of the growth culture.
Conditions of the titration and pressure-perturbation experiments
All experiments were performed at 25 °C in 0.1 M Na-Hepes, pH 7.4, containing 0.5mM EDTA. Ambient pressure measurements were performed with continuous stirring. Most of the fatty acids and their derivatives were used as 30 – 140 mM stock solutions in acetone.
Absorbance spectra
were recorded with a MC2000-2 CCD rapid scanning spectrometer (Ocean Optics Inc., Dunedin, FL). In the experiments at ambient pressure this instrument was equipped with a custom-made thermostated cell chamber with a magnetic stirrer and a L7893 UV-Vis fiber optics light source (Hamamatsu Photonics K.K., Japan).
Pressure-perturbation studies
were performed as described (26) using a custom-built high-pressure optical cell (28) connected to a manual pressure generator (High Pressure Equipment, Erie, PA) capable of generating a pressure of up to 6000 bar.
Analysis of series of spectra
obtained in absorbance spectroscopy experiments was done using a principal component analysis (PCA) method, which is also known as singular value decomposition (SVD) technique, as described earlier (21, 29). To interpret the spectral transitions in terms of the changes in the concentration of P450 species, we used a least-squares fitting of the spectra of principal components by the set of the spectral standards of pure high-spin, low-spin and P420 species of the heme protein (21, 29, 30). In the case of pressure-perturbation studies the series of spectra were corrected for solvent compression as described (24).
Fitting of the titration curves
obtained in our absorbance titration and pressure-perturbation experiments was done with the use of the equation for the isotherm of bimolecular association ((31) p 73, eq. II-53), which is also known as “tight binding” or “square root equation”.
Interpretation of the effect of pressure on spin equilibrium and ligand binding
was based on the canonical equation for pressure dependence of the constant of chemical equilibrium: Our interpretation of the pressure-induced changes is based on the equation for the pressure dependence of the equilibrium constant (10) eq. 1:
| (1) |
or in integral form, (32), p. 212, eq. 9:
| (2) |
Here Keq is the equilibrium constant of the reaction at pressure P, P½ is the pressure at which Keq = 1 (“half pressure” of the conversion), ΔVo is the standard molar reaction volume, and Koeq is the equilibrium constant extrapolated to zero pressure, Koeq = eP½ΔVo/RT . For the equilibrium A⇌B and Koeq =[B]/[A] equation (2) may be transformed into the following relationship:
| (3) |
where C0=[A]+[B].
For the analysis of the effect of pressure on the equilibrium of ligand binding, we used equation (2) combined with the equation for the isotherm of bimolecular association (see above).
All data treatment and fitting, as well as the data acquisition were performed using our custom designed software (21) rewritten for Windows-XP® environment using Borland Delphi 7 from Borland Corporation (Scotts Valley, CA) and Win32Forth Public Domain Forth interpreter (www.win32forth.org).
Results and Discussion
Identification of cytochromes P450 in the known genomes of deep-see bacteria and selection of the cytochrome P450 species
There are approximately 20 either complete or partial genomes of deep-sea bacteria available (see https://moore.jcvi.org/moore/ and http://genamics.com/genomes/index.htm for partial lists). A search of these genomes revealed three piezophilic microorganisms encoding putative cytochrome P450 proteins, namely Moritella sp. strain PE36, Photobacterium profundum strains SS9 (33), and Roseobacter sp. strain SK209-2-6 (34). Genomes of Moritella and Photobacterium contain one P450-encoding sequence each. In addition, the genome of the shallow water strain of Photobacterium, P. profundum 3TCK, also contains a putative P450 protein, which is 97% identical to the one from P. profundum SS9 and contains only 5 non-conservative substitutions. The protein from Moritella displays a reasonable degree of homology to Photobacterium proteins (46% identity, 68% similarity). Denitrifying bacteria Roseobacter sp. encodes at least 7 very diverse cytochromes P450. One of those proteins (GenBank identifier EBA17647) reveals a reasonable homology with cytochromes P450 from either Moritella or Photobacterium (26-27% identity, 46-47% similarity). A BLAST search with those sequences through the genome database showed that all four proteins have the closest homology to P450s known to be fatty acid hydroxylases, such as murine P450 4V3, human P450 4X1, or P450BM-3 from Bacillus megaterium, or cholesterol hydroxylases, such as human P450 46A1.
According to the above analysis, the four proteins from piezophilic strains of Photobacterium, Moritella and Roseobacter form a group of putative fatty acid hydroxylases from bacteria with different degree of piezophily. All four microorganisms are sea-water bacteria living at different pressures, where Moritella PE32 is an obligatory piezophile found at a depth of 3600 m (35), P. profundum SS9 is a facultative piezophile isolated at a depth of 2500 m (36), P. profundum 3TCK is a shallow water bacteria (37), and Roseobacter sp. SK209-2-6 is found at a depth of approx 270 m (38). This group of proteins therefore represents an appropriate target for comparative research focused on the mechanism of structural adaptation of cytochromes P450 to high hydrostatic pressures and the role of protein hydration in the function of cytochromes P450. The sequences of the four putative cytochrome P450 proteins aligned together with the sequence of the heme domain of cytochrome P450BM-3 (CYP102) are shown in Fig. S1 found in Supporting Information.
The barotropic adaptation of the two strains of P. profundum is the most extensively studied (33), and the pair of putative P450 proteins from these strains provides a good example of closely related proteins with different degrees of adaptation to high hydrostatic pressure. Therefore, we elected to start our work with expression, purification and characterization of putative fatty acid hydroxylating cytochrome P450 from the piezophilic P. profundum strain SS9 (P450-SS9).
Expression, purification and characterization of the spectral properties of P450-SS9
P450-SS9 cDNA was amplified and incorporated into a pET29a plasmid and expressed in E. coli as described in Materials and Methods. The expression level of the P450-SS9-His6 heme protein determined from CO-difference spectra of the cell extract was about 200 nmol per liter of culture.
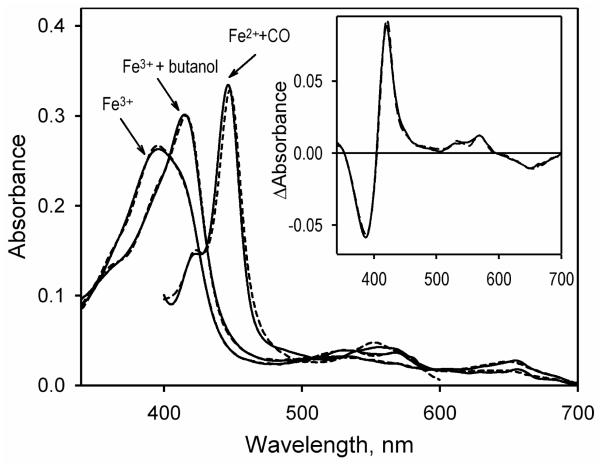
The heme protein absorbance in the Soret region may be adequately approximated with a combination of spectral standards obtained earlier for the heme domain of P450BM-3 (22) (BMP, Fig. 1, dashed line). This approximation results in the estimate of 82 ± 1.8% for the content of the high spin state of the heme protein at room temperature. To probe the possibility that the high content of the high-spin state in the purified enzyme may be caused by the presence of some tightly bound endogenous ligand, we attempted to remove this hypothetical ligand with a high excess of Calbiosorb hydrophobic absorbent (EMD Chemicals, Gibbstown, NJ). This treatment, as well as an extensive dialysis against the buffer with added Calbiosorb beads, had no effect on the spin state of the protein (data not shown). Therefore, the presence of an endogenous ligand in the preparation seems unlikely, and the high content of the high-spin state appears to be an intrinsic feature of the ligand-free P450-SS9.
Figure 1.
Absorbance spectra of P450-SS9. The spectra of the substrate-free ferric P450-SS9, its complex with n-butanol, and the ferrous carbonyl complex are shown in solid lines. Dashed lines show the approximations of the spectra with combinations of the spectral standards obtained for the heme domain of P450BM-3 (22). The inset shows the butanol-induced difference spectrum (solid line) and its approximation with the prototypic spectra of high-to-low spin transitions obtained for P450BM-3 (dashed line). The spectra were recorded at 25 °C in 100 mM Na-Hepes buffer, pH 7.4, with 1 cm path length and the protein concentration of ~2 μM.
Similar to reports on other cytochromes P450 (39), addition of alcohols results in a complete transition of the enzyme to the low spin state (Fig 1). Here again, the butanol-induced difference spectrum may be adequately approximated with the prototypic spectral standards for cytochrome P450BM-3 (Fig 1, inset). The absorbance spectrum of the ferrous carboxy-complex of the heme protein (fig. 1b) has a Soret maximum at 445.5 nm. To our knowledge this is the most “blue-shifted” position of the Soret absorbance band ever reported for cytochromes P450, which usually have this band centered at 447-452 nm. This unusual short-wavelength position may indicate a very non-polar environment of the heme chromophore (40).
Interactions of P450-SS9 with fatty acids and their derivatives
As stated above, the preliminary analysis of P450-SS9 sequence homology with other known cytochromes results in a presumption that P450-SS9 might be involved in the metabolism of fatty acids or isoprenoids. Therefore, we commenced our search for high-affinity ligands and potential substrates of P450-SS9 by probing its interactions with fatty acids and their derivatives.
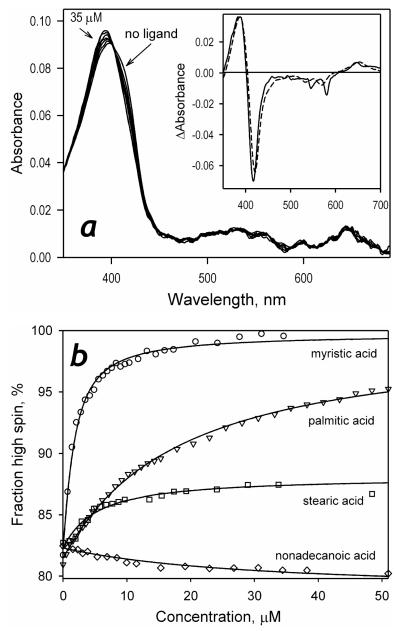
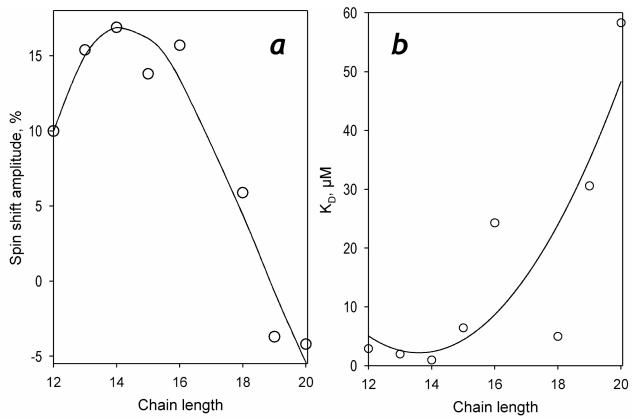
As shown in Fig. 2, the interactions of P450-SS9 with most of the saturated fatty acids tested in this study results in a spectral transition indicative of a low- to-high spin shift. Principal component analysis applied to the series of spectra obtained in these titrations yields a first principal component that covers over 99.8% of the observed changes. The spectrum of this principal component (Fig. 2a, inset) may be adequately approximated (ρ>0.995) with a prototypical spectrum of the low-to-high spin transition obtained with cytochrome P450BM-3 (22). The effect of the carbon chain length on the affinity of fatty acids to P450-SS9 and the maximal amplitude of ligand-induced spin shift (ΔHSmax) is illustrated in Table 1 and Fig. 3. The values of KD of the complexes of P450-SS9 with the fatty acids with the chain length of 12-18 carbon atoms falls into the range of 1 – 25 μM (Fig. 3, Table 1), which is typical of known fatty acid hydroxylases, such as P450BM-3 (41, 42), P450foxy (43) or P450 4A1 (44, 45). As illustrated in Fig. 3a, the chain length of 12-15 carbon atoms appears to be optimal for the interactions, and the highest affinity (KD = 0.97 ± 0.42 μM) is observed with myristic acid (n = 14). This ligand also elicits maximal amplitude of the spin shift in P450-SS9, so that the enzyme saturated with myristic acid is essentially 100% high-spin. Increase in the chain length decreases the spin shift amplitude and, quite unexpectedly, the direction of the ligand-induced changes reverses at the chain length longer than 18 carbons (Fig. 3b). Interaction of P450-SS9 with nonadecanoic acid (n=19), which retains a reasonable affinity for the enzyme, results in a distinct inverse spin shift with the maximal amplitude of ~4% (data not shown).
Figure 2.
Interactions of P450-SS9 with saturated fatty acids. A series of absorbance spectra obtained in a titration of 1 μM P450-SS9 with myristic acid is shown in panel a. The inset shows the spectrum of the first principal component of the observed changes (insert) along with its approximation with the prototypic spectra of low-to-high spin transitions in P450BM-3 (dashed line). Panel b represents the titration curves of 0.8-1.2 μM P450-SS9 with a series of saturated fatty acids along with their approximations using the equation for the equilibrium of binary association.
Table 1.
Parameters of the interactions of P450-SS9 with fatty acids and their derivatives*
| Ligand | Chain length | N of double bonds |
KD | Spin shift amplitude, % |
|---|---|---|---|---|
| myristic acid palmitic acid |
14 16 |
0 0 |
0.97± 0.42 24.3± 8.2 |
16.9 ± 1.2 15.7 ± 2.6 |
| cis-paraniric acid arachidonic acid |
18 20 |
4 4 |
101.7± 16.5 19.2± 4.2 |
−39.7 ± 4.8 −11.8 ± 2.3 |
| arachydonil glycine oleoyl glycine |
20 18 |
4 1 |
16.7± 0.1 49.5± 30.0 |
−34.4 ± 5.5 −13.1 ± 3.2 |
The values given in the table represent the averages of 2-5 individual measurements, and the “±” values show the confidence interval calculated for p = 0.05.
Figure 3.
The amplitude of the spin shift (a) and the dissociation constant (b) characterizing the interactions of P450-SS9 shown as a function of the length of the alkyl chain. The solid lines represent the approximation of the data sets with a third-order polynomial. These approximations have no interpretative meaning and are shown only to illustrate the general trend of the dependencies.
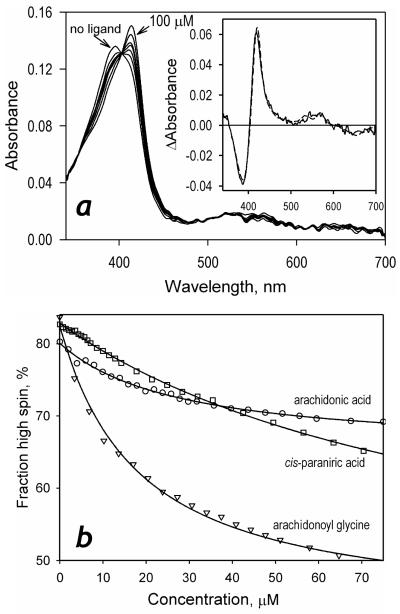
We also probed the interactions of P450-SS9 with unsaturated fatty acids and their derivatives. Here, again, the direction of the resulting spin shift was opposite to that observed with short-chain saturated fatty acids. The highest affinity and the highest amplitude of the high-to-low spin shift were observed with arachidonoyl glycine (Fig. 4, Table 1).
Figure 4.
Interactions of P450-SS9 with unsaturated fatty acids and arachidonoyl glycine. A series of absorbance spectra obtained in a titration of 1.8 μM P450-SS9 with arachidonoyl glycine is shown in panel a. The inset shows the spectrum of the first principal component of the observed changes (insert) along with its approximation with the prototypic spectra of high-to-low spin transitions in P450BM-3 (dashed line). Panel b represents the titration curves of 0.8-1.8 μM P450-SS9 with a series of saturated fatty acids along with their approximations using the equation for the equilibrium of binary association.
The reverse in direction of the ligand-induced spin shift with an increase in the length of the acyl chain or with a transition from saturated to unsaturated fatty acids is interesting and unexpected. Although the dependence of the spin shift amplitude on the bulkiness and geometry of a substrate molecule is well-documented for such P450 enzymes as P450cam (46) or P450 2B4 (47, 48), such an inverse is unprecedented. A likely reason for the opposite direction of the spin shift in P450-SS9 is a physical blockage of the enzyme water access channel by a long fatty acid chain, so that the water molecule that serves as the 6-th ligand becomes confined in the heme pocket and the spin equilibrium of the heme iron shifts towards the water-bound 6-coordinated low-spin state. This feature, along with the unusually blue-shifted position of the Soret band of the ferrous carbonyl complex and the predominant high-spin state of the ferric ligand-free enzyme, apparently indicate unusually low water occupancy and obstructed solvent accessibility of the heme pocket of P450-SS9. This constrained accessibility of the heme pocket of P450-SS9 is also demonstrated by unusually slow kinetics of bleaching (heme destruction) by hydrogen peroxide, so that the half-time of the bleaching process is approximately 20-fold longer than that characteristic for P450BM-3, a mesophylic fatty acid hydrohylase (49).
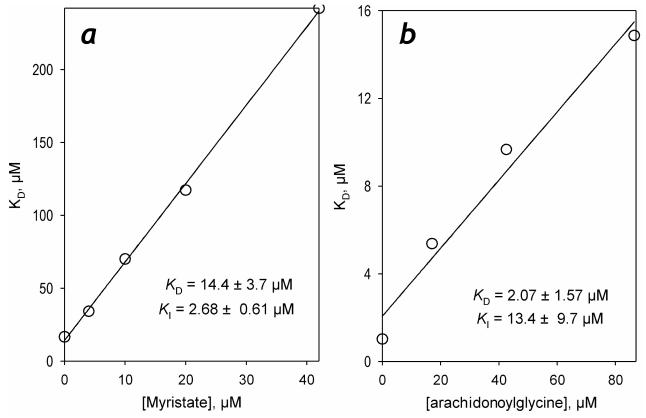
In order to ascertain whether the high-spin-inducing ligands (Type-I ligands) and the low-spin-inducing ones (reverse Type-I ligands) bind in one and the same binding site in the enzyme we probed the competition between myristic acid, a high-affinity Type-I ligand, and arachidonoyl glycine, a reverse Type-I ligand. In these experiments illustrated in Fig. 5, the mutual effect of myristic acid and arachidonoyl glycine was probed in a series of titrations of the enzyme by each of the two ligands in the presence of increasing concentrations of its counterpart. Linear dependences of the apparent KD of the enzyme complexes with each of the ligands on the concentration of the counterpart and a close conformity of the KI values found in competition experiments (Fig 5) to the respective estimates of KD (Table 1) suggest that the interactions are competitive and that both Type-I and reverse Type-I ligands indeed interact with one and the same binding site.
Figure 5.
Competition of myristic acid and arachidonoyl glycine for the interactions with P450-SS9. Mutual effects of myristic acid and arachidonoyl glycine on the effective constant of dissociation of the P450-SS9 complex with their counterparts are shown in panels a and b, respectively. Solid lines show the linear approximations of the data with the parameters (KI for the competitor and KD for the titrant) shown.
Pressure-induced transitions in P450-SS9
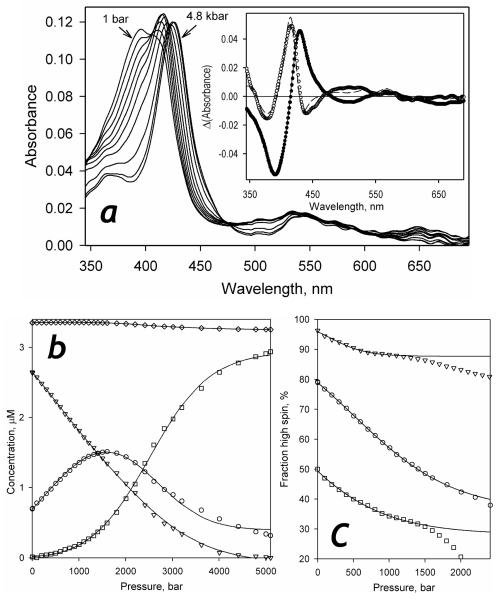
At first glance, the effect of hydrostatic pressure on the absorbance of P450-SS9 (Fig. 6a) is quite similar to that observed with other studied cytochromes P450 (10, 18, 21, 22, 25, 26). At the initial steps of pressure increase, the Soret band of the (predominately high-spin) heme protein is displaced from 393 to 416 nm, which is indicative of a pressure-induced spin shift towards the low-spin state. Similar to that observed with other P450 enzymes, this pressure induced spin shift was completely reversible upon decompression from pressures below 1500 bar (Fig. S2 in Supporting Information) At pressures above 1500 bar this process is complemented with a further gradual red shift of the Soret band, which reaches the position of approximately 427-428 nm at 4500-5000 bar. This second process is usually interpreted as a pressure-induced transition of the P450 state of the heme protein into the inactive P420 state, since its amplitude is proportional to the amount of cytochrome P420 found in the pressurized samples after decompression (21, 22).
Figure 6.
Pressure-induced transitions in P450-SS9 in the absence of substrate. Panel a represent a series of spectra recorded at pressures increasing from 1 to 2400 bar in 200 bar increments and then at 2800, 3200, 4000 and 4800 bar. The inset shows the first (closed circles) and the second (open circles) principal components found by PCA applied to this data set. Dashed lines represent the approximation of these spectra with the set of spectral standards obtained for P450-SS9 (see Supporting Information, Fig. S3) Conditions: 3.5 μM P450-SS9 in 0.1 M Na-Hepes buffer (pH 7.4), 0.5 mM EDTA, 25 °C. Panel b shows the corresponding changes in the concentration of the high-spin (triangles), low-spin (circles), and P420 (squares) states of P450-SS9 and the total hemoprotein concentration (diamonds). The pressure-induced changes in the fraction of the high-spin P450 at no substrate added (circles) and in the presence of 70 μM arachidonoyl glycine (squares) or myristic acid (triangles) are illustrated in panel c. The full set of corresponding spin changes for substrate complexes of P450-SS9 is found in Fig. 4S.
The application of the PCA procedure to series of spectra obtained in pressure-perturbation experiments resulted in two principal components (Fig. 6 inset), which account for over 99.6% of the pressure-induced spectral changes observed. The spectra of these two components may be adequately approximated with the spectral standards of the high- and low-spin P450 states complemented with the standard of pressure-generated ferric P420 BMP (22). However, despite high accuracy of this approximation, the use of P450BM-3 standards to interpret the pressure induced changes in P450-SS9 resulted in negative values for the concentration of the low-spin P450 state at pressures above 3000 bar, especially in the presence of arachidonoyl glycine. This observation prompted us to refine the set of spectral standards of P450-SS9 which would be applicable to the analysis of the pressure-induced transition of the enzyme. The resulting set of spectral standards obtained on the basis of the prototypical spectra of P450BM-3 (22) with the procedure similar to that used earlier in our studies with other P450 enzymes (21, 22, 29) may be found in the Supporting Information, Fig. S3. The approximation of the pressure-induced spectral transitions in P450-SS9 with this refined set of spectral standards is illustrated in the inset to Fig. 6.
Pressure-induced changes in the concentrations of the P450 high-spin, P450 low-spin and the apparent P420 states of P450-SS9 are shown in Fig. 6b. In accordance with the above preliminary analysis, pressure dependencies of the concentrations of the three states of the enzyme reveal a high-to-low spin transition at relatively low pressures followed by an apparent P450➔P420 transition with the amplitude of 84 ± 6% of the total content of the heme protein.
Similar to earlier findings with cytochromes P450 2B4 (CYP2B4) (21), P450BM-3 (22) and P450 3A4 (25), the pressure-induced P450➔P420 transition in P450 SS9 was partially reversible on decompression (see Fig. S4 in the Supplementary Information). In contrast to CYP2B4, P450BM-3 and CYP3A4, where the recovery of P450 state after decompression was slow, the maximal recovery in P450-SS9 was observed immediately upon decompression, but it did not exceed 30-40% of the pressure-induced P420 state. We may assume therefore, that the P420-like heme environment in pressure-induced P420 state of P450-SS9 is maintained by pressure-induced conformational transition, which reverses upon the pressure release. However, as an alternative to a relaxation to the “normal” P450 state, this meta-stable pressure-induced P420 may also give rise to a stable, “conventional” P420. Partial recovery of P450 state was confirmed by titration of the decompressed samples with myristic acid, where we observed a ligand-induced spin shift with an amplitude commensurate with the degree of P450 recovery. This spin shift reveals the binding of myristate with a KD similar to that characteristic of the intact enzyme (data not shown). At the same time, conversion of most of the P450-SS9 into this P420 state was evidenced by the spectra of the carbonyl complexes of the ferrous enzyme recorded upon decompression (data not shown).
This “quasi-reversible” nature of pressure-induced P450➔P420 transition in P450-SS9 permitted us to use the formalism describing the pressure dependence of equilibrium (eq. 1 an 2), similarly to that done in our studies with other cytochromes P450 (21, 22, 25). According to this analysis, this conversion is characterized by a P½ value of 2517 ± 191 bar and the molar volume change (ΔVo) of −41.8 ± 1.6 ml for the ligand-free enzyme. Similar to that observed with P450BM-3 (22), the interaction of P450-SS9 with a type-I ligand (myristic acid) displaces the P½ to higher pressures (2970 ± 89 ml/mol at saturating myristic acid) and increases the absolute value of the volume change (ΔVo=−65 ± 2 ml/mol, data not shown).
While the parameters of pressure-induced inactivation are quite similar to those obtained with other cytochromes P450 (10, 21, 30), the effect of pressure on spin equilibrium of P450-SS9 (Fig. 6c) reveals a striking peculiarity of the piezophilic enzyme, As shown in Fig. 6c, the pressure dependencies of the content of the high-spin state in the P450 heme protein either in the absence of ligand or in the presence of saturating concentration of myristic acid or arachidonoyl glycine do not obey the canonical equation (Eq. 3). Appropriate fit of these dependencies to Eq. 3 at pressures below 1500 bar (where the P450➔P420 transition is negligible) may be achieved only with the assumption that an important part of the enzyme (36, 28 and 88% for the ligand free-enzyme and its complexes with arachidonoyl glycine or myristic acid, respectively) is excluded from the pressure-induced spin shift. However, there are no obvious reasons for such apparent heterogeneity of the enzyme. Another possible explanation of decreased pressure sensitivity of the spin equilibrium may be found in an allowance for a pressure-induced conformational transition which may take place at pressures below 1000 bar and result in a decrease of the solvent accessibility of the heme pocket. This suggestive conformational transition may “capture” the enzyme in the high-spin state and prevent further conversion of the enzyme into the low-spin state. This putative mechanism is similar to that demonstrated earlier for the complexes of CYP3A4 and P450eryF with allosteric substrates.
Detailed analysis of the effect of hydrostatic pressure on spin equilibrium and ligand binding in P450-SS9
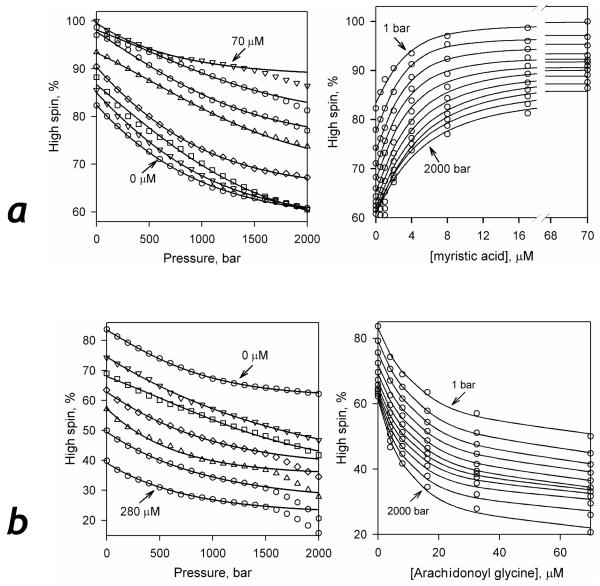
For an in-depth analysis of the atypical behavior described above, we performed a systematic study of the effect of pressure on spin equilibrium at different concentrations of myristic acid (Type-I ligand) and arachidonoyl glycine (reversed Type-I ligand). A series of pressure dependencies of the content of the high-spin state at different concentrations of myristic acid and arachidonoyl glycine are shown in the left panels of Fig. 7a and Fig. 7b respectively. The right panels show a series of titration curves obtained at increasing pressure. In striking contrast to most cytochromes P450 studied to date, the effect of the increasing pressure on the shape and the amplitude of the titration curves was quite minor. No substantial effect of hydrostatic pressure on the amplitude of ligand-dependent displacement of spin equilibrium was observed with either myristic acid or arachidonoyl glycine. The effect of pressure on the affinity of the enzyme to these ligands was also quite modest.
Figure 7.
Effect of hydrostatic pressure on the spin state of P450-SS9 in solution at increasing concentrations of myristic acid (a) and arachidonoyl glycine (b). The plots shown on the left of each panel represent the content of the high-spin state as a function of pressure at various concentrations of substrates (0.5, 1.0, 2.0, 4.0, 8.0, 16.0, 32.0, and 70.0 μM of myristic acid and 4.0, 8.0, 16.0, 32.0, 70.0, and 280.0 μM arachidonoyl glycine for the panels A and B respectively). The plots shown on the right represent the same data set shown as the changes in the high spin content with increasing substrate concentration at a series of pressures increasing from 1 to 2000 bar in 200 bar increments. Solid lines show the results of fitting of the titration curves to the equation for the equilibrium of binary association.
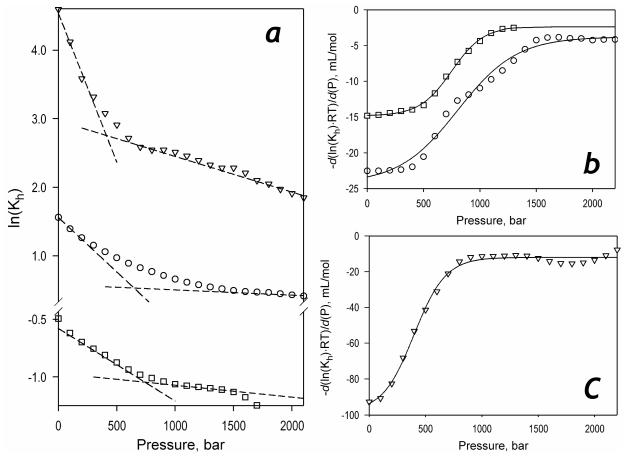
The results of quantitative analysis of the pressure-induced displacement of the spin equilibrium in the ligand-free enzyme or its complexes are shown in Fig. 8a, which represent the dependencies of the constant of spin equilibrium (Kh) on pressure in semi-logarithmic coordinates. As seen from this figure, all three dependencies are markedly non-linear. The break observed on these traces apparently signifies a pressure induced transition taking place in the pressure range of 400-800 bar in either the ligand-free state or in the complex with ligands. This pressure-induced transition is also revealed in an abrupt change in the compressibility of the heme pocket of the P450-SS9 complex with arachidonoyl glycine that takes place around 400 bar, which was observed in our study of the effect of pressure on the position of the Soret band of the carbonyl complex of the ferrous P450-SS9 (49).
Figure 8.
Effect of hydrostatic pressure on the parameters of spin equilibrium and substrate binding in P450-SS9. Panel a shows the effect of pressure on Kh of the substrate-free enzyme (circles) and its complexes with myristic acid (triangles) and arachidonoyl glycine (squares) in semi-logarithmic coordinates. Dashed lines show linear approximations of the initial and final parts of these plots. The first derivative of the dependencies for the substrate-free enzyme (circles) and its complex with arachidonoyl glycine (squares) are shown in panel b. Panel c shows a similar plot for the enzyme complex with myristic acid. The lines on panels b and c show the approximation of these derivative plots with Eq. 3. The parameters obtained from this approximation may be found in Table 2.
To determine the barotropic parameters of this transition we plotted the first derivatives of the logarithms of Kh,free, Kh,AraGly and Kh,myrist vs. pressure. These plots (Fig. 8b,c) obey the equation for pressure dependence of equilibrium (Eq. 3). The parameters derived from this fitting, including the values of ΔVospin characterizing the two apparent conformers, are shown in Table 2. As seen from this table, the putative pressure-induced transition exhibits a reaction volume change as high as −100 - −180 ml/mol and a value of P½ in the range of 400-800 bar. A decrease in ΔVospin observed after this pressure virtually eliminates the pressure-induced spin shift in either the ligand-free enzyme or its complexes with arachidonoyl glycine and myristic acid and results in the apparent incompleteness of the pressure-induced spin shift, similar to that observed in the complexes of P450eryF and CYP3A4 with allosteric substrates (26).
Table 2.
Parameters of pressure-dependent equilibria in P450-SS9*
| Substrate | ΔVospin, mL/mol | ΔVodiss, mL/mol |
KD(0), μM | Parameters of R→P transitiona | ||
|---|---|---|---|---|---|---|
| R-state | P-state | ΔVoR→P, mL/mol |
P½, bar | |||
| None | 23.9±0.3 | 3.85±0.26 | N/A | N/A | −94.3±8.2 | 801±25 |
| Arachidonoyl glycine |
14.5±0.15 | 2.27±0.36 | +9.1±0.4 | 0.91±0.05 | −178±14 | 750±13 |
| Myristic acid | 96.8±0.7 | 11.7±0.4 | −16.2±0.7 | 21.5±0.4 | −172±12 | 398±11 |
The values given in the table represent the averages of 2 individual measurements, and the “±” values show the confidence interval calculated for p = 0.05.
The parameters of the pressure-induced conformational transition determined from the plots of the first derivative of the pressure dependencies of ln(Kh).
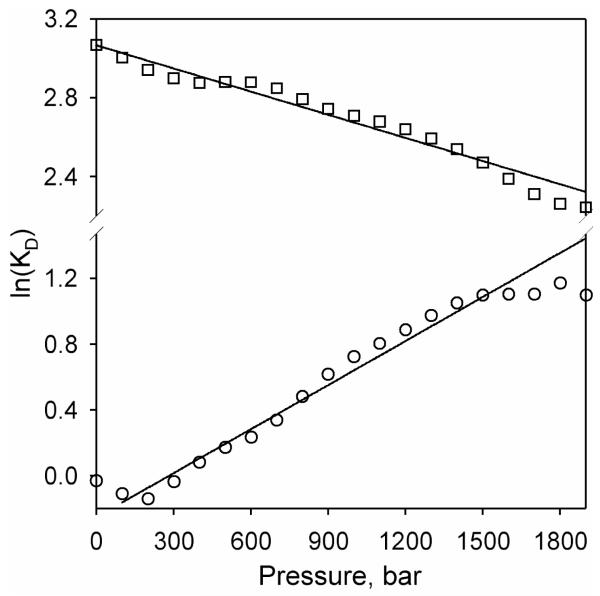
The effect of hydrostatic pressure on the values of the dissociation constant of the complexes of P450-SS9 with myristic acid and arachidonoyl glycine is illustrated in Fig. 9. In contrast to the pressure dependencies of Kh, the semi-logarithmic plots of KD versus pressure are linear for both probed ligands. However, this analysis results in another unexpected finding: the volume changes associated with the binding of the two ligands have opposite signs (Table 2). If the interactions of the enzyme with myristic acid, the Type-I ligand, are weakened at increasing pressures (ΔVodiss<0), the binding of arachidonoyl glycine (reverse Type-I ligand) is pressure-promoted ((ΔVodiss >0). This observation suggests that the different direction of the spin shift observed with these ligands may originate from a contrasting difference in the changes in protein hydration caused by their binding to the enzyme. To explain this striking contrast and according to the logic implemented in our study of ligand binding in P450cam, CYP3A4 and P450-BM3 (22), we may speculate that the ΔVodiss values are composed of two major constituents, namely (1) the volume changes due to elimination of the ligand molecule from the solvent and (2) the volume of water molecules expulsed from the active site to the bulk phase. The signs of these two constituents are opposite, and the sign of the ΔVodiss is determined by the balance of their absolute values. According to the above discussion, the Type-I ligands (like myristic acid) result in a more significant dehydration of the heme pocket, while in the case of reversed Type-I ligands (arachidonoyl glycine) some water molecules remain confined in the pocket. Therefore, the net of the two terms is expected to correspond to an increase in the system volume upon the binding Type-I ligands (ΔVdiss<0), in contrast to a decrease (ligand becomes eliminated from solution, but the active site water remains excluded from the bulk) as in the case of interactions with the reverse Type-I ligands (ΔVdiss<0). These expectations are in a good agreement with the experimental results on the opposite effect of pressure on the affinity of the enzyme to myristic acid and arachidonoyl glycine.
Figure 9.
Dependencies of KD of the P450-SS90 complexes with myristic acid (circles) and arachydonyl glycine (squares) on pressure in semi-logarithmic coordinates. Lines show the linear approximations of these data sets. The respective barotropic parameters are given in Table 2.
Physiological relevance and putative functional role of pressure-dependent conformational equilibrium in P450-SS9
Our results suggest a pressure-dependent equilibrium between two conformational states of the enzyme, which are characterized with contrastingly different reaction volume changes in spin transitions. Similar to terminology used in our studies with CYP3A4 (25) and P450eryF (26) we designate the two apparent conformational states of the enzyme as R- and P-conformers (for “relaxed” and “pressure-promoted” states, respectively). High values of the reaction volume change in the R➔P transition indicate that the formation of the “pressure-promoted state” is associated with important hydration of the enzyme molecule. This hydration, however, is not accompanied by the transition of the heme iron into the water-ligated low-spin state. Quite the opposite, it results in stabilization of the high-spin state of the enzyme, which is characteristic of a low water occupancy in the proximity of the heme (40, 50, 51). Therefore, we may assume that the aforementioned hydration takes place outside of the heme pocket.
The anticipated difference among the two conformers in the protein hydration and the active site accessibility is schematically illustrated in the Table of Contents graphic to this article. When interpreted in simplistic terms of hydration of an empty protein cavity, the values of −100 – −180 ml/mol are indicative of the binding of 5 – 10 water molecules per enzyme molecule. This number may be considered only as a very rough estimate of a number of water molecules involved in this transition. Its actual mechanism may be (and, most probably, is) considerably more complex and involve such effects as electrostriction of water on newly opened charges, or changes of the solvent structure due to exposure of hydrophobic patches, etc.
Although the extent of the P-state in P450-SS9 is already considerable at ambient pressure, this state becomes predominant at the pressures higher than 200 – 800 bar. Relatively low values of P½ suggest the physiological importance of the discovered conformational equilibrium in the piezophilic P450 enzyme. P. profundum strain SS9 inhabits the ocean depths of around 2500 m (36), so that the optimal physiological pressure for this microorganism is around 280 bar (37), which is close to the observed P½ values of the R➔P transition. Therefore, under the physiological conditions of habitation of P. profundum, the representation of the P-conformer in the enzyme is high and the displacement of the conformational equilibrium by ligands revealed in their effect on P½ (Table 2) may have a pivotal role in maintaining high activity and coupling of the enzyme under the conditions of highly promoted hydration at elevated pressure.
As mentioned above, the pressure-dependent equilibrium between two states of the enzyme that differ in the parameters of spin transitions is not unique to P450-SS9. Although a similar behavior has been observed earlier in the complexes of CYP3A4 and P450eryF with the substrates exhibiting cooperativity (25, 26), it is unprecedented for a ligand-free cytochrome P450. Furthermore, the P½ values for this transition (Table 2) are significantly lower than the values of 1200 – 1600 bar observed in CYP3A4 and P450eryF (25, 26) and, consequently, the extent of the P-conformer in P450-SS9 at ambient pressure is considerably higher than in CYP3A4 and P450eryF.
How do the volumetric parameters of the spin transitions in P450-SS9 relate to those characteristic of other cytochromes P450? The values of ΔVospin reported for the substrate-free states of P450cam, the heme domain of P450 BM3 (BMP), CYP2B4 (22), P450eryF (26) or CYP3A4 (25) fall in the range 10 – 30 ml/mol. The averaging of these reported values results in the mean estimate of 19.2 ± 7 ml/mol. Thus, the apparent changes in hydration of the protein in the spin transition of the ligand-free R-state of P450-SS9 (ΔVospin = 23.0 ± 0.26 ml/mol) are compatible with those observed with other P450 enzymes and is consistent with the expulsion of one water molecule (18 mL/mol) in the low-to-high spin transition.
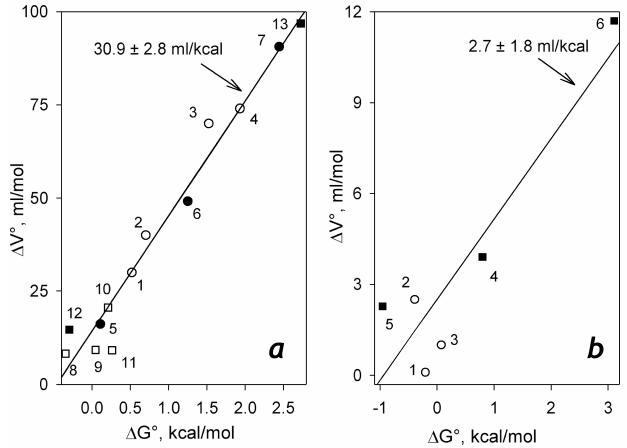
Earlier we reported a linear correlation between the Gibbs free energy and the reaction volume changes in spin transitions in a series of various ligand-bound cytochromes P450 (22). In Fig. 10a we probe the same linear correlation for the pairs of ΔGo and ΔVospin values characterizing the R-states of P450-SS9, CYP3A4 and P450eryF. It might be seen that the data points representing these heme proteins comply with the same linear relationship. The square correlation coefficient for the linear approximation of the data set consisting of the data pairs characterizing the substrate-bound P450cam, P450BM3, CYP2A4 along with those for the R-states of CYP3A4, P450eryF (substrate bound) and P450-SS9 (both ligand-bound and ligand-free) is as high as 0.965 (Fig. 10a).
Figure 10.
Correlation among the changes in the Gibbs free energy and the reaction volume in the spin transition of cytochromes P450. Panel a compiles the data obtained for the substrate complexes P450cam, the heme domain of P450BM3 (BMP), CYP2B4, and the “relaxed” states of CYP3A4, P450eryF and P450-SS9: Open circles represent the data obtained with P450cam complexes with endo-borneol O-methyl ether of camphor (1), endo-borneol O-propyl ether of camphor (2), endo-borneol O-allyl ether of camphor (3) and camphor (4) (46). Closed circles show the results reported in (22) for the complexes of BMP with palmitic acid (5), CYP2B4 with benzphetamine (6) and P450cam with camphor (7). Open squares represent the data obtained with the complexes of P450eryF with Fluorol-7GA (26)(8) and the complexes of CYP3A4 with bromocriptine (9), testosterone (10) and 1-pyrenebutanol (11) (25). The values reported in this study for the complexes of P450-SS9 complexes with arachidonoyl glycine (12) and myristic acid (13) are shown in filled squares. Solid line represents the least square linear approximation of the whole data set (ρ2=0.965). The data characterizing the “pressure-promoted” state of P450eryF, CYP3A4 and P450-SS9 are combined in panel b. Open circles represent the data reported for the complexes of P450eryF with Fluorol-7GA (26) (1) and the complexes of CYP3A4 with testosterone (2) and 1-pyrenebutanol (3) (25). The values determined in this study for the substrate-free P450-SS9 (4) and its complexes with arachidonoyl glycine (5) and myristic acid (6) are shown in filled squares. Solid line represents the least square linear approximation of the whole data set (ρ2=0.834).
It is noteworthy that the data pairs characterizing the P-states observed in CYP3A4 and P450-SS9 also reveal a pronounced linear correlation (ρ2=0.834, Fig 10b). A linear relationship between the values of ΔGospin and ΔVospin appears to represent a general characteristic of the substrate complexes for both the R- and P-states of cytochromes P450. However, the two states are contrastingly different in the magnitude of the regression coefficients for this correlation (Fig. 10). Very low values of ΔVospin characteristic of the P-state of ether P450-SS9, CYP3A4 or P450eryF suggest that the low-to-high spin transition in this state does not require an expulsion of water molecule released from the coordinate sphere of the heme iron.
Concluding remarks
Our attention to cytochromes P450 from piezophilic microorganisms was prompted by the hypothesis that these enzymes may reveal altered dynamics of protein-bound water in substrate binding and spin shift due to an adaptation of the mechanism that controls the water accessibility of the heme pocket to high hydrostatic pressures. The properties of the piezophilic P450-SS9 meet these expectations well.
Studies of the piezophilic enzyme revealed a pressure-induced conformational transition to the state where the water flux to and from the active site is likely to be obstructed and the high-spin state of the heme iron at elevated pressures is preserved. Displacement of the conformational equilibrium towards the “closed” state in P450-SS9, both in substrate-bound and substrate-free states, may result from an evolutionary adaptation of this protein to functioning at high hydrostatic pressures, in the conditions of highly promoted protein hydration.
Based on our analysis, we hypothesize that the conformational equilibrium between the two states with different accessibility of the heme pocket and contrasting dynamics of the protein-bound water represent a common feature of cytochromes P450. The transition to the state with confined water accessibility of the heme pocket may be transient in the catalytic cycle of most P450 enzymes and serve to coordinate the heme pocket hydration with substrate binding, interactions with redox partners and the redox state of the enzyme. According to our recent studies with CYP3A4 and P450eryF (25, 26) this pressure-sensitive conformational equilibrium plays a pivotal role in the mechanisms of P450 cooperativity. Studies of piezophilic enzymes may therefore provide a clue to the mechanisms of substrate binding and spin transitions in cytochromes P450.
Supplementary Material
Acknowledgement
The authors are grateful to Dr. James R. Halpert (Skaggs School of Pharmacy and Pharmaceutical Science, UC San Diego) for his continuous interest, support and valuable comments. We also grateful to Dr. Douglas H. Bartlett (Scripps Institution of Oceanography, UC San Diego) for providing us with DNA of Photobacterium profundum SS9 and to Jessica A. O. Rumfeldt (Skaggs School of Pharmacy and Pharmaceutical Science, UC San Diego) for critical reading of the manuscript and valuable comments.
Abbreviations
- P450-SS9
cytochrome P450 from Photobacterium profundum strain SS9
- CYP3A4
cytochrome P450 3A4
- CYP2B4
cytochrome P450 2B4
- BMP
heme domain of cytochrome P450BM-3
- P450eryF
cytochrome P450eryF
- Hepes
N-[2-hydroxyethylpiperazine-N′-[2-ethanesulfonic acid]
- EDTA
ethylenediaminetetraacetic acid
Footnotes
This research was supported by NIH grant GM54995
References
- 1.Kornblatt JA, Kornblatt MJ. The effects of osmotic and hydrostatic pressures on macromolecular systems. Biochim. Biophys. Acta. 2002;1595:30–47. doi: 10.1016/s0167-4838(01)00333-8. [DOI] [PubMed] [Google Scholar]
- 2.Rupley JA, Careri G. Protein hydration and function. Adv. Protein. Chem. 1991;41:37–172. doi: 10.1016/s0065-3233(08)60197-7. [DOI] [PubMed] [Google Scholar]
- 3.Rand RP. Probing the role of water in protein conformation and function. Philos. Trans. R. Soc. Lond. B Biol. Sci. 2004;359:1277–1285. doi: 10.1098/rstb.2004.1504. [DOI] [PMC free article] [PubMed] [Google Scholar]
- 4.Pal SK, Zewail AH. Dynamics of water in biological recognition. Chem. Rev. 2004;104:2099–2123. doi: 10.1021/cr020689l. [DOI] [PubMed] [Google Scholar]
- 5.Scorciapino MA, Robertazzi A, Casu M, Ruggerone P, Ceccarelli M. Heme proteins: the role of solvent in the dynamics of gates and portals. J. Am. Chem. Soc. 2010;132:5156–5163. doi: 10.1021/ja909822d. [DOI] [PubMed] [Google Scholar]
- 6.Akasaka K. Probing conformational fluctuation of proteins by pressure perturbation. Chem. Rev. 2006;106:1814–1835. doi: 10.1021/cr040440z. [DOI] [PubMed] [Google Scholar]
- 7.Chalikian TV, Macgregor RB., Jr. Origins of pressure-induced protein transitions. J. Mol. Biol. 2009;394:834–842. doi: 10.1016/j.jmb.2009.10.020. [DOI] [PubMed] [Google Scholar]
- 8.Kharakoz DP. Partial volumes and compressibilities of extended polypeptide chains in aqueous solution: additivity scheme and implication of protein unfolding at normal and high pressure. Biochemistry. 1997;36:10276–10285. doi: 10.1021/bi961781c. [DOI] [PubMed] [Google Scholar]
- 9.Weber G, Drickamer HG. The effect of high pressure upon proteins and other biomolecules. Q. Rev. Biophys. 1983;16:89–112. doi: 10.1017/s0033583500004935. [DOI] [PubMed] [Google Scholar]
- 10.Hui Bon Hoa G, McLean MA, Sligar SG. High pressure, a tool for exploring heme protein active sites. Biochim. Biophys. Acta. 2002;1595:297–308. doi: 10.1016/s0167-4838(01)00352-1. [DOI] [PubMed] [Google Scholar]
- 11.Heremans K, Smeller L. Protein structure and dynamics at high pressure. Biochim. Biophys. Acta. 1998;1386:353–370. doi: 10.1016/s0167-4838(98)00102-2. [DOI] [PubMed] [Google Scholar]
- 12.Macgregor RB. The interactions of nucleic acids at elevated hydrostatic pressure. Biochim. Biophys. Acta. 2002;1595:266–276. doi: 10.1016/s0167-4838(01)00349-1. [DOI] [PubMed] [Google Scholar]
- 13.Occhipinti E, Bec N, Gambirasio B, Baietta G, Martelli PL, Casadio R, Balny C, Lange R, Tortora P. Pressure and temperature as tools for investigating the role of individual non-covalent interactions in enzymatic reactions Sulfolobus solfataricus carboxypeptidase as a model enzyme. Biochim. Biophys. Acta. 2006;1764:563–572. doi: 10.1016/j.bbapap.2005.12.007. [DOI] [PubMed] [Google Scholar]
- 14.Loida PJ, Sligar SG. Molecular recognition in cytochrome P-450: mechanism for the control of uncoupling reactions. Biochemistry. 1993;32:11530–11538. doi: 10.1021/bi00094a009. [DOI] [PubMed] [Google Scholar]
- 15.Di Primo C, Hui Bon Hoa G, Douzou P, Sligar SG. Heme-pocket-hydration change during the inactivation of cytochrome P-450camphor by hydrostatic pressure. Eur. J. Biochem. 1992;209:583–588. doi: 10.1111/j.1432-1033.1992.tb17323.x. [DOI] [PubMed] [Google Scholar]
- 16.Cojocaru V, Winn PJ, Wade RC. The ins and outs of cytochrome P450s. Biochim. Biophys. Acta. 2007;1770:390–401. doi: 10.1016/j.bbagen.2006.07.005. [DOI] [PubMed] [Google Scholar]
- 17.Hamdane D, Zhang H, Hollenberg P. Oxygen activation by cytochrome P450 monooxygenase. Photosynth. Res. 2008;98:657–666. doi: 10.1007/s11120-008-9322-1. [DOI] [PMC free article] [PubMed] [Google Scholar]
- 18.Di Primo C, Deprez E, Hui Bon Hoa G, Douzou P. Antagonistic effects of hydrostatic pressure and osmotic pressure on cytochrome P-450cam spin transition. Biophys. J. 1995;68:2056–2061. doi: 10.1016/S0006-3495(95)80384-X. [DOI] [PMC free article] [PubMed] [Google Scholar]
- 19.Bancel F, Bec N, Ebel C, Lange R. A central role for water in the control of the spin state of cytochrome P-450scc. Eur. J. Biochem. 1997;250:276–285. doi: 10.1111/j.1432-1033.1997.0276a.x. [DOI] [PubMed] [Google Scholar]
- 20.Fisher MT, Scarlata SF, Sligar SG. High-pressure investigations of cytochrome P-450 spin and substrate binding equilibria. Arch. Biochem. Biophys. 1985;240:456–463. doi: 10.1016/0003-9861(85)90050-5. [DOI] [PubMed] [Google Scholar]
- 21.Davydov DR, Deprez E, Hui Bon Hoa G, Knyushko TV, Kuznetsova GP, Koen YM, Archakov AI. High-pressure-induced transitions in microsomal cytochrome P450 2B4 in solution: evidence for conformational inhomogeneity in the oligomers. Arch. Biochem. Biophys. 1995;320:330–344. doi: 10.1016/0003-9861(95)90017-9. [DOI] [PubMed] [Google Scholar]
- 22.Davydov DR, Hui Bon Hoa G, Peterson JA. Dynamics of protein-bound water in the heme domain of P450BM3 studied by high-pressure spectroscopy: comparison with P450cam and P450 2B4. Biochemistry. 1999;38:751–761. doi: 10.1021/bi981397a. [DOI] [PubMed] [Google Scholar]
- 23.Tschirret-Guth RA, Koo LS, Hoa GH, Ortiz De Montellano PR. Reversible pressure deformation of a thermophilic cytochrome P450 enzyme (CYP119) and its active-site mutants. J. Am. Chem. Soc. 2001;123:3412–3417. doi: 10.1021/ja003947+. [DOI] [PubMed] [Google Scholar]
- 24.Davydov DR, Knyushko TV, Hui Bon Hoa G. High pressure induced inactivation of ferrous cytochrome P-450 LM2 (IIB4) CO complex: evidence for the presence of two conformers in the oligomer. Biochem. Biophys. Res. Commun. 1992;188:216–221. doi: 10.1016/0006-291x(92)92372-5. [DOI] [PubMed] [Google Scholar]
- 25.Davydov DR, Baas BJ, Sligar SG, Halpert JR. Allosteric mechanisms in cytochrome P450 3A4 studied by high-pressure spectroscopy: pivotal role of substrate-induced changes in the accessibility and degree of hydration of the heme pocket. Biochemistry. 2007;46:7852–7864. doi: 10.1021/bi602400y. [DOI] [PMC free article] [PubMed] [Google Scholar]
- 26.Davydov DR, Davydova NY, Halpert JR. Allosteric transitions in cytochrome P450eryF explored with pressure-perturbation spectroscopy, lifetime FRET, and a novel fluorescent substrate, Fluorol-7GA. Biochemistry. 2008;47:11348–11359. doi: 10.1021/bi8011803. [DOI] [PMC free article] [PubMed] [Google Scholar]
- 27.Davydov DR, Halpert JR. Allosteric P450 mechanisms: multiple binding sites, multiple conformers or both? Expert Opin. Drug Metab. Toxicol. 2008;4:1523–1535. doi: 10.1517/17425250802500028. [DOI] [PMC free article] [PubMed] [Google Scholar]
- 28.Hui Bon Hoa G, Marden MC. The pressure dependence of the spin equilibrium in camphor-bound ferric cytochrome P-450. Eur. J. Biochem. 1982;124:311–315. doi: 10.1111/j.1432-1033.1982.tb06593.x. [DOI] [PubMed] [Google Scholar]
- 29.Renaud JP, Davydov DR, Heirwegh KP, Mansuy D, Hui Bon Hoa GH. Thermodynamic studies of substrate binding and spin transitions in human cytochrome P-450 3A4 expressed in yeast microsomes. Biochem. J. 1996;319(Pt 3):675–681. doi: 10.1042/bj3190675. [DOI] [PMC free article] [PubMed] [Google Scholar]
- 30.Davydov DR, Halpert JR, Renaud JP, Hui Bon Hoa G. Conformational heterogeneity of cytochrome P450 3A4 revealed by high pressure spectroscopy. Biochem. Biophys. Res. Commun. 2003;312:121–130. doi: 10.1016/j.bbrc.2003.09.247. [DOI] [PubMed] [Google Scholar]
- 31.Segel IH. Enzyme Kinetics. Behavior and Analysis of Rapid Equilibrium and Steady-State Systems. Wiley; New York: 1975. [Google Scholar]
- 32.Weber G. Protein Interactions. Chapman and Hall; New York: 1991. [Google Scholar]
- 33.Vezzi A, Campanaro S, D’Angelo M, Simonato F, Vitulo N, Lauro FM, Cestaro A, Malacrida G, Simionati B, Cannata N, Romualdi C, Bartlett DH, Valle G. Life at depth: Photobacterium profundum genome sequence and expression analysis. Science. 2005;307:1459–1461. doi: 10.1126/science.1103341. [DOI] [PubMed] [Google Scholar]
- 34.Brinkhoff T, Giebel HA, Simon M. Diversity, ecology, and genomics of the Roseobacter clade: a short overview. Arch. Microbiol. 2008;189:531–539. doi: 10.1007/s00203-008-0353-y. [DOI] [PubMed] [Google Scholar]
- 35.Yayanos AA. Evolutional and ecological implications of the properties of deep-sea barophilic bacteria. Proc. Natl. Acad.Sci. USA. 1986;83:9542–9546. doi: 10.1073/pnas.83.24.9542. [DOI] [PMC free article] [PubMed] [Google Scholar]
- 36.Nogi Y, Masui N, Kato C. Photobacterium profundum sp. nov., a new, moderately barophilic bacterial species isolated from a deep-sea sediment. Extremophiles. 1998;2:1–7. doi: 10.1007/s007920050036. [DOI] [PubMed] [Google Scholar]
- 37.Campanaro S, Vezzi A, Vitulo N, Lauro FM, D’Angelo M, Simonato F, Cestaro A, Malacrida G, Bertoloni G, Valle G, Bartlett DH. Laterally transferred elements and high pressure adaptation in Photobacterium profundum strains. BMC Genomics. 2005;6:122. doi: 10.1186/1471-2164-6-122. [DOI] [PMC free article] [PubMed] [Google Scholar]
- 38.Martens T, Gram L, Grossart HP, Kessler D, Muller R, Simon M, Wenzel SC, Brinkhoff T. Bacteria of the Roseobacter clade show potential for secondary metabolite production. Microb. Ecol. 2007;54:31–42. doi: 10.1007/s00248-006-9165-2. [DOI] [PubMed] [Google Scholar]
- 39.McLean KJ, Lafite P, Levy C, Cheesman MR, Mast N, Pikuleva IA, Leys D, Munro AW. The Structure of Mycobacterium tuberculosis CYP125: molecular basis for cholesterol binding in a P450 needed for host infection. J. Biol. Chem. 2009;284:35524–35533. doi: 10.1074/jbc.M109.032706. [DOI] [PMC free article] [PubMed] [Google Scholar]
- 40.Jung C, Hui Bon Hoa G, Davydov D, Gill E, Heremans K. Compressibility of the heme pocket of substrate analogue complexes of cytochrome P-450cam-CO. The effect of hydrostatic pressure on the Soret band. Eur. J. Biochem. 1995;233:600–606. doi: 10.1111/j.1432-1033.1995.600_2.x. [DOI] [PubMed] [Google Scholar]
- 41.Macdonald ID, Smith WE, Munro AW. Inhibitor/fatty acid interactions with cytochrome P-450 BM3. FEBS Lett. 1996;396:196–200. doi: 10.1016/0014-5793(96)01095-2. [DOI] [PubMed] [Google Scholar]
- 42.Narhi LO, Fulco AJ. Characterization of a catalytically self-sufficient 119,000-dalton cytochrome P-450 monooxygenase induced by barbiturates in Bacillus megaterium. J. Biol. Chem. 1986;261:7160–7169. [PubMed] [Google Scholar]
- 43.Kitazume T, Tanaka A, Takaya N, Nakamura A, Matsuyama S, Suzuki T, Shoun H. Kinetic analysis of hydroxylation of saturated fatty acids by recombinant P450foxy produced by an Escherichia coli expression system. Eur. J. Biochem. 2002;269:2075–2082. doi: 10.1046/j.1432-1033.2002.02855.x. [DOI] [PubMed] [Google Scholar]
- 44.Chaurasia CS, Alterman MA, Lu P, Hanzlik RP. Biochemical characterization of lauric acid omega-hydroxylation by a CYP4A1/NADPH-cytochrome P450 reductase fusion protein. Arch. Biochem. Biophys. 1995;317:161–169. doi: 10.1006/abbi.1995.1149. [DOI] [PubMed] [Google Scholar]
- 45.Tamburini PP, Gibson GG, Backes WL, Sligar SG, Schenkman JB. Reduction kinetics of purified rat liver cytochrome P-450. Evidence for a sequential reaction mechanism dependent on the hemoprotein spin state. Biochemistry. 1984;23:4526–4533. doi: 10.1021/bi00315a004. [DOI] [PubMed] [Google Scholar]
- 46.Helms V, Deprez E, Gill E, Barret C, Hui Bon Hoa G, Wade RC. Improved binding of cytochrome P450cam substrate analogues designed to fill extra space in the substrate binding pocket. Biochemistry. 1996;35:1485–1499. doi: 10.1021/bi951817l. [DOI] [PubMed] [Google Scholar]
- 47.Blanck J, Ristau O, Zhukov AA, Archakov AI, Rein H, Ruckpaul K. Cytochrome P-450 spin state and leakiness of the monooxygenase pathway. Xenobiotica. 1991;21:121–135. doi: 10.3109/00498259109039456. [DOI] [PubMed] [Google Scholar]
- 48.Schwarze W, Blanck J, Ristau O, Janig GR, Pommerening K, Rein H, Ruckpaul K. Spin state control of cytochrome P-450 reduction and catalytic activity in a reconstituted P-450 LM2 system as induced by a series of benzphetamine analogues. Chem. Biol. Interact. 1985;54:127–141. doi: 10.1016/s0009-2797(85)80158-7. [DOI] [PubMed] [Google Scholar]
- 49.Sineva EV, Davydov DR. Constrained water access to the active site of cytochrome P450 from the piezophilic bacterium Photobacterium profundum. High Pressure Res. 2010;30:466–474. doi: 10.1080/08957959.2010.535208. [DOI] [PMC free article] [PubMed] [Google Scholar]
- 50.Rydberg P, Rod TH, Olsen L, Ryde U. Dynamics of water molecules in the active-site cavity of human cytochromes P450. J.Phys.Chem.B. 2007;111:5445–5457. doi: 10.1021/jp070390c. [DOI] [PubMed] [Google Scholar]
- 51.Schulze H, Hui Bon Hoa G, Helms V, Wade RC, Jung C. Structural changes in cytochrome P-450cam effected by the binding of the enantiomers (1R)-camphor and (1S)-camphor. Biochemistry. 1996;35:14127–14138. doi: 10.1021/bi9527303. [DOI] [PubMed] [Google Scholar]
Associated Data
This section collects any data citations, data availability statements, or supplementary materials included in this article.


