

Abstract
Translocator protein (TSPO) is a crucial 18 kDa outer mitochondrial membrane protein involved in numerous cellular functions, including regulation of cholesterol metabolism, steroidogenesis, and apoptosis. Elevated expression of TSPO in oncology correlates with disease progression and poor survival, suggesting that molecular probes capable of assaying TSPO levels may have potential as cancer imaging biomarkers. In preclinical PET imaging studies, we characterized a high-affinity aryloxyanilide-based TSPO imaging ligand, [18F]PBR06, as a candidate probe for quantitative assessment of TSPO expression in glioma.
Methods
Glioma-bearing rats were imaged with [18F]PBR06 in a microPET system. Dynamic acquisitions were acquired simultaneously upon injection of 70 - 100 MBq/0.2 mL [18F]PBR06. Over the course of scanning, arterial blood was collected to derive the input function, with HPLC radiometabolite analysis performed on selected samples for arterial input function correction. Compartmental modeling of the PET data was performed using the corrected arterial input function. Specific tumor cell binding of PBR06 was evaluated by radioligand displacement of [3H]PK 11195 with PBR06 in vitro and by displacement of [18F]PBR06 with excess PBR06 in vivo. Immediately following imaging, tumor tissue and adjacent healthy brain were harvested for assay of TSPO protein levels by western blotting and immunohistochemistry.
Results
[18F]PBR06 was found to preferentially accumulate in tumors with modest uptake in contralateral brain, facilitating excellent contrast between tumor and adjacent tissue. Infusion with PBR06 (10 mg/kg) displaced [18F]PBR06 binding by approximately 75%. The accumulation of [18F]PBR06 in tumor tissues and adjacent brain agreed with ex vivo assay of TSPO protein levels by western blot and quantitative IHC.
Conclusions
These preclinical studies illustrate that [18F]PBR06 is a promising tracer for visualization of TSPO-expressing tumors. Importantly, the close correlation between [18F]PBR06 uptake and TSPO expression in tumor and normal tissues, coupled with the high degree of displaceable binding from both tumor and normal brain, represents a significant improvement over other TSPO imaging ligands previously evaluated in glioma. These data suggest the potential of [18F]PBR06 to aid the elucidation of TSPO's role in oncology, as well as its potential development as a cancer imaging biomarker.
Keywords: Cancer, PBR, TSPO, PBR06, Positron Emission Tomography/PET
Introduction
Translocator protein (TSPO), also referred to as peripheral benzodiazepine receptor (PBR), is an 18 kDa outer mitochondrial membrane protein that participates in regulation of numerous cellular processes, including cholesterol metabolism, steroid biosynthesis, cellular proliferation and apoptosis. In normal tissues, TSPO expression tends to be highest in steroid producing tissues and mitochondrial enriched tissues such as skeletal muscle, renal tissue, and myocardium, while tissues such as liver and brain exhibit comparatively modest expression (1). Elevated TSPO expression is found in numerous disease states that include neuroinflammation and psychiatric disorders such as Alzheimer's and Huntington's diseases, as well as cancers of the breast, prostate, colon, and brain (2). Elevated TSPO expression has been linked with disease progression and diminished survival in patients presenting with several types of cancer, including colorectal (3) and brain (2), suggesting its potential importance as a predictive cancer imaging biomarker.
Clinically, two of the most common imaging metrics employed to detect and diagnose brain tumors are computed tomography (CT) and magnetic resonance imaging (MRI). These modalities provide little, if any, molecular information attributable to the pathological status of the disease. Furthermore, numerous studies document the inherent difficulty associated with visualization of the true extent of brain tumor pathology using CT and/or MRI, particularly with highly infiltrative disease. Positron emission tomography (PET) using [18F]FDG is among the most powerful imaging approaches currently available for tumor detection in nearly all organ sites, including the brain. However, high glucose uptake in normal brain results in modest tumor-to-background ratios, which can confound delineation of disease margins and subsequent grading. An alternative and potentially superior approach to [18F]FDG PET is L-[methyl-11C] methionine ([11C]methionine) (4). Though promising, the half-life of 11C limits the broad implementation of this technique. Therefore, there is a considerable need to develop and validate improved molecular imaging techniques suitable for detection and/or molecular profiling of brain tumors.
Given its elevated expression and correlation with aggressive tumor phenotypes, cellular proliferation, and grade in glioma (5), imaging TSPO expression in brain tumors has been suggested and explored previously (5-10). Almost exclusively, these studies employed the well-known TSPO ligand, (R)-N-[3H/11C]methyl-N-(1-methylpropyl)-1-(2-chlorophenyl)-isoquinoline-3-carboxamide), [3H/11C](R)-PK 11195, for either autoradiographic methods or PET imaging. While these studies established the potential of imaging TSPO in brain tumors, they also highlighted important limitations of PK 11195 as a molecular imaging probe. For example, despite the fact that TSPO expression can be up to 12-fold higher in brain tumors compared to normal brain (5), [11C](R)-PK 11195 uptake was shown to be relatively modest in tumors compared to normal brain tissue (≤ 2:1 T/N, (7, 9)). The high degree of non-displaceable PK 11195 binding documented in both normal brain and tumors (9) limits the ability of [11C](R)-PK 11195 to directly reflect TSPO expression. Importantly, these shortcomings, combined with the modest signal-to-noise ratio and low blood-brain barrier permeability typically observed with [11C]PK 11195 (11), could potentially be overcome by utilization of improved TSPO imaging ligands.
Recently, novel PET ligands with improved in vivo specificity for TSPO have been reported, yet presently these compounds are uncharacterized in tumor studies. Among the most promising compounds reported to date are the aryloxyanilides, including [11C]DAA1106 (12) and [18F]FEDAA1106 (13). Another aryloxyanilide, 18F-N-fluoroacetyl-N-(2,5-dimethoxybenzyl)-2-phenoxyaniline ([18F]PBR06), has recently demonstrated high affinity and specificity for TSPO across multiple species (14), suggesting the potential suitability of this probe to span preclinical and human studies. The objective of this study was to evaluate [18F]PBR06 as a candidate probe for quantitative assessment of TSPO expression in glioma. Data presented herein suggest that [18F]PBR06 is a promising tracer for visualization of TSPO expression in brain tumors, as well as quantification of TSPO in tumor tissue. Compared with the previous reports using [11C](R)-PK 11195 in brain tumor studies, [18F]PBR06 demonstrated superior TSPO specificity in vivo, resulting in close agreement between tracer accumulation and TSPO protein levels. As a role for TSPO as a biomarker in oncology continues to emerge, these findings suggest that [18F]PBR06 represents a useful imaging tool for preclinical studies and should be explored clinically in human brain tumor studies.
Materials and Methods
Chemicals
[3H]PK 11195 was purchased from PerkinElmer (Waltham, MA, USA). Phosphate buffered saline (PBS) and CytoScint ES Liquid Scintillation Cocktail were purchased from MP Biomedicals (Solon, OH, USA).
Cold Ligand and Radioligand Precursor Preparation
[19F]PBR06 (PBR06) and radioligand precursor were prepared according to published methods (15).
In Vitro Radioligand Binding Assay
Radioligand binding experiments utilizing lysates from C6 glioma cells were conducted as previously described using PBR06 as the cold ligand (16). All experiments were performed in triplicate.
Radioligand Preparation
[18F]PBR06 was prepared according to published methods (15). Using a commercial apparatus (TRACERlab FXF-N, GE Medical Systems, USA), aqueous [18F]fluoride ion (∼ 111 GBq) was dried by iterative cycles of addition and evaporation of acetonitrile, followed by complexation with K+-K+-2.2.2/K2CO3. The complex was reacted with N-bromoacetyl-N-(2,5-dimethoxybenzyl)-2-phenoxyaniline (0.8 - 1.2 mg) at 100°C for 20 min. [18F]PBR06 was purified using reversed-phase HPLC (C18, Dynamax 250 × 21.4 mm; Varian) eluted at 6.0 mL/min with 10 mM NaH2PO4 buffer (pH 6.7) and ethanol (47.5:52.5, v/v). [18F]PBR06 was collected, washed with 120 mL water (deionized), and passed through a C18 Sep-Pak. [18F]PBR06 was eluted with ethanol (1.0 mL) into a sterile flask loaded with saline (9.0 mL). Typical specific activities were ≥ 222 TBq/mmol.
Rat Model
All studies involving animals were conducted in compliance with federal and institutional guidelines. Two weeks prior to imaging, healthy male Wistar rats were stereotactically inoculated in the right hemisphere with 1.0 × 10⁵ C6 glioma cells (ATCC, Manassas, VA, USA). Prior to imaging, rats were affixed with jugular/carotid catheters.
MR Imaging
MRI was used to localize tumors. Rats were secured in a prone position in a 63 mm inner diameter radiofrequency (RF) coil and placed in a Varian 4.7T horizontal bore imaging system (Varian Inc., Palo Alto, CA). A constant body temperature of 37°C was maintained using heated air flow. An initial multislice gradient echo imaging sequence [repetition time (TR) = 150 ms; echo time (TE) = 3.5 ms; 128 × 128 matrix, 40 × 40 mm2 FOV; 2 mm slice thickness] was used to acquire seven slices in each imaging plane (axial, coronal, sagittal) for proper positioning of subsequent scans. A multislice T2-weighted fast-spin echo scan with 8 echoes and 8.6 ms echo spacing was then collected with TR = 2000 ms, 32 × 32 mm2 FOV, 128 × 128 matrix, number of acquisitions = 16, and 8 coronal slices of 2 mm thickness. The same anatomical slices were then imaged at the same FOV and resolution using a diffusion-weighted spin echo sequence [TR = 2000 ms; TE = 35.4 ms; number of acquisitions = 8; δ = 4 ms; Δ = 25 ms] at b-values of 0 and 600 s/mm2.
PET/CT Imaging
PET/CT imaging was performed within 24 h of MR imaging in rats with confirmed tumors. Tumor-bearing rats were administered ∼ 70 – 100 MBq/0.2 mL [18F]PBR06 via a jugular catheter while in a microPET Focus 220 (Siemens Preclinical Solutions, Knoxville, TN, USA). Dynamic images (90 min) were collected, followed by CT (microCAT II, Siemens Preclinical Solutions) for attenuation correction. For displacement studies, cold PBR06 (10 mg/kg) was injected via jugular catheter 30 min after radiotracer administration.
The dynamic PET acquisition was divided into twelve, five-second frames for the first minute, followed by 89 sixty-second frames for the duration of the scan. Data from all possible lines of response (LOR) were saved in the list mode raw data format. The raw data was then binned into 3D sinograms with a span of 3 and ring difference of 47. The images were reconstructed into transaxial slices (128 × 128 × 95) with voxel sizes of 0.095 × 0.095 × 0.08 cm3, after applying scatter and attenuation corrections, using an iterative ordered subsets expectation maximization (OS-EM 2D) algorithm with 16 subsets and 4 iterations. Attenuation correction was accomplished by generating an attenuation map (sinogram) from the CT image. The CT image was first co-registered with the microPET image, segmented into air, soft tissue, and bone, and then projected into sinograms with a span of 47 and ring difference of 23.
Measurement of [18F]PBR06 in Plasma
Immediately following administration of [18F]PBR06, arterial blood samples (50 μL) were collected at 10 s intervals during the first minute of scanning, followed by collection at 90 s and 2, 8, 12, 20, 30, 45, 60, 75, and 90 min. Plasma radioactivity was measured by first centrifuging blood samples (50 μL) at 14,000 rpm for 5 min in a microcentrifuge. Next, plasma (15 μL) was removed and measured in a NaI well counter (Capintec, Ramsey, NJ, USA).
HPLC Radiometabolite Analysis
Blood samples (200 μL) were collected (2, 25, 45 min) for radiometabolite analysis. Following centrifugation, plasma was extracted with acetonitrile:water (340 μL, 7.5:1, v/v). The mixture was centrifuged and the supernatant used for HPLC analysis. Radioanalysis was conducted as previously described (14). Radiochromatographic data were recorded and collected using a radioisotope detector (Bioscan, Washington, DC, USA), decay-corrected to time zero of each radiochromatogram, and smoothed using a locally weighted scatter plot smoothing (LOWESS) method (17). The plasma time-activity curve (TAC) was corrected with the fraction of unchanged radioligand.
Histology/Western Blot
Whole brains were harvested and fixed in 4% formalin for 48 h, followed by paraffin embedding. For immunohistochemistry (IHC), tissues were collected and sectioned (5.0 μm thickness). TSPO immunoreactivity was assessed using a TSPO–specific rabbit polyclonal antibody that was a gift from Professor V. Papadopoulos of McGill University, Montreal, Canada. Immunoreactivity was assessed using a HRP Detection Kit (Dako, Glostrup, Denmark). For histology quantification, optical density measurements of multi-spectral image cubes were collected using a CRI Nuance camera and the total intensity of positive pixels determined.
For western blotting, protein (50 μg) from each sample was loaded into 10% gels and resolved by electrophoresis prior to transferring to polyvinylidene fluoride membranes. Membranes were blocked in tris-buffered saline 0.1% Tween-20 (TBST) containing 5% w/v milk. Membranes were immunoblotted with TSPO antibody. Probing occurred overnight at 4°C, (1:1,000 in TBST with 5% milk), followed by incubation for 1 h at RT with HRP secondary antibody (1:4000 in TBST with 5% milk). Chemiluminescence (ECLplus; GE Healthcare-Biosciences, Piscataway, NJ, USA) was used for protein detection.
Image Analysis and Modeling
Time-activity curves (TACs) were generated by manually segmenting three-dimensional volumes of interest over tumor and contralateral brain using ASIPro (Siemens Preclinical Solutions), avoiding areas of central necrosis if present. The arterial input function (AIF) was computed from plasma sampling during imaging and corrected for metabolism of the parent ligand. A 3-compartment, 4-rate constant kinetic model was used to characterize [18F]PBR06 pharmacokinetics as previously described (15). Using the COMKAT software package (18), model parameters were estimated for constants for influx (K1) and efflux (k2) rates of radioligand diffusion between plasma and tissue compartments, and exchange between specific (k3) and non-specific binding (k4) compartments. Modeling was carried out for whole brain (excluding tumor) and tumor, individually, by fitting TACs of each region. In addition, using the first 60 min of data (beyond which, tracer was undetectable in blood), a graphical analysis method (19) was used to estimate the total distribution volume (VT) for the whole brain (excluding tumor) and tumor, with goodness of fit evaluated by inspection.
Results
Specific binding of PBR06 to TSPO in C6 glioma cell line homogenates
Previous imaging studies employed [18F]PBR06 to evaluate TSPO expression associated with microglial activation in the brain (15, 20). Given our focus on profiling TSPO expression in tumors, radioligand displacement of the high-affinity isoquinoline carboxamide TSPO ligand [3H]PK 11195 was used to evaluate the specific binding of the non-radioactive analogue PBR06 in C6 glioma cell line homogenates in vitro (Fig. 1). In these studies, PBR06 was highly specific for TSPO in C6 cell homogenates, exhibiting robust dose-dependant displacement of [3H]PK 11195 to near-background levels. Non-linear regression analysis of the binding data yielded an IC50 for PBR06 of approximately 12.6 nM in repeated studies.
FIGURE 1.

Radioligand displacement of [3H]PK 11195 using PBR06 in C6 glioma cell lysate, calculated IC50 = 12 nM. Inset, chemical structure of PBR06. Error bars denote percentage standard deviation corresponding to triplicate measurements.
In vivo uptake of [18F]PBR06 in C6 glioma
Prior to PET imaging, tumor-bearing animals were subjected to T2-weighted and diffusion-weighted MRI performed at 4.7T. In these studies, C6 tumors exhibited marked hyperintensity throughout the majority of the tumor, indicative of longer T2 relaxation times compared to surrounding brain (white matter). Furthermore, a portion of the tumors examined exhibited central core regions characterized by shorter T2 values compared to more peripheral regions (Fig. 2A). Tissues demonstrating long T2 also exhibited increased diffusion consistent with edema typical of the C6 model (Fig. 2B). Dynamic PET imaging of [18F]PBR06 illustrated that the majority of the uptake in the brain was localized to tumor tissue, with only minor uptake in adjacent normal areas of the brain (Fig. 2C). Total radioactivity levels in tumor tissue were approximately three- to four-fold higher than normal brain when compared over the last 20 minutes of the PET scan. We observed minor radioactivity in the skull that appeared to be consistent with 18F- uptake, as well as activity that appeared to be consistent with the olfactory epithelium. Across all animals studied, we found that tumor uptake tended to be slightly higher in more peripheral regions of the tumor, presumably consistent with the regions of highest proliferation and infiltrative disease. Some tumors imaged over the course of these studies exhibited modest levels of central necrosis, similar to that shown in Fig. 2. Within these tumor regions, only modest tracer uptake was observed. Figure 2D illustrates a TAC for whole tumor, normal brain, and plasma activity for a typical 90 minute scan. We found that [18F]PBR06 washed into both normal brain and tumor tissue rapidly, but the washout from tumor tissue was much slower compared to normal brain. Following the initial spike in the plasma activity consistent with tracer injection, [18F]PBR06 rapidly cleared from plasma. Immediately following imaging, brains were harvested and processed for subsequent staining and IHC. Using standard H&E staining to localize the tumor (Fig. 2E inset), we found that TSPO immunoreactivity was significantly higher in the tumor than in normal brain (Fig. 2E). Consistent with previous studies of TSPO expression in glioma, TSPO protein levels measured by IHC optical density were approximately 3.3-fold higher in tumor relative to normal brain tissue (5). Analogous to the accumulation of [18F]PBR06, TSPO expression within the tumor appeared to be somewhat higher nearer the tumor periphery (Fig. 2E), suggesting higher TSPO density in areas of active tumor proliferation. As further confirmation of the TSPO expression density in the tumor compared to the contralateral brain, western blot analysis was performed on resected tumor tissue and contralateral normal brain. Similar to the IHC studies, analysis of the relative TSPO immunoreactivity (18 kDa band) from multiple subjects demonstrated that TSPO levels were approximately three-fold higher in the tumor relative to the contralateral brain tissue (Fig. 2F). Importantly, excellent agreement was observed between [18F]PBR06 accumulation and TSPO protein levels measured by both IHC and western blot.
FIGURE 2.
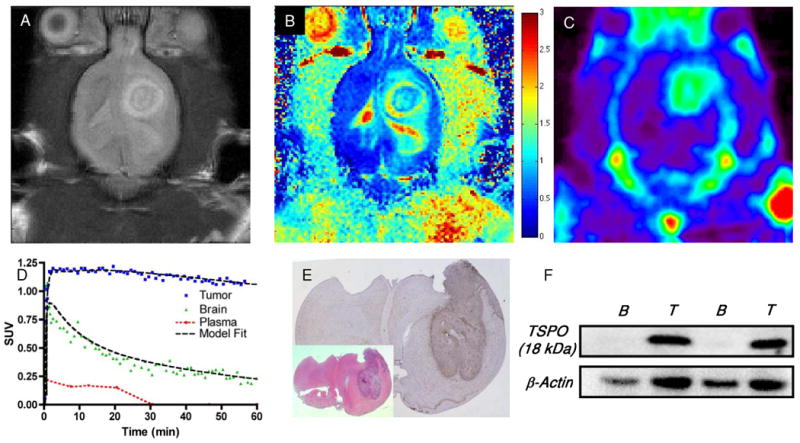
(A) T2-weighted and (B) diffusion-weighted MR images of rat bearing a C6 glioma in the right brain hemisphere. (C) PET imaging demonstrates elevated uptake of [18F]PBR06 in tumor tissues compared to contralateral brain, summed dynamic scan (0 - 90 min). (D) [18F]PBR06 time-activity curves and model fit (three-compartment, four-parameter) for tumor (blue), contralateral brain (green), and plasma (red) demonstrate rapid tracer uptake in tumor and normal brain, followed by rapid clearance from plasma and normal tissue. Comparatively slow washout of [18F]PBR06 was observed in tumor tissues, facilitating significant contrast between tumor and contralateral brain. (E) Serial histological analysis of typical C6 glioma by standard H&E staining (inset) and immunohistochemistry for TSPO expression illustrating elevated TSPO expression within tumor tissue compared to contralateral brain. (F) Western blot assay illustrating relative TSPO protein expression levels in matched contralateral brain tissue (B) and C6 glioma (T) tissues harvested from similar C6 glioma-bearing rat cohorts. Color bar in (B) corresponds to units of diffusion (μm2/ms).
In vivo displacement of [18F]PBR06
To evaluate the in vivo TSPO specificity of [18F]PBR06, we carried out displacement studies in C6-bearing rats using the cold analog, PBR06. As shown in Fig. 3, during the dynamic PET study, excess (10 mg/kg) PBR06 was administered intravenously, 30 minutes following injection of [18F]PBR06. Summation of the first 30 minutes of the PET scan prior to injection of PBR06 (0 – 30 min) demonstrated typical uptake characteristics of [18F]PBR06 (Fig. 3B). However, summation of the final 30 minutes of the PET scan (60 – 90 min) demonstrated significant displacement of [18F]PBR06 in normal brain and tumor tissue (Fig. 3C). Accordingly, TAC analysis (Fig. 3D) demonstrated that following injection of PBR06, tumor activity was reduced to approximately 25% of the peak tumor uptake. During tumor displacement, we observed a minor influx of tracer into normal brain that rapidly cleared, as well as elevated radioactivity in the plasma. In further studies, an additional injection of excess cold ligand, 45 minutes following [18F]PBR06 injection, did not result in additional displacement of the radiotracer (data not shown), suggesting that the level of displaceable binding in these studies was approximately 75%.
FIGURE 3.
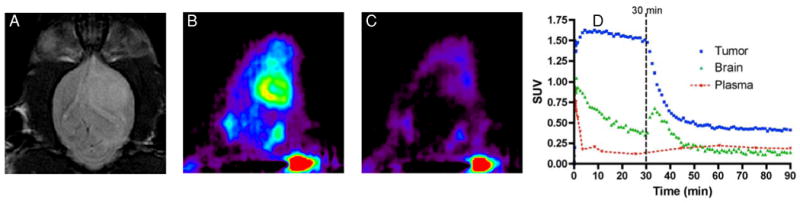
In vivo displacement of [18F]PBR06 in C6 glioma-bearing cohort. (A) T2-weighted MR image of rat bearing a C6 glioma in right brain hemisphere. Relative [18F]PBR06 uptake (B) before and (C) following intravenous infusion of excess PBR06. (D) [18F]PBR06 time-activity curves generated for tumor (blue), contralateral brain (green), and plasma (red). Immediately following infusion of [18F]PBR06, tumor activity drops to approximately 25% of maximum uptake level, accompanied by a minor, transient tracer influx observed in the contralateral brain and elevated plasma activity. Data representative of repeated imaging studies.
Characterization of [18F]PBR06 radiometabolites
Arterial blood samples were collected to assay [18F]PBR06 radiometabolites for correction of the AIF. Figure 4 illustrates a typical activity corrected reversed-phase HPLC trace of a blood sample collected two minutes following injection of [18F]PBR06. At this time point we noted the presence of both 18F- (retention time 2.8 min) and the parent ligand (10.1 min) in a respective ratio of ∼ 1:3. Analogously, 25 - 30 min blood samples routinely demonstrated significantly decreased plasma levels of parent ligand and slightly decreased levels of 18F-. In contrast to human studies using [18F]PBR06 (15), we did not observe additional radiometabolites during these studies. Plasma analysis of samples following displacement of [18F]PBR06 with PBR06 exhibited elevated levels of both parent ligand and 18F-, suggesting that tracer metabolism in this model is a plasma-specific event.
FIGURE 4.

HPLC radiochromatograms illustrating plasma composition of parent ligand ([18F]PBR06) and primary radiometabolite 18F- as a function of time following tracer injection (dotted gray line = 2 min following [18F]PBR06 injection; dotted black line = 25 min following [18F]PBR06 injection; solid black line = 45 min following [18F]PBR06 injection and 15 min following cold PBR06 injection). At 2 and 25 min following injection of [18F]PBR06, free 18F- (25% at 2.8 min, 62% at 30 min), and parent ligand (75% at 2.8 min, 38% at 30 min) are detectable in plasma. Following infusion of PBR06 30 min after administration of [18F]PBR06, both the fraction of [18F]PBR06 (57% at 45 min) and 18F- (43% at 45 min) were elevated in the plasma.
Compartmental modeling
Previous human studies have demonstrated good fitting of [18F]PBR06 imaging data to a 3-compartment, 4-kinetic parameter model for quantitative analysis in brain tissues (14). Utilizing this model and the metabolite-corrected AIF, K1, k2, k3, and k4 were solved for tumor tissue and normal brain (Table 1, curve fitting shown in Fig. 2D). We noted good agreement for measured parameters in normal brain, particularly k3 and k4, when comparing our rat studies to values previously determined in non-human primates (20). Similarly, though studies describing direct estimation of parameters in tumor tissue using [18F]PBR06 are unreported, it appeared that direct parameter estimation was possible in tumor tissue. Unlike normal brain, however, tumor tissues tended to exhibit k4 values approaching zero (Table 1). The very low k4 values resulted in estimations of VT from tumor-derived parameters (data not shown) that were not supported by direct measures of TSPO density (IHC, WB). In contrast, graphical estimation of VT, which does not depend upon direct measurement of k4, yielded statistically significant values that closely mirrored TSPO expression levels in tumor compared to normal brain (Fig. 5A/5B, Table 1). Though further study is warranted, these data suggest that graphical estimation of VT for [18F]PBR06 uptake in tumor tissue is likely superior to estimation using kinetic parameters.
TABLE 1. Parameter estimations for [18F]PBR06 uptake (mean ± S.E.).
| K1/k2 (mL/g)* | k3 (min-1)* | k4 (min-1)* | VT (mL/g)†,‡ | |
|---|---|---|---|---|
| Tumor | 5.947 ± 1.982 | 0.3870 ± 0.1592 | 5.510E-8 ± 5.501E-8 | 63.90 ± 3.400 |
| Brain | 6.164 ± 2.049 | 0.0714 ± 0.0261 | 0.009450 ± 0.005532 | 13.07 ± 3.901 |
| P value | 0.9429 | 0.1221 | 0.1628 | 0.0006 |
N = 3,
4;
From graphical analysis.
FIGURE 5.

Representative graphical analysis of the total distribution volume (VT) of one of the subjects studied in this investigation. The fit was carried out for normal brain (A) and for tumor (B). Solid grey line = Linear Regression; start time for linear regression, “t*”.
Discussion
The earliest published evidence supporting the hypothesis that TSPO ligands could be useful for detection and possibly grading of human brain tumors emerged more than twenty years ago (6, 8, 10), easily predating molecular studies seeking elucidation of TSPO's role in tumorogenesis, many of which continue today (1, 21, 22). The first proof-of-principle imaging studies employed [3H]PK 11195 and autoradiography to visualize TSPO expression in experimental models of glioma (6, 10) and post-mortem human brain sections (8). These ex vivo studies established that [3H]PK 11195, a highly selective TSPO ligand without appreciable affinity for the central benzodiazepine receptor, could discriminate brain tumors from normal cortex. Furthermore, the amount of ligand uptake appeared to be proportional to tumor aggressiveness, cell proliferation, and tumor grade (5, 8). Supported by these data, the first human PET studies using [11C]PK 11195 to image brain tumors were conducted (7, 9), and these seminal investigations led to a number of important observations. In one report, Junck et al. imaged a range of human gliomas with two different TSPO ligands, [11C]PK 11195 and [11C]Ro5-4864 (9). While both PK 11195 and Ro5-4864 are potent and selective TSPO ligands with in vitro affinity in the low nanomolar range (23), this study established the clear superiority of [11C]PK 11195 over [11C]Ro5-4864 for brain tumor imaging. PET scans with [11C]Ro5-4864 failed to demonstrate higher levels of radioactivity in tumor tissue than in normal brain, supporting an earlier autoradiography study comparing [3H]PK 11195 with [3H]Ro5-4864 (8). In contrast, [11C]PK 11195 demonstrated significantly elevated uptake in gliomas in 8/10 patients when compared to contralateral normal brain, with tumor/gray matter ratios approaching two in 3/10 patients (7). In addition to the tumor-selective nature of [11C]PK 11195, these data illustrate that chemical, biochemical, and pharmacological determinants are not well understood regarding the rational selection of TSPO ligands as potential cancer imaging probes. In subsequent investigations, Pappata et al. (9) found similar levels of [11C]PK 11195 uptake in a glioma study when compared to the study reported by Junck et al. (7). However, these authors also performed a displacement study using cold ligand and demonstrated that slightly less than 30% of the [11C]PK 11195 was displaceable. Although both of these studies suggest the utility of TSPO ligands for brain tumor imaging, the relatively modest uptake and attendant contrast afforded by [11C]PK 11195 in tumor tissue compared to normal brain, despite considerably larger differences in relative TSPO expression, coupled with high levels of non-displaceable ligand binding, suggest that exploration and development of novel TSPO ligands could improve the prospects of advancing TSPO as a cancer imaging biomarker.
Within this context, we evaluated [18F]PBR06 in the C6 preclinical model of glioma. Since this agent has yet to be reported in a cancer imaging study, we synthesized PBR06 and evaluated its in vitro specificity for TSPO in C6 tumor cell lysates. As expected, PBR06 displaced [3H]PK 11195 in the nanomolar range, indicating acceptable in vitro TSPO specificity using C6 tumor cell lysates. In vivo imaging studies using C6 glioma-bearing rats demonstrated that quantified uptake of [18F]PBR06 in tumor and normal brain accurately reflected the relative TSPO expression levels in these tissues. Specifically, we observed strikingly similar tumor/normal brain ratios when comparing: 1) total radioactivity over the last 20 minutes of the PET scan; 2) graphically estimated VT ratios (T/N); 3) TSPO protein levels as measured by IHC and western blot analysis. Moreover, we found that approximately 75% of the in vivo tumor uptake of [18F]PBR06 could be displaced with PBR06, suggesting that, unlike [11C]PK 11195, the majority of tracer uptake reflects specific TSPO binding. Interestingly, estimation of VT calculated from kinetic parameters appeared feasible in normal brain, yet tumor estimates were confounded by near-zero k4 values. Though future studies should further confirm the reversibility of [18F]PBR06 binding in various tumor tissues, importantly, graphical estimations of VT in these studies more closely reflected the relative TSPO expression in normal and tumor tissues. Thus, in this work we have reported VT estimates using graphical methods only. Complementary to studies utilizing TSPO immunoreactivity in tumors to document a relationship between TSPO protein levels and outcome (3, 24, 25), our data suggest the feasibility of carrying out similar investigations where TSPO levels are assayed using non-invasive molecular imaging. Though these studies did not specifically address the delineation of tumor-specific TSPO expression from that of a tumor-related inflammatory infiltrate, our previous studies conducted in this area (26) suggest that the relative tumor cellularity and resultant overall tumor TSPO density circumvents limitations imposed by a comparatively modest density comprised by the inflammatory microenvironment.
To the best of the authors' knowledge, this is the first tumor imaging study utilizing the aryloxyanilide-based PET ligand [18F]PBR06. Though further validation of this tracer in tumor studies is warranted, the authors envision that development of novel TSPO ligands for cancer imaging represents a potentially fruitful area of research, particularly given the increasing prevalence of preclinical PET scanners and rapid, library-based synthesis methodology. For example, we recently reported a high-throughput, microwave-assisted organic synthesis (MAOS) method adaptable to library-based synthesis of novel pyrazolopyrimidines that reduces synthetic reaction times from weeks to a few hours (27). Among the pyrazolopyrimidine class, [18F]DPA-714 is a promising TSPO PET ligand that demonstrates attractive kinetics and a high-degree of displaceable binding in non-human primates (28). Like the aryloxyanilide evaluated herein, it may be equally promising to evaluate pyrazolopyrimidine-based imaging ligands as cancer imaging probes.
Conclusion
The objective of this study was to explore the utility of [18F]PBR06 to assess TSPO expression in preclinical models of glioma. We found that [18F]PBR06 uptake accurately reflected TSPO densities in normal brain and tumor tissue and that [18F]PBR06 appears to be an ideal candidate probe for exploration of TSPO expression in other preclinical cancer models with future applications in human cancer imaging studies.
Acknowledgments
This work was supported in part by funding from the National Cancer Institute: 1R01 CA140628; K25 CA127349; 1RC1CA145138-01; 1P50CA128323; U24 CA126588. JRB, ETM, and MRH were supported by training grants: 5R25 CA092043-09; T32 EB003817; R25 CA136440. The authors gratefully acknowledge Professor Vassilios Papadopoulos of McGill University for the TSPO antibody. Clare A. Osborne, Zou Yue, and Fuxue Xin provided imaging support.
Financial Support (NIH): 1R01 CA140628, K25 CA127349; 1RC1CA145138-01; 1P50CA128323; U24 CA126588; 5R25 CA092043-09; T32 EB003817; R25 CA136440.
References
- 1.Papadopoulos V, Baraldi M, Guilarte TR, et al. Translocator protein (18 kDa): new nomenclature for the peripheral-type benzodiazepine receptor based on its structure and molecular function. Trends Pharmacol Sci. 2006 Aug;27(8):402–409. doi: 10.1016/j.tips.2006.06.005. [DOI] [PubMed] [Google Scholar]
- 2.Batarseh A, Papadopoulos V. Regulation of translocator protein 18 kDa (TSPO) expression in health and disease states. Mol Cell Endocrinol. 2010 Oct 7;327(1-2):1–12. doi: 10.1016/j.mce.2010.06.013. [DOI] [PMC free article] [PubMed] [Google Scholar]
- 3.Maaser K, Grabowski P, Sutter AP, et al. Overexpression of the peripheral benzodiazepine receptor is a relevant prognostic factor in stage III colorectal cancer. Clin Cancer Res. 2002 Oct;8(10):3205–3209. [PubMed] [Google Scholar]
- 4.Pirotte B, Goldman S, Massager N, et al. Comparison of 18F-FDG and 11C-methionine for PET-guided stereotactic brain biopsy of gliomas. J Nucl Med. 2004 Aug;45(8):1293–1298. [PubMed] [Google Scholar]
- 5.Cornu P, Benavides J, Scatton B, Hauw JJ, Philippon J. Increase in omega 3 (peripheral-type benzodiazepine) binding site densities in different types of human brain tumours. A quantitative autoradiography study. Acta Neurochir (Wien) 1992;119(1-4):146–152. doi: 10.1007/BF01541799. [DOI] [PubMed] [Google Scholar]
- 6.Black KL, Ikezaki K, Toga AW. Imaging of Brain-Tumors Using Peripheral Benzodiazepine Receptor Ligands. Journal of Neurosurgery. 1989 Jul;71(1):113–118. doi: 10.3171/jns.1989.71.1.0113. [DOI] [PubMed] [Google Scholar]
- 7.Junck L, Olson JM, Ciliax BJ, et al. PET imaging of human gliomas with ligands for the peripheral benzodiazepine binding site. Ann Neurol. 1989 Dec;26(6):752–758. doi: 10.1002/ana.410260611. [DOI] [PubMed] [Google Scholar]
- 8.Olson JM, Junck L, Young AB, Penney JB, Mancini WR. Isoquinoline and peripheral-type benzodiazepine binding in gliomas: implications for diagnostic imaging. Cancer Res. 1988 Oct 15;48(20):5837–5841. [PubMed] [Google Scholar]
- 9.Pappata S, Cornu P, Samson Y, et al. PET study of carbon-11-PK 11195 binding to peripheral type benzodiazepine sites in glioblastoma: a case report. J Nucl Med. 1991 Aug;32(8):1608–1610. [PubMed] [Google Scholar]
- 10.Starosta-Rubinstein S, Ciliax BJ, Penney JB, McKeever P, Young AB. Imaging of a glioma using peripheral benzodiazepine receptor ligands. Proc Natl Acad Sci U S A. 1987 Feb;84(3):891–895. doi: 10.1073/pnas.84.3.891. [DOI] [PMC free article] [PubMed] [Google Scholar]
- 11.Chauveau F, Boutin H, Van Camp N, Dolle F, Tavitian B. Nuclear imaging of neuroinflammation: a comprehensive review of [11C]PK11195 challengers. Eur J Nucl Med Mol Imaging. 2008 Dec;35(12):2304–2319. doi: 10.1007/s00259-008-0908-9. [DOI] [PubMed] [Google Scholar]
- 12.Yasuno F, Ota M, Kosaka J, et al. Increased binding of peripheral benzodiazepine receptor in Alzheimer's disease measured by positron emission tomography with [11C]DAA1106. Biol Psychiatry. 2008 Nov 15;64(10):835–841. doi: 10.1016/j.biopsych.2008.04.021. [DOI] [PubMed] [Google Scholar]
- 13.Fujimura Y, Ikoma Y, Yasuno F, et al. Quantitative analyses of 18F-FEDAA1106 binding to peripheral benzodiazepine receptors in living human brain. J Nucl Med. 2006 Jan;47(1):43–50. [PubMed] [Google Scholar]
- 14.Fujimura Y, Zoghbi SS, Simeon FG, et al. Quantification of translocator protein (18 kDa) in the human brain with PET and a novel radioligand, (18)F-PBR06. J Nucl Med. 2009 Jul;50(7):1047–1053. doi: 10.2967/jnumed.108.060186. [DOI] [PMC free article] [PubMed] [Google Scholar]
- 15.Briard E, Zoghbi SS, Simeon FG, et al. Single-step high-yield radiosynthesis and evaluation of a sensitive 18F-labeled ligand for imaging brain peripheral benzodiazepine receptors with PET. J Med Chem. 2009 Feb 12;52(3):688–699. doi: 10.1021/jm8011855. [DOI] [PMC free article] [PubMed] [Google Scholar]
- 16.Kozikowski AP, Kotoula M, Ma D, Boujrad N, Tuckmantel W, Papadopoulos V. Synthesis and biology of a 7-nitro-2,1,3-benzoxadiazol-4-yl derivative of 2-phenylindole-3-acetamide: a fluorescent probe for the peripheral-type benzodiazepine receptor. J Med Chem. 1997 Aug 1;40(16):2435–2439. doi: 10.1021/jm970220w. [DOI] [PubMed] [Google Scholar]
- 17.Cleveland WS, Devlin SJ. Locally Weighted Regression - an Approach to Regression-Analysis by Local Fitting. Journal of the American Statistical Association. 1988 Sep;83(403):596–610. [Google Scholar]
- 18.Muzic RF, Jr, Cornelius S. COMKAT: compartment model kinetic analysis tool. J Nucl Med. 2001 Apr;42(4):636–645. [PubMed] [Google Scholar]
- 19.Logan J, Fowler JS, Volkow ND, Wang GJ, Ding YS, Alexoff DL. Distribution volume ratios without blood sampling from graphical analysis of PET data. J Cereb Blood Flow Metab. 1996 Sep;16(5):834–840. doi: 10.1097/00004647-199609000-00008. [DOI] [PubMed] [Google Scholar]
- 20.Imaizumi M, Briard E, Zoghbi SS, et al. Kinetic evaluation in nonhuman primates of two new PET ligands for peripheral benzodiazepine receptors in brain. Synapse. 2007 Aug;61(8):595–605. doi: 10.1002/syn.20394. [DOI] [PubMed] [Google Scholar]
- 21.Hardwick M, Fertikh D, Culty M, Li H, Vidic B, Papadopoulos V. Peripheral-type benzodiazepine receptor (PBR) in human breast cancer: correlation of breast cancer cell aggressive phenotype with PBR expression, nuclear localization, and PBR-mediated cell proliferation and nuclear transport of cholesterol. Cancer Res. 1999 Feb 15;59(4):831–842. [PubMed] [Google Scholar]
- 22.Batarseh A, Li J, Papadopoulos V. Protein kinase Cepsilon regulation of translocator protein (18 kDa) Tspo gene expression is mediated through a MAPK pathway targeting STAT3 and c-Jun transcription factors. Biochemistry. 2010 Jun 15;49(23):4766–4778. doi: 10.1021/bi100020e. [DOI] [PMC free article] [PubMed] [Google Scholar]
- 23.Chaki S, Funakoshi T, Yoshikawa R, et al. Binding characteristics of [3H]DAA1106, a novel and selective ligand for peripheral benzodiazepine receptors. Eur J Pharmacol. 1999 Apr 29;371(2-3):197–204. doi: 10.1016/s0014-2999(99)00118-1. [DOI] [PubMed] [Google Scholar]
- 24.Nagler R, Ben-Izhak O, Savulescu D, et al. Oral cancer, cigarette smoke and mitochondrial 18 kDa translocator protein (TSPO) - In vitro, in vivo, salivary analysis. Biochim Biophys Acta. 2010 May;1802(5):454–461. doi: 10.1016/j.bbadis.2010.01.008. [DOI] [PubMed] [Google Scholar]
- 25.Nagler R, Savulescu D, Krayzler E, Leschiner S, Veenman L, Gavish M. Cigarette Smoke Decreases Salivary 18 kDa Translocator Protein Binding Affinity - in Association with Oxidative Stress. Curr Med Chem. 2010 May 24;17(23):2539–2546. doi: 10.2174/092986710791556050. [DOI] [PubMed] [Google Scholar]
- 26.Deane NG, Manning HC, Foutch AC, et al. Targeted imaging of colonic tumors in smad3-/- mice discriminates cancer and inflammation. Mol Cancer Res. 2007 Apr;5(4):341–349. doi: 10.1158/1541-7786.MCR-06-0225. [DOI] [PubMed] [Google Scholar]
- 27.Tang D, Buck JR, Hight MR, Manning HC. Microwave-assisted Organic Synthesis of a High-affinity Pyrazolo-pyrimidinyl TSPO Ligand. Tetrahedron Lett. 2010 Sep 1;51(35):4595–4598. doi: 10.1016/j.tetlet.2010.06.074. [DOI] [PMC free article] [PubMed] [Google Scholar]
- 28.James ML, Fulton RR, Vercoullie J, et al. DPA-714, a new translocator protein-specific ligand: synthesis, radiofluorination, and pharmacologic characterization. J Nucl Med. 2008 May;49(5):814–822. doi: 10.2967/jnumed.107.046151. [DOI] [PubMed] [Google Scholar]