Abstract
In this study, we determined the LD50 (50% lethal dose) for cell death, and the ED50 (50% of cell population staining positive) for propidium (Pr) iodide uptake, and phosphatidylserine (PS) externalization for several commonly studied cell lines (HeLa, Jurkat, U937, CHO-K1, and GH3) exposed to 10-ns electric pulses (EP). We found that the LD50 varied substantially across the cell lines studied, increasing from 51 J/g for Jurkat to 1861 J/g for HeLa. PS externalized at doses equal or lower than that required for death in all cell lines ranging from 51 J/g in Jurkat, to 199 J/g in CHO-K1. Pr uptake occurred at doses lower than required for death in three of the cell lines: 656 J/g for CHO-K1, 634 J/g for HeLa, and 142 J/g for GH3. Both Jurkat and U937 had a LD50 lower than the ED50 for Pr uptake at 780 J/g and 1274 J/g, respectively. The mechanism responsible for these differences was explored by evaluating cell size, calcium concentration in the exposure medium, and effect of trypsin treatment prior to exposure. None of the studied parameters correlated with the observed results suggesting that cellular susceptibility to injury and death by 10-ns EP was largely determined by cell physiology. In contrast to previous studies, our findings suggest that permeabilization of internal membranes may not necessarily be responsible for cell death by 10-ns EP. Additionally, a mixture of Jurkat and HeLa cells was exposed to 10-ns EP at a dose of 280 J/g. Death was observed only in Jurkat cells suggesting that 10-ns EP may selectively kill cells within a heterogeneous tissue.
Introduction
Short-duration, high voltage electric pulses (micro and millisecond duration) cause defects in the plasma membrane of cells [1], [2], [3]. These membrane defects can allow the transient passage of impermeable molecules by direct diffusion through aqueous pores or by electrophoresis. This technique has been used in conjunction with toxic agents (e.g. bleomycin) to kill specific cells and tissue, a technique called electrochemotherapy [4], [5], [6], [7]. Electric pulses can also cause irreversible membrane breakdown resulting in cell death, termed irreversible electroporation (IE) [8], [9], [10], [11], [12], [13]. Killing of unwanted cells and tissue by IE and electrochemotherapy has shown to be effective in the treatment of cancers [4], [6], [9], [11], [12], [14]. The use of ultrashort electric pulses (USEP) has emerged as a novel modality to kill cells based on theoretical and empirical results showing that USEP can cause intracellular membrane poration. Intracellular poration has been hypothesized to lead to apoptotic cell death resulting in an ordered removal of tissue by the body [15], [16], [17], [18], [19], [20]. In vivo experiments have also shown USEP to be a successful treatment for tumors [21], [22], [23]. USEP, because of their innate high frequency components, also have the potential of being delivered remotely by close-range antenna highlighting the importance of studying USEP-induced bioeffects [24], [25], [26], [27].
Despite theoretical predictions of intracellular poration and empirical results, it remains unclear whether the plasma membrane plays a role in triggering cell death following USEP exposure. Therefore, the aim of this research was to measure cell survival in relation to disruptions in the plasma membrane across several commonly studied cell lines. Previous studies have shown that different cell lines (HeLa, Jurkat, U937, HL-60, etc.) require different intensities of USEP exposures to cause death [28], [29], [30]. Unfortunately, the exposure parameters (pulse amplitude, duration, repetition rate, and number) and the cellular environment (exposure buffer) varied considerably across these studies resulting in an unclear understanding of the USEP exposure requirements for cellular death across multiple cell lines. However, it is believed that morphological and physiological differences between various cell types do influence susceptibility to injury and death by ultrashort electrical stimuli [28]. In previous work, we demonstrated that the dose required to kill Jurkat cells is substantially less than that required to kill U937 cells when exposed to 10-ns EP [29], [31]. In addition, we showed that this dose-dependent susceptibility appears only when the pulse duration is short (<300 ns) [29].
Recent work utilizing patch clamp and fluorescent microscopy has provided sufficient evidence that the plasma membrane is not spared by USEP [29], [32], [33], [34], [35], [36], [37]. Whole-cell conductance measurements in multiple cell types (CHO-K1, GH3, Jurkat, and HeLa) have shown significant changes at low exposure levels suggesting formation of long-lasting nanopores (minutes) in the plasma membrane. Results have shown a dose-dependence of nanopore formation for single and multiple pulse exposures at multiple pulse widths [36]. In agreement with patch clamp results, previous groups studying death caused by USEP have observed fast externalization (within minutes) of PS residues without uptake of propidium (Pr) iodide suggesting changes in membrane organization without large pore formation [20], [29], [34], [38], [39]. This work shows that USEP can have profound effect on the plasma membrane and that internal membrane permeabilization unlikely exists independently. A clear connection between effects on the plasma membrane of cells exposed to ultrashort pulses and cell death remains unproven. Without such a connection it will be impossible to properly guide future work aimed at determining the mechanism(s) that cells utilize to repair their membranes or die following USEP exposure and whether it is truly mechanistically different than death caused by longer duration pulses.
Materials and Methods
Cell Lines and Propagation
Experiments were performed in five cell lines, Jurkat clone E6-1 (human T-lymphocytes), U-937 (human monocytes), GH3 (rat pituitary), CHO-K1 (hamster ovarian epithelial), and HeLa (human cervical epithelial). The cells were obtained from ATCC (Manassas, VA) and propagated at 37°C with 5% CO2 at 95% humidity in air. Different media were used for culturing each cell type as per ATCC guidelines. The media and its components were purchased from ATCC and supplemented with 1% penicillin/streptomycin (ATCC). It was critical that the cell lines be exposed to 10-ns EP in a comparable way requiring the temporary suspension of adherent cultures; HeLa, GH3, and CHO-K1 cells were harvested during the logarithmic growth phase by rinsing the cells in 0.25% trypsin (ATCC) for up to 5 minutes, pelleted by centrifugation, counted on a Z1 particle counter (Beckman Coultier, Miami, FL), and resuspended at 1200 cells/µL in their respective growth medium. Jurkat and U937 cells were harvested during the logarithmic growth phase, pelleted by centrifugation, counted on the Z1 particle counter, and resuspended at 1200 cells/µL in their respective growth medium.
Exposure to 10-ns Pulses
The 10-ns exposure system has been described previously [29], [31], [40]. In brief, to produce a 10-ns EP, a Blumlein line circuit was charged from a high-voltage DC power supply until a breakdown voltage was reached across a spark gap in a pressurized switch chamber. The breakdown voltage (and, consequently, the voltage of USEP delivered to the sample) was varied from 15 to 40 kV by changing the pressure of SF6 gas in the switch chamber. The pulser control system included a programmable gas regulator, pulse counter, and GPIB outputs for communication with the high voltage power supply and digital high-speed oscilloscope (TDS3052B, Tektronix, Wilsonville, OR). The control system communicated with a PC using a specialized program written in LabVIEW® (National Instruments, Austin, TX).
For exposure, cells suspended in complete growth medium were dispensed into conventional electroporation cuvettes with 1-mm (150-µL volume) or 2-mm (400-µL volume) gap between the electrodes (BioSmith Biotech, San Diego, CA). The amplitude, number of pulses, and pulse shape were recorded for every exposure using a custom built pulsing controller and oscilloscope. The electroporation cuvettes were exposed to USEP at a room temperature (21–23°C). In each series of experiments, different EP treatments, including sham exposure, were alternated in a random sequence. Once filled with the cell suspension, cuvettes were subjected to USEP treatment within 20 minutes. All exposures were carried out at a pulse repetition frequency range of 1.7–2.2 Hz.
Dosimetry
Table 1 displays the exposure parameters used in the experimentation and the calculated dose delivered to the cuvette. Due to the variability in the pulse amplitude generated from the spark gap, electric fields were measured for every pulse and the average value was used to calculate the dose [31]. In this table, we show the number of pulses (10, 30, 100, 300, 1000) and average electric field amplitudes (65, 105, 150, 285 kV/cm) used in the exposures. The resultant dose was calculated as in previous publications [29], [31]. The individual column on the right shows the average dose as calculated by combining doses of similar magnitude into a single data point. This averaging was performed to simplify the presentation of cell survival data on the logarithmic scale.
Table 1. Exposure parameters used in this study and the calculated dose delivered to the cuvette.
| Amplitude | 65 kV/cm | 105 kV/cm | 150 kV/cm | 285 kV/cm | Average Dose (J/g) |
| Pulse Number | 12 | ||||
| 10 | 5 | 14 | 28 | 101 | 40 |
| 30 | 16 | 41 | 84 | 302 | 120 |
| 100 | 52 | 137 | 279 | 1007 | 379 |
| 300 | 157 | 410 | 837 | 3022 | 1070 |
| 1000 | 524 | 1367 | 2790 | 10072 | 2906 |
| 10072 |
The exposure parameters are shown in the top row and left column of the table. The dose calculated from these exposures is presented in corresponding cells. The average dose, generated by combining doses at a similar magnitude, is presented in the right-most column.
Cell Survival
To obtain survival data for the 5 different cell cultures at 24 hours post exposure, an MTT Cell Proliferation Assay (3-(4,5-Dimethylthiazol-2-yl)-2,5-diphenyltetrazolium bromide, ATCC, Manassas, VA) was used. Exposed cells were aseptically aliquoted into a 96-well plate, in triplicates at 50×103 cells/well, and diluted to 100 µl with fresh growth medium. The plate was incubated at 37°C, with 5% CO2 in air. At 22 hours after EP treatment, 10 µl of MTT reagent was added to each well, and incubation continued for 2 hours. Formed blue formazan crystals were dissolved by adding the solubilization buffer (100 µL/well) and placing the plate on an orbital shaker overnight. Absorbance at 570 nm was read the next day using a Synergy HT microplate reader (BioTEK, Winooski, VT), and the readings in EP-exposed samples were normalized to parallel controls.
Flow Cytometry and Confocal Microscopy
Upon exposure to 10-ns EP, aliquots of the cellular suspension were added to a tube containing full medium, 0.1% Annexin V-FITC (BD Pharmingen, San Diego, CA), and 0.02% propidium iodide (Sigma-Aldrich, St. Louis, MO). The cells were incubated for 15 minutes at room temperature, in amber tubes, in the presence of the dyes to allow for uptake of Pr and adequate binding of Annexin V-FITC [18], [41], [42]. Following this incubation period, the cells were quickly resuspended by mild vortexing and analyzed with an Accuri C6 Flow Cytometer (Accuri Cytometers, Inc., Ann Arbor, MI). Samples were run in triplicate at a set analysis volume (75 µL). Sham-exposed samples and those treated with 0.005% digitonin were used as negative and positive controls, respectively. Flow analysis was performed by gating the cellular population and appropriately compensating the fluorescent overlap between Annexin V-FITC and Pr channels. Percentage of positive fluorescent expression in the gated population was measured by applying a threshold to the sham population, allowing for approximately 5–10% of the cells to appear as positive. This binary analysis method was used to ensure highest possible sensitivity for membrane permeabilization. The expression of PS was measured following exposure of each cell type to 100, 10-ns pulses at four distinct E-field intensities (35, 60, 105, 150 kV/cm). The uptake of Pr was measured by exposing each cell population to a high E-field (200 kV/cm for Jurkat, GH3 and 285 kV/cm for U937, HeLa, CHO-K1) at increasing pulse numbers (10, 30, 100, 300). Survival data was processed and plotted using Grapher® software (Golden Software, Golden, Colorado). Flow cytometry results were processed in C6 software (Accuri Cytometers, Inc., Ann Arbor, MI) and FCSExpress software (DeNovo Software, Los Angeles, CA). Final analysis and presentation of flow cytometry results were also generated using Grapher®.
Confocal images of cells were taken following USEP exposure to validate flow cytometry measurements. Cells exposed to either 100 pulses at 105 kV/cm, or 0.005% digitonin, or sham-exposed, were stained similarly to the above protocol for flow cytometry. Following the labeling procedures, cells were placed into a dish containing a glass bottom coverslip (MatTek Corp, Ashland, MA) and placed on a Zeiss 710 LSM microscope (Zeiss MicroImaging, Thornwood, NY). Fluorescent images of Jurkat were captured simultaneously by two PMT's, set for Pr (>590 nm) and FITC (500–550 nm) emission wavelength ranges, using 488 nm argon laser excitation through a 20X, 0.8 NA objective. Brightfield images were also captured using the 488 nm argon laser and the transmission PMT channel. Images were processed using Zen® software (Zeiss MicroImaging, Thornwood, NY).
Calcium Measurement and Calcium-doped Exposure
Calcium concentration of each complete medium was measured using a QuantiChrom™ Calcium Assay Kit (BioAssay Systems, Hayward, CA). The kit was used according to the manufacturer's protocol and the samples were read on the BioTek Synergy HT (BioTek, Winooski, VT) at 612 nm. Using a standard curve of known calcium dilutions, the concentration of calcium for each cell line's complete medium was determined. To investigate the impact of additional calcium within the exposure medium, calcium chloride was added to Jurkat media to final calcium concentrations of 2.1 mM or 5.1 mM. Jurkat cells were placed in the calcium-doped medium and exposed to increasing pulse numbers at 60 kV/cm. Following exposure the MTT assay was run as previously described.
Effect of Trypsin on Cell Survival
In order to expose adherent cells within an electroporation cuvette, trypsin treatment was unavoidable. To determine whether trypsin treatment has an impact on cell survival, Jurkat cells were exposed to trypsin to mimic an equivalent experimental protocol as employed for the adherent cell lines. To do this, Jurkat cells were rinsed in a PBS (ATCC) solution and suspended in a 5% trypsin solution. After 5 minutes, cell medium was added to the flask and the cells were allowed to rest for 30 minutes. Cells were exposed to 60 k V/cm using 10, 30, 100, or 300 pulses. Following exposure, the cells were placed in a well plate and allowed to recover over a 24-hour period. MTT assay was used to assess cellular survival.
Simultaneous Exposure of Jurkat and HeLa Cell Lines
It was unclear whether the sensitivity observed in single cell exposures would hold true in a heterogeneous sample. To study this, HeLa and Jurkat cells were counted using a Z1 particle counter (Beckman Coultier, Miami, FL) and mixed at a 50% cell ratio in complete growth medium (RPMI 1640 media with 10% FBS and 1% pen/strep). The heterogeneous mixture was allowed to grow for 96 hours to eliminate any artifacts brought on by sudden change of media for HeLa cells. Prior to exposure, the supernatant containing Jurkat cells was removed and trypsin was used to isolate HeLa cells. The two populations were then recounted and remixed within an electroporation cuvette at 50% cell ratio for exposure. Cells were exposed to 100 pulses at 0 and 150 kV/cm. The exposed populations were plated and allowed to grow for 24 hours in RPMI 1640 medium. Following that growth period Jurkat cells were removed with the supernatant and separate MTT assays were run for both cell lines.
Results and Discussion
Cell Viability
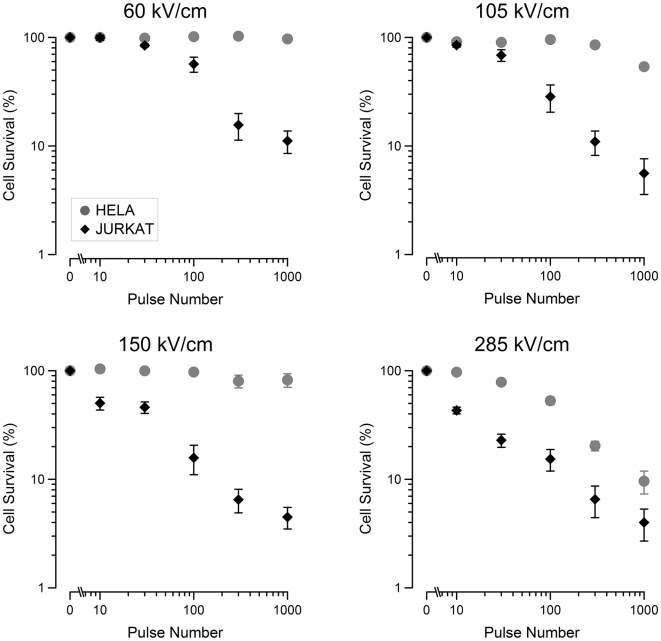
Figure 1 shows the cell survival recorded by MTT for Jurkat and HeLa cells exposed to increasing pulse numbers at 60, 105, 150, and 285 kV/cm. Jurkat cells appear to be more sensitive to the effects of 10-ns pulse exposure than HeLa cells at all exposure levels. Increased death with increasing pulse number or pulse amplitude is seen in both cell lines. As in the previous work, a resistive tail remains within the populations; this is due either to non-uniform sample exposure or to a subpopulation of cells that are abnormally resistant [29]. In contrast to Jurkat cells, HeLa cells respond only to the highest electric field and show an increasing effect with increasing pulse number.
Figure 1. Jurkat and HeLa survival decreases with increasing electric field amplitude and pulse number.
Cell survival curves for Jurkat and HeLa cells exposed to 60, 105, 150, and 285 kV/cm. The data shows that the number of cells that survive post-exposure decreases with increasing electric field and pulse number. For all exposures, Jurkat cells are more sensitive than HeLa cells. Data points represent the average survival. (mean +/−s.e., n = 3–5).
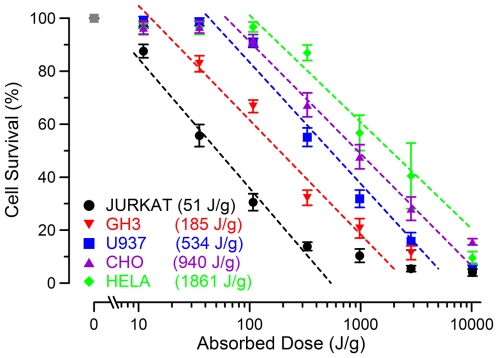
In Figure 2, we show the resulting cell survival data for all 5 cell types as related to the average dose calculated in Table 1. A logarithmic fit was applied to the data to calculate the point at which 50% of the cells die (LD50). HeLa, the most resistant cell line tested, had an LD50 of 1861 J/g whereas Jurkat cells, the most sensitive cell line, had an LD50 of 51 J/g. This represents a nearly 40 times increase in dose needed to kill one cell type versus another. The slopes of the dose response curves for each cell line are quite similar suggesting that the mechanism responsible for cell death may be the same. Shifts in the dose response curve suggest that acute membrane and internal cellular damage may depend on cellular physiology and/or different cell lines may be better able to repair damage by active and passive mechanisms following 10-ns EP exposure.
Figure 2. Cell survival as determined by dose in several cell types.
Mean survival values (+/− s.e., in % relative to sham-exposed control, n = 3–5) are plotted against the dose delivered to the cuvette. Logarithmic fit lines (dashed) reveal significant differences between cell populations. LD50 values (J/g) are displayed in the legend for each population as calculated using the logarithmic fit.
Measuring Plasma Membrane Disruption by Flow Cytometry
To better understand the mechanism responsible for cellular death across the different cell lines, we chose to focus on the plasma membrane. It is unclear whether subtle membrane disruption is, in itself, a stressful enough event to cause cell death. To investigate subtle changes induced in the plasma membrane, we chose to monitor the externalization of phosphatidylserine (PS) molecules on the outer leaflet of the plasma membrane by utilizing FITC-labeled Annexin V dye. The chain of events leading to the externalization of PS following USEP exposure remains unknown with hypotheses proposing lateral diffusion of PS through nanopores within the membrane [34] and calcium influx-induced activation of scramblase [43]. Despite the ambiguity of the mechanism ultimately causing externalization of PS, it remains a reliable marker of membrane disruption known to occur at thresholds well below that for propidium ion uptake.
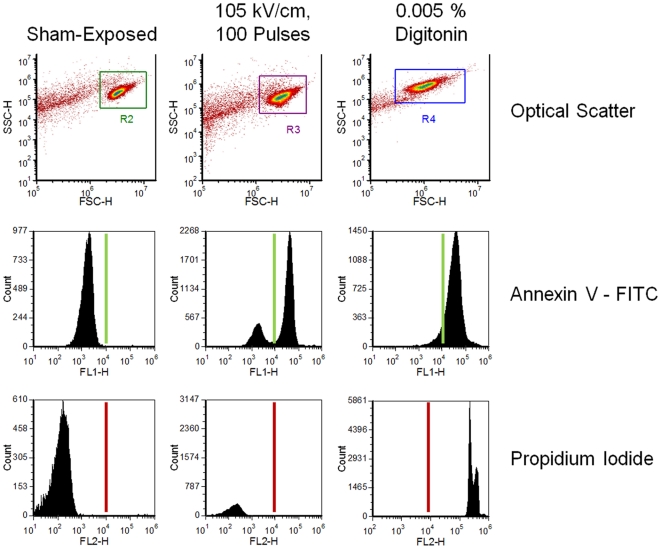
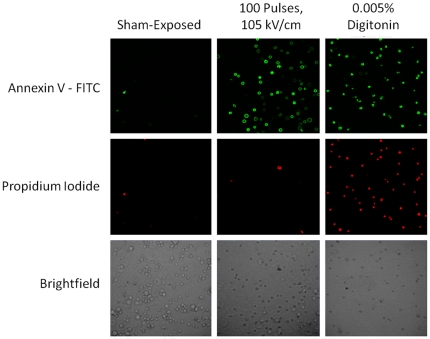
Figure 3 shows raw flow cytometry data from Jurkat cells. The forward and side scatter density plots of the pure cell population along with the compensated reading from both fluorescent channels is shown (for cells exposed to 105 kV/cm, 100 pulses, 0.005% digitonin, or sham-exposed). The USEP-exposed cells show a substantial portion of the population expressing PS on the plasma membrane surface, while remaining impermeable to Pr. In contrast, digitonin causes plasma membrane degradation allowing the influx of Pr and positive staining for PS. Flow cytometry data were obtained for both fluorescent dyes using a threshold based on the sham-exposed population. Figure 4 shows laser scanning confocal microscopy images for each fluorescent dye and a corresponding brightfield image. The first column of images shows minimal positive expression of Annexin V-FITC and Pr occurs in the sham population. The second column of images show that cells exposed to 100, 10-ns EPs at 105 kV/cm positively express Annexin V-FITC with minimal Pr fluorescence. In the third column, the positive control, 0.005% digitonin, shows positive expression of both dyes. While these images can only show a small subset of the exposed population, they agree well with flow cytometry results presented in Figure 3.
Figure 3. Binary determination of positive phosphatidylserine (PS) expression and propidium uptake by flow cytometry.
Plots of the forward and side scatter (top) of sham-exposed cells, and cells exposed to either 105 kV/cm USEP or 0.005% digitonin (positive control for both dyes). Histograms of fluorescent count for Annexin V-FITC (middle) and PI (bottom) are also shown. The solid line represents the threshold used to determine the percent of the cellular population that stains positive for each dye.
Figure 4. Confocal fluorescent images of Annexin V-FITC expression in USEP-exposed Jurkat.
Images detail the fluorescent staining of Jurkat cells following sham-exposure, exposure to 100 USEP at 105 kV/cm, and 0.005% digitonin.
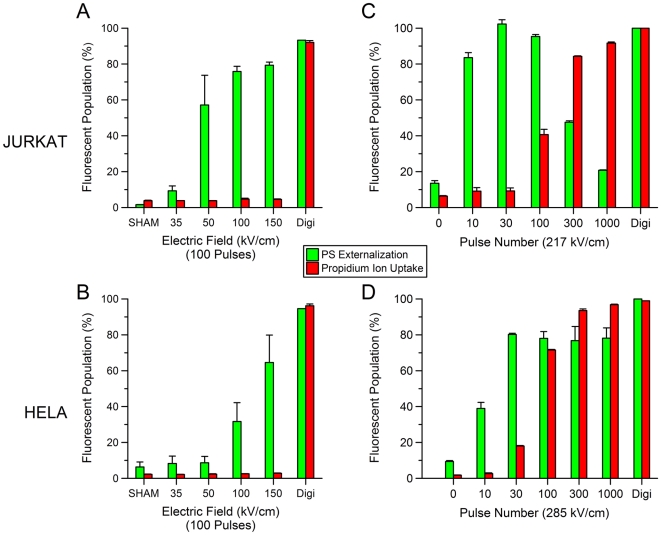
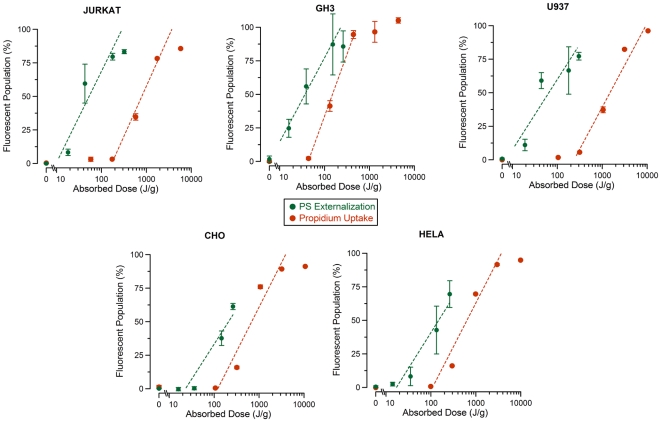
Figure 5 shows the flow cytometry results for Jurkat (A,C) and HeLa (B,D) cell lines. The USEP-exposed Jurkat (A) were positive for PS externalization without substantial uptake of Pr, thus agreeing with previous publications [26], [39]. When compared to HeLa (B), Jurkat appear to externalize PS at lower field strength, suggesting that physiological differences between the cells likely cause differences in sensitivity. This finding reinforces previous results obtained using patch clamp technique that showed that HeLa required substantially higher electric field than Jurkat to obtain the same measured changes in plasma membrane conductance [37], [44]. Figure 5C & D show two graphs depicting the results obtained by increasing the electric field to 215 kV/cm for Jurkat and 282 kV/cm for HeLa and increasing the pulse number. In both cell lines, Pr can be brought into the cell if enough pulses are delivered. A substantial drop in cells showing PS externalization is seen at the highest pulse numbers for Jurkat cells. The reason for this drop is unknown, but substantial changes in cell morphology are seen in the forward and side scatter channels at these exposure levels (data not shown). Figure 6 shows the resulting dose-response curves for PS externalization and Pr uptake of all cell lines studied. These data show that the thresholds for PS externalization is lower than for Pr uptake for all cell types tested. Interestingly, the thresholds for PS appear to vary, whereas the thresholds for Pr uptake, with the exception of GH3, appear quite similar.
Figure 5. The effect of the E-field and pulse number on USEP-induced externalization of phosphatidylserine (PS) and uptake of propidium ions (Pr).
PS and Pr fluorescent expression for Jurkat (A,C) and HeLa (B,D) exposed to increasing electric fields between 0–150 kV/cm at 100 pulses per exposure and 0.005% digitonin. Externalization of PS appears in Jurkat at lower field amplitudes than in HeLa. Both cell lines exposed to digitonin stained positive for both PS and Pr. C and D show percent of Pr positive Jurkat and HeLa after exposure to increasing number of pulses at 217 and 285 kV/cm, respectively. (mean +/− s.d., n = 3 measurements of 25,000 cells).
Figure 6. Dose dependence of PS externalization and PI uptake for different cell lines.
The percent of the cellular population expressing Annexin V -FITC and Pr was plotted versus absorbed dose for all cell lines tested. Dashed lines represent the logarithmic fit to the data. (mean +/− s.d., n = 3 measurements of 25,000 cells).
Plasma membrane disruption versus cell death
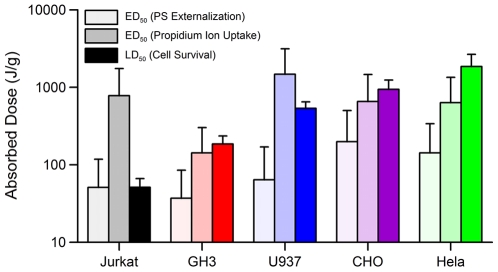
In Figure 7, we have compared LD50 to the effective doses (ED50) to cause 50% of cells to externalize PS and to cause 50% of cells to uptake Pr. HeLa, GH3 and CHO-K1 become permeable to Pr at doses that are at or below that required for cell death. This result suggests that intracellular membrane permeabilization is not likely to be solely responsible for cell death at 10-ns duration exposures. We conclude that the mechanism by which these cells die may be quite similar to that of irreversible electroporation. The data also shows that Jurkat and U937 have LD50's below that of the ED50 for Pr uptake. This result suggests that these cells either experience much delayed Pr uptake (greater than 15 minutes post exposure) and die by a similar mechanism as the other cell lines or die by a completely different mechanism possibly related to regulation of ion imbalance. However, we show that for all cell lines, the dose required for death always exceeds that for PS externalization. These results do in fact show, as seen in Figure 3, that the dose delivered by changing the amplitude or number of 10-ns pulses will have a different effect on different cell types. In other words, these data suggest that killing of cells by 10-ns pulses is potentially selective due to inherent differences in cellular physiology.
Figure 7. Comparison of ED50 for PS externalization and propidium uptake with LD50 in different cell lines.
Error bars represent the 95% confidence intervals, as calculated from best fit using logarithmic function (see Fig. 2 and 6).
Role of Cell Size in Cell Survival
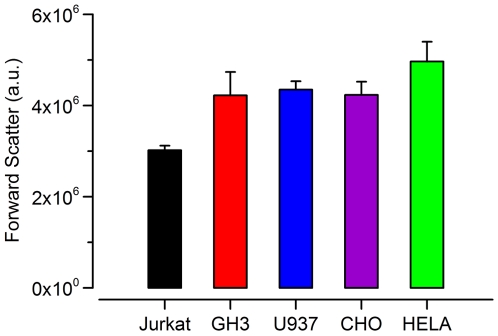
Conventional electroporation theory states the radius of the cell in a uniform field increases the induced steady-state transmembrane potential. This theory suggests that a smaller cell will be less apt to form pores than a larger cell due to a smaller induced transmembrane potential [2], [3], [45], [46], [47], [48]. While the assumptions built into this theory apply specifically to micro and millisecond duration pulses, cell size will likely impact the degree of membrane poration for USEP exposures as well [49], [50]. To investigate this, we measured cell size across the studied cell lines using the forward scattering channel of the flow cytometer. Figure 8 shows that Jurkat are the smallest followed by a nearly even sizing of GH3, CHO-K1, and U937, with HeLa being the largest. This result would suggest that Jurkat should be less vulnerable to poration at any given dose than HeLa. Our flow cytometry data suggests the opposite, with the ED50 for PS externalization being lower for Jurkat than HeLa. Interestingly, Jurkat have nearly the same ED50 for Pr uptake as HeLa, but a large difference is seen in cell survival. This mirrors results by Cemazar et al. that showed multiple cell lines exposed to 100 µs EPs, at 1 Hz, have nearly identical thresholds for Pr uptake, but saw large differences in survival. They too noted that the smallest cells (SA-1 sarcoma) proved the most electrosensitive, while ETA, the largest cells proved the least electrosensitive [51]. Agarwal et al. studied the response of single cells to ms duration EP and determined that larger cells were easier to permeabilize, but harder to kill as the permeabilization affected only a small portion of the overall cell surface [48]. This theory would hold true for Jurkat and HeLa cell lines given the data presented within this manuscript, but the data for the remaining three cell lines of nearly equal size requires additional explanation. Overall, it does not appear that cell size is the only factor dictating the degree of membrane disruption and cell survival.
Figure 8. Cell size in tested cell lines as estimated by forward light scattering.
Bar height represents the mean of three samples of each cell line and the error bars represent the standard deviation.
Impact of Extracellular Calcium Concentration on Cellular Survival
The culture media used for each cell type contained different amounts of calcium. The impact of calcium concentration on cell death caused by 10-ns EP is not known and may have contributed to the observed cell-type specific differences in survival. Figure 9A shows the composition of calcium within each individual cell medium measured experimentally. Specifically, Jurkat and U937 are in RPMI 1640 medium, CHO-K1 and GH3 are in F12K medium (GH3 media has 2.5% horse serum), and HeLa is in EMEM medium. Although the differences in Ca concentration between the tested media were small, we sought to better understand the impact of calcium on cell survival. To do this, we exposed Jurkat to USEP in media containing 0.6, 2.1, and 5.1 mM calcium (Figure 9B). These experiments established that, additional calcium has a deleterious effect on the Jurkat cell viability (Figure 9C). Additional calcium causes a distinct left shift of the dose-response curve with the predicted LD50 dropping from 39 to 9.7 J/g. Assuming this calcium-dependent increase in cell death is not cell-type specific, one would expect HeLa to have a lower LD50 than Jurkat; however the opposite is presented in Figure 2. Furthermore, one could expect that if HeLa were placed in medium containing less calcium, they may be even more resistant to USEP-induced death. This data suggests that, while increasing medium calcium concentration lowers the LD50 in Jurkat exposures, the differences in cell survival across the cell lines are unlikely due to inherent differences in medium calcium concentration.
Figure 9. Differences in calcium concentration between different culture media are not responsible for differences in USEP-induced cell death.
A: measured calcium concentrations in cell media. B: normalized 24-hr survival of Jurkat in media with modified Ca content. Increasing the external calcium has a negative effect on cell survival. C: a logarithmic fit to data by dose and the predicted LD50 values. (mean +/− s.e, n = 3).
Impact of Trypsin Treatment on Cell Survival
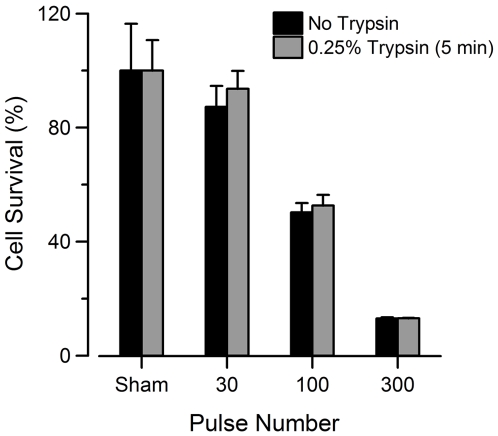
The use of trypsin to detach adherent cultures for exposure could be a confounding factor affecting the response of adherent cells to USEP. Previous work has shown that cells exposed to trypsin showed trypan blue uptake for up to 90 minutes post exposure implying cells were dead [52], [53]. However, electropermeabilization of plasma membranes can be a lasting effect taking hours to fully recover depending on the exposure conditions and cellular environment [54], [55]. We aimed to determine the effect of trypsin on cell survival within our experiments by treating Jurkat with trypsin similarly to adherent cell lines. Figure 10 shows that Jurkat cells exposed to trypsin have nearly the same degree of cell death as those not exposed to it. Based on these finding, we believe that exposure of cells to trypsin does not impact 24-hour survival following USEP exposure.
Figure 10. Trypsin treatment does not affect survival of USEP-exposed Jurkat cells.
Jurkat cells were exposed to 0, 30, 100, or 300, 10-ns pulses at 60 kV/cm. MTT absorbance measurements were taken 24 hours post exposure. Trypsin treatment appears to have no effect on long-term survival of Jurkat cells. (mean +/− s.e, n = 3).
Exposure of Heterogeneous Sample
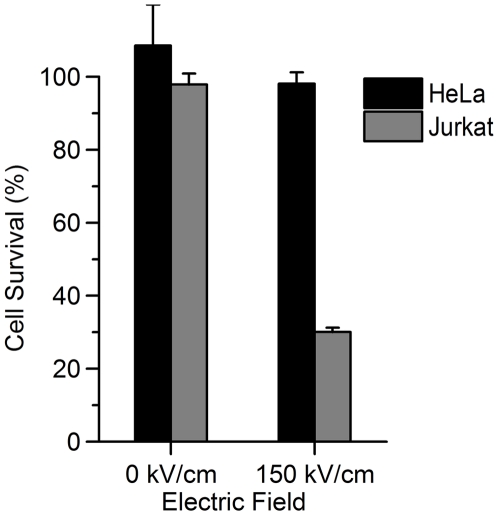
Figure 11 shows the MTT results from a combined exposure of HeLa and Jurkat cells in RPMI media. USEP exposure heavily impacted the viability of the Jurkat cells with little or no effect on HeLa at 150 kV/cm. While these data are not meant to be a conclusive look at the impact of USEP in heterogeneous samples, they show that large differences seen in isolated cell exposures can translate into a heterogeneous exposure system. Additionally, HeLa and Jurkat were exposed in the same medium and similar results to Figure 2 were seen suggesting that exposure of individual cultures in their respective media had little or no effect on observed differences in survival.
Figure 11. Dose-dependent changes in survival are retained in a heterogeneous cell mixture.
Jurkat and HeLa cells were exposed in mixture to a 100 pulse train of 10-ns EP at 150 kV/cm, resulting in efficient killing of Jurkat but little effect on HeLa cells. (mean +/− s.e, n = 3).
Summary
This paper compared the LD50 for cellular death to the ED50 for plasma membrane disruption, using two endpoints, across various cell lines. We have shown that all cells studied externalize PS at lower doses than Pr uptake. We found that some cell lines (HeLa and CHO-K1) appear to respond only to high doses of USEP and that observed effects progressed from subtle membrane changes (PS externalization) to Pr uptake to death. In contrast, Jurkat and U937 had LD50 values well below the ED50 for Pr uptake. This finding suggests that the cell lines chosen in previous studies may have led to conclusions about specific USEP-induced cellular effects that are unlikely to be true for all cell types.
We also investigated the mechanism responsible for the observed differences in cellular survival by investigating the impact cell size, calcium concentration, and trypsinization may have on cell survival. We found that increasing calcium concentration in the external media lowered the LD50, and that trypsin exposure had no appreciable impact on cellular survival. By combining HeLa and Jurkat in RPMI medium, to form a heterogeneous sample, we found that we could achieve preferential kill based on the estimated dose obtained from homogenous sample exposures. These results show the potential for USEP to kill cells preferentially based on inherent susceptibilities across diverse cell lines. While this specific finding requires future work to determine the mechanism(s) that determine cellular susceptibility and proving its validity in a biologically relevant tissue, the potential of this finding for biomedical applications of USEP cannot be ignored.
Acknowledgments
The authors would like to acknowledge Mr. John Ashmore for improvements made to the existing 10-ns pulse system enabling proper real-time monitoring of pulse shape, number of pulse, and pulse amplitude. The authors would also like to acknowledge Mr. Frank Ruhr and Mr. Charles Kuhnel for re-engineering the electrical connections within the 10-ns pulser. In addition, the authors would like to thank Dr. Justin Teissie for his constructive comments and suggestions that undoubtedly improved this research.
Footnotes
Competing Interests: The authors have declared that no competing interests exist.
Funding: The study was supported in part by the Air Force Office of Scientific Research, by Air Force Surgeon General Clinical Investigation Program, by the National Cancer Institute R01CA125482, and by the National Institute of General Medical Sciences R01GM088303. The funders had no role in study design, data collection and analysis, decision to publish, or preparation of the manuscript.
References
- 1.Teissie J, Eynard N, Gabriel B, Rols MP. Electropermeabilization of cell membranes. Adv Drug Deliv Rev. 1999;35:3–19. doi: 10.1016/s0169-409x(98)00060-x. [DOI] [PubMed] [Google Scholar]
- 2.Neumann E, Sowers AE, Jordan CA, editors. New York: Plenum; 1989. Electroporation and Electrofusion in Cell Biology. [Google Scholar]
- 3.Weaver JC. Electroporation of Biological Membranes from Multicellular to Nano Scales. IEEE Transactions on Dielectrics and Electrical Insulation. 2003;10:754–768. [Google Scholar]
- 4.Mir LM, Orlowski S, Belehradek J, Jr, Paoletti C. Electrochemotherapy potentiation of antitumour effect of bleomycin by local electric pulses. European Journal of Cancer and Clinical Oncology. 1991;27:68–72. doi: 10.1016/0277-5379(91)90064-k. [DOI] [PubMed] [Google Scholar]
- 5.Heller R, Jaroszeski MJ, Reintgen DS, Puleo CA, DeConti RC, et al. Treatment of cutaneous and subcutaneous tumors with electrochemotherapy using intralesional bleomycin. Cancer. 1998;83:148–157. doi: 10.1002/(sici)1097-0142(19980701)83:1<148::aid-cncr20>3.0.co;2-w. [DOI] [PubMed] [Google Scholar]
- 6.Mir LM, Glass LF, Sersa G, Teissie J, Domenge C, et al. Effective treatment of cutaneous and subcutaneous malignant tumours by electrochemotherapy. Br J Cancer. 1998;77:2336–2342. doi: 10.1038/bjc.1998.388. [DOI] [PMC free article] [PubMed] [Google Scholar]
- 7.Cemazar M, Grosel A, Glavac D, Kotnik V, Skobrne M, et al. Effects of electrogenetherapy with p53wt combined with cisplatin on curvival of human tumor cell lines with different p53 status. DNA Cell Biol. 2003;22:765–775. doi: 10.1089/104454903322624975. [DOI] [PubMed] [Google Scholar]
- 8.Davalos R, Mir L, Rubinsky B. Tissue Ablation with Irreversible Electroporation. Annals of Biomedical Engineering. 2005;33:223–231. doi: 10.1007/s10439-005-8981-8. [DOI] [PubMed] [Google Scholar]
- 9.Neal R, Davalos R. The feasibility of irreversible electroporation for the treatment of breast cancer and other heterogeneous systems. Ann Biomed Eng. 2009;37:2615–2625. doi: 10.1007/s10439-009-9796-9. [DOI] [PubMed] [Google Scholar]
- 10.Rubinsky J, Onik G, Mikus P, Rubinsky B. Optimal parameters for the destruction of prostate cancer using irreversible electroporation. J Urol. 2008;180:2668–2674. doi: 10.1016/j.juro.2008.08.003. [DOI] [PubMed] [Google Scholar]
- 11.Al-Sakere B, Andre F, Bernat C, Connault E, Opolon P, et al. Tumor ablation with irreversible electroporation. PLoS One. 2007;2:e1135. doi: 10.1371/journal.pone.0001135. [DOI] [PMC free article] [PubMed] [Google Scholar]
- 12.Miller L, Leor J, Rubinsky B. Cancer cells ablation with irreversible electroporation. Technol Cancer Res Treat. 2005;4:699–705. doi: 10.1177/153303460500400615. [DOI] [PubMed] [Google Scholar]
- 13.Rubinsky B, editor. Berlin Heidelberg: Springer-Verlag; 2010. Irreversible Electroporation. [Google Scholar]
- 14.LandstrÖM FJ, Nilsson CO, Crafoord S, Reizenstein JA, Adamsson GBM, et al. Electroporation Therapy of Skin Cancer in the Head and Neck Area. Dermatologic Surgery. 2010;36:1245–1250. doi: 10.1111/j.1524-4725.2010.01617.x. [DOI] [PubMed] [Google Scholar]
- 15.Hall E, Schoenbach K, Beebe S. Nanosecond pulsed electric fields induce apoptosis in p53-wildtype and p53-null HCT116 colon carcinoma cells. Apoptosis. 2007;12:1721–1731. doi: 10.1007/s10495-007-0083-7. [DOI] [PubMed] [Google Scholar]
- 16.Beebe SJ, Fox PM, Rec LJ, Somers K, Stark RH, et al. Nanosecond Pulsed Electric Field (nsPEF) Effects on Cells and Tissues: Apoptosis Induction and Tumor Growth Inhibition. IEEE Transactions on Plasma Science. 2002;30:286–292. [Google Scholar]
- 17.Beebe SJ, Fox PM, Rec LJ, Willis EL, Schoenbach KH. Nanosecond, high-intensity pulsed electric fields induce apoptosis in human cells. Faseb J. 2003;17:1493–1495. doi: 10.1096/fj.02-0859fje. [DOI] [PubMed] [Google Scholar]
- 18.Deng J, Schoenbach KH, Buescher ES, Hair PS, Fox PM, et al. The effects of intense submicrosecond electrical pulses on cells. Biophys J. 2003;84:2709–2714. doi: 10.1016/s0006-3495(03)75076-0. [DOI] [PMC free article] [PubMed] [Google Scholar]
- 19.Schoenbach KS, Hargrave B, Joshi RP, Kolb J, Osgood C, et al. Bioelectric Effects of Nanosecond Pulses. IEEE Transactions on Dielectrics and Electrical Insulation. 2007;14:1088–1109. [Google Scholar]
- 20.Hall E, Schoenbach K, Beebe S. Nanosecond pulsed electric fields (nsPEF) induce direct electric field effects and biological effects on human colon carcinoma cells. DNA and cell biology. 2005;24:283–291. doi: 10.1089/dna.2005.24.283. [DOI] [PubMed] [Google Scholar]
- 21.Garon EB, Sawcer D, Vernier PT, Tang T, Sun Y, et al. In vitro and in vivo evaluation and a case report of intense nanosecond pulsed electric field as a local therapy for human malignancies. Int J Cancer. 2007;121:675–682. doi: 10.1002/ijc.22723. [DOI] [PubMed] [Google Scholar]
- 22.Nuccitelli R, Chen X, Pakhomov AG, Baldwin WH, Sheikh S, et al. A new pulsed electric field therapy for melanoma disrupts the tumor's blood supply and causes complete remission without recurrence. Int J Cancer. 2009;125:438–445. doi: 10.1002/ijc.24345. [DOI] [PMC free article] [PubMed] [Google Scholar]
- 23.Nuccitelli R, Pliquett U, Chen X, Ford W, James Swanson R, et al. Nanosecond pulsed electric fields cause melanomas to self-destruct. Biochem Biophys Res Commun. 2006;343:351–360. doi: 10.1016/j.bbrc.2006.02.181. [DOI] [PMC free article] [PubMed] [Google Scholar]
- 24.Xiao S, Altunc S, Kumar P, Baum CE, Schoenbach KH. A Reflector Antenna for Focusing Subnanosecond Pulses in the Near Field. IEEE Antennas and Propogation Society. 2010;9:12–15. [Google Scholar]
- 25.Chen X, Liang J, Wang S, Wang Z, Parini C. Antennas and Propagation Conference, 2008 LAPC 2008 Loughborough; 2008. Small ultra wideband antennas for medical imaging. pp. 28–31. [Google Scholar]
- 26.Schoenbach KH, Shu X, Camp JT. IEEE International Power Modulators and High Voltage Conference, Proceedings of the 2008; 2008. Subnanosecond Electrical Pulses for Medical Therapies and Medical Imaging. pp. 60–60. [Google Scholar]
- 27.Xiao S, Migliaccio MA, Camp JC, Kolb JF, Schoenbach KH, et al. A wide-band focusing system for bioelectric applications. Pulsed Power Conference, 2007 16th IEEE International. 2007;1:744–747. [Google Scholar]
- 28.Stacey M, Stickley J, Fox P, Statler V, Schoenbach K, et al. Differential effects in cells exposed to ultra-short, high intensity electric fields: cell survival, DNA damage, and cell cycle analysis. Mutat Res. 2003;542:65–75. doi: 10.1016/j.mrgentox.2003.08.006. [DOI] [PubMed] [Google Scholar]
- 29.Ibey BL, Pakhomov AG, Gregory BW, Khorokhorina VA, Roth CC, et al. Selective cytotoxicity of intense nanosecond-duration electric pulses in mammalian cells. Biochimica et Biophysica Acta (BBA) - General Subjects. 2010;1800:1210–1219. doi: 10.1016/j.bbagen.2010.07.008. [DOI] [PMC free article] [PubMed] [Google Scholar]
- 30.Vernier PT, Yinghua S, Jingjing W, Mya Mya T, Garon E, et al. Engineering in Medicine and Biology Society, 2005 IEEE-EMBS 2005 27th Annual International Conference of the; 2005. Nanoelectropulse Intracellular Perturbation and Electropermeabilization Technology: Phospholipid Translocation, Calcium Bursts, Chromatin Rearrangement, Cardiomyocyte Activation, and Tumor Cell Sensitivity. pp. 5850–5853. [DOI] [PubMed] [Google Scholar]
- 31.Pakhomov AG, Phinney A, Ashmore J, Walker K, Kolb JF, et al. Characterization of the cytotoxic effect of high-intensity, 10-ns duration electrical pulses. IEEE Transactions on Plasma Science. 2004;32:1579–1585. [Google Scholar]
- 32.Ibey BL, Mixon DG, Payne JA, Bowman A, Sickendick K, et al. Plasma membrane permeabilization by trains of ultrashort electric pulses. Bioelectrochemistry. 2010;79:114–121. doi: 10.1016/j.bioelechem.2010.01.001. [DOI] [PMC free article] [PubMed] [Google Scholar]
- 33.Vernier PT, Sun Y, Gundersen MA. Nanoelectropulse-driven membrane perturbation and small molecule permeabilization. BMC Cell Biol. 2006;7:37. doi: 10.1186/1471-2121-7-37. [DOI] [PMC free article] [PubMed] [Google Scholar]
- 34.Vernier PT, Sun Y, Marcu L, Craft CM, Gundersen MA. Nanoelectropulse-induced phosphatidylserine translocation. Biophys J. 2004;86:4040–4048. doi: 10.1529/biophysj.103.037945. [DOI] [PMC free article] [PubMed] [Google Scholar]
- 35.Pakhomov AG, Bowman AM, Ibey BL, Andre FM, Pakhomova ON, et al. Lipid nanopores can form a stable, ion channel-like conduction pathway in cell membrane. Biochem Biophys Res Commun. 2009;385:181–186. doi: 10.1016/j.bbrc.2009.05.035. [DOI] [PMC free article] [PubMed] [Google Scholar]
- 36.Ibey BL, Xiao S, Schoenbach KH, Murphy MR, Pakhomov AG. Plasma membrane permeabilization by 60- and 600-ns electric pulses is determined by the absorbed dose. Bioelectromagnetics. 2009;30:92–99. doi: 10.1002/bem.20451. [DOI] [PMC free article] [PubMed] [Google Scholar]
- 37.Pakhomov AG, Kolb JF, White JA, Joshi RP, Xiao S, et al. Long-lasting plasma membrane permeabilization in mammalian cells by nanosecond pulsed electric field (nsPEF). Bioelectromagnetics. 2007;28:655–663. doi: 10.1002/bem.20354. [DOI] [PubMed] [Google Scholar]
- 38.Vernier PT, Ziegler MJ, Sun Y, Chang WV, Gundersen MA, et al. Nanopore Formation and Phosphatidylserine Externalization in a Phospholipid Bilayer at High Transmembrane Potential. Journal of the American Chemical Society. 2006;128:6288–6289. doi: 10.1021/ja0588306. [DOI] [PubMed] [Google Scholar]
- 39.Vernier PT, Aimin L, Marcu L, Craft CM, Gundersen MA. Ultrashort pulsed electric fields induce membrane phospholipid translocation and caspase activation: differential sensitivities of Jurkat T lymphoblasts and rat glioma C6 cells. Dielectrics and Electrical Insulation, IEEE Transactions on. 2003;10:795–809. [Google Scholar]
- 40.Kolb JF, Kono S, Schoenbach KH. Nanosecond pulsed electric field generators for the study of subcellular effects. Bioelectromagnetics. 2006;27:172–187. doi: 10.1002/bem.20185. [DOI] [PubMed] [Google Scholar]
- 41.Kennedy SM, Ji Z, Hedstrom JC, Booske JH, Hagness SC. Quantification of Electroporative Uptake Kinetics and Electric Field Heterogeneity Effects in Cells. Biophysical journal. 2008;94:5018–5027. doi: 10.1529/biophysj.106.103218. [DOI] [PMC free article] [PubMed] [Google Scholar]
- 42.Chen G, Daly K. Ljubljana, Slovenia: 15th International Symposium on High Voltage Engineering.; 2007. Delayed poration after ultrashort electric pulses on Jurkat cell. [Google Scholar]
- 43.Hampton MB, Vanags DM, Isabella Pörn-Ares M, Orrenius S. Involvement of extracellular calcium in phosphatidylserine exposure during apoptosis. FEBS Letters. 1996;399:277–282. doi: 10.1016/s0014-5793(96)01341-5. [DOI] [PubMed] [Google Scholar]
- 44.Pakhomov AG, Shevin R, White JA, Kolb JF, Pakhomova ON, et al. Membrane permeabilization and cell damage by ultrashort electric field shocks. Arch Biochem Biophys. 2007;465:109–118. doi: 10.1016/j.abb.2007.05.003. [DOI] [PubMed] [Google Scholar]
- 45.Grosse C, Schwan HP. Cellular membrane potentials induced by alternating fields. Biophysical journal. 1992;63:1632–1642. doi: 10.1016/S0006-3495(92)81740-X. [DOI] [PMC free article] [PubMed] [Google Scholar]
- 46.Chang DC, editor. San Diego: Academic Press, Inc; 1992. Guide to Electroporation and Electrofusion. [Google Scholar]
- 47.Kotnik T, Miklavcic D. Theoretical Evaluation of Voltage Inducement on Internal Membranes of Biological Cells Exposed to Electric Fields. Biophysical journal. 2006;90:480–491. doi: 10.1529/biophysj.105.070771. [DOI] [PMC free article] [PubMed] [Google Scholar]
- 48.Agarwal A, Zudans I, Weber EA, Olofsson J, Orwar O, et al. Effect of Cell Size and Shape on Single-Cell Electroporation. Analytical Chemistry. 2007;79:3589–3596. doi: 10.1021/ac062049e. [DOI] [PMC free article] [PubMed] [Google Scholar]
- 49.Vasilkoski Z, Esser AT, Gowrishankar TR, Weaver JC. Membrane electroporation: The absolute rate equation and nanosecond time scale pore creation. Physical Review E. 2006;74 doi: 10.1103/PhysRevE.74.021904. [DOI] [PubMed] [Google Scholar]
- 50.Smith KC, Weaver JC. Active Mechanisms Are Needed to Describe Cell Responses to Submicrosecond, Megavolt-per-Meter Pulses: Cell Models for Ultrashort Pulses. Biophysical Journal. 2008;95:1547–1563. doi: 10.1529/biophysj.107.121921. [DOI] [PMC free article] [PubMed] [Google Scholar]
- 51.Cemazar M, Jarm T, Miklavcic D, Lebar A, Ihan A, et al. Effect of Electric-Field Intensity on Electropermeabilization and Electrosensitmty of Various Tumor-Cell Lines In Vitro. Electromagnetic Biology and Medicine. 1998;17:263–272. [Google Scholar]
- 52.Winterbourne DJ, Thomas S, Hermon-Taylor J, Hussain I, Johnstone AP. Electric shock-mediated transfection of cells. Characterization and optimization of electrical parameters. Biochemical Journal. 1998;251:427–434. doi: 10.1042/bj2510427. [DOI] [PMC free article] [PubMed] [Google Scholar]
- 53.Lorenz A, Just W, da Silva Cardoso M, Klotz G. Electroporation-mediated transfection of Acholeplasma laidlawii with mycoplasma virus L1 and L3 DNA. J Virol. 1988;62:3050–3052. doi: 10.1128/jvi.62.8.3050-3052.1988. [DOI] [PMC free article] [PubMed] [Google Scholar]
- 54.Saulis G. Pore disappearance in a cell after electroporation: theoretical simulation and comparison with experiments. Biophysical journal. 1997;73:1299–1309. doi: 10.1016/S0006-3495(97)78163-3. [DOI] [PMC free article] [PubMed] [Google Scholar]
- 55.Saulis G. Kinetics of pore disappearance in a cell after electroporation. Biomed Sci Instrum. 1999;35:409–414. [PubMed] [Google Scholar]


