Abstract
We present numerical modeling and experimental studies of flow optimization inside a batch microfluidic micro-reactor used for synthesis of human-scale doses of Positron Emission Tomography (PET) tracers. Novel techniques are used for mixing within, and eluting liquid out of, the coin-shaped reaction chamber. Numerical solutions of the general incompressible Navier Stokes equations along with time-dependent elution scalar field equation for the three dimensional coin-shaped geometry were obtained and validated using fluorescence imaging analysis techniques. Utilizing the approach presented in this work, we were able to identify optimized geometrical and operational conditions for the micro-reactor in the absence of radioactive material commonly used in PET related tracer production platforms as well as evaluate the designed and fabricated micro-reactor using numerical and experimental validations.
Keywords: Flow optimization, Microfluidic, Positron emission tomography, Fluorescence imaging, Microreactor, Numerical modeling
Introduction
The concept of individualized medicine and the use of radiopharmaceuticals for early diagnostics and patient treatment progress monitoring has drawn a lot of interest in the field of healthcare and pharmaceutical research (Pither 2003; Eckelman et al. 2008; Weber 2005). One of the emerging methods for reliable diagnostics and treatment monitoring is Positron Emission Tomography (Phelps 2000; Nutt 2002; Czernin and Phelps 2002) which is used in a wide spectrum of fields including oncology (Dresel 2008; Vallabhajosula 2007; Shu et al. 2005; Varagnolo et al. 2000), neurology (Mishina 2008; Shoghi-Jadid et al. 2002), cardiology (Knuuti and Bengel 2008) and inflammation (Laverman et al. 2008; de Vries et al. 2008). Recently, there have been a lot of reports of studies related to location and efficacy of targeted therapeutics using PET imaging (Wang 2005). The concept of PET relies on incorporation of short-lived positron-emitting radioisotopes (e.g., 18F or 11C) into small molecules thereby labeling them as biomarkers or tracers capable of reaching within specific target tissue. Numerous PET-probes have been discovered and studied since the PET technology emerged as an effective method of diagnostics with more under development in both industry and academia. However, the nature of short half-life isotopes and complexity of synthesis of biomarkers have posed major problems in development of these PET probes (Elizarov et al. 2010). Applying the concept of Lab-on-a-chip seems to be an attractive solution (Huebner et al. 2008; Hashimoto et al. 2006; Hatakeyama et al. 2006; Roberge et al. 2005; Watts and Haswell 2003; Kawaguchi et al. 2005; Liu et al. 2003; Chan et al. 2003) as a) the amount of solvent and reagents can be reduced substantially, b) higher concentration and additional efficiency from rapid heat transfer and mass transport can be achieved, c) easier modification of the microfluidic reaction chamber (chip) for different types of biomarkers can be obtained, and d) portability of the device relative to conventional instruments can be enhanced. Recently, several approaches to microfluidic methods of production of the most common PET tracer, [18F] FDG have been reported (Recent reviews include, Elizarov 2009; Miller 2009; Lu and Pike 2007). Many of those works rely on reactions performed in moving solutions (Wester et al. 2009; Gillies et al. 2006; Yu et al. 2006; Steel et al. 2007) while others have used batch CRC type devices (Lee et al. 2005). The advantage of batch-type devices is that all processes of the radiosynthesis are integrated into the chip, including solvent evaporations and exchange that are not possible in flow-through devices.
Recently, we reported a batch microfluidic device with increased reactor capacity for production of larger amounts of PET tracers (Elizarov et al. 2010; van Dam et al. 2007) up to the clinical scale. A large size (5 mm diameter × 250 micron deep) coin-shaped reactor was substituted for the ring-shaped channel (100 μm wide) developed by Lee et al. In the radiosynthesis of PET tracers, it is critical for the incoming reagents to be thoroughly and rapidly mixed with the contents of the reactor after the previous step. Because of the large length-scale of the reactor, diffusion alone is insufficient to achieve rapid mixing, and approaches based on active circulation (van Dam et al. 2007; Haeberle et al. 2005) (e.g. with mechanical deformations, reciprocating flows, centrifugal flow, or micro-stir bars) or passive flow patterns (Yang et al. 2009; Lin et al. 2007; Chung et al. 2004) (e.g. vortex mixers) are required. The advantage of passive methods is simpler device fabrication, but studies have typically assumed continuously flowing fluids rather than the problem here of loading a reagent into a reactor that is already partially-filled. Here we study the two passive mixing approaches under the latter conditions: a lamination approach based on a multi-input reagent manifold and a high-velocity jet with inertia.
A second requirement for PET tracer synthesis chips is that their contents must be eluted efficiently (without significant dilution) after the synthesis in order to undergo purification and quality control. In a ring-shaped reactor, the contents can be readily eluted with air; but this is not effective in the coin-shaped reactor; liquid must be employed to help flush out the liquid contents of the reactor. We investigate the effect of entrance angle and flow rate of a single eluent input and product output channel in order to achieve recovery of the product in minimal volume.
These mixing and elution concepts are investigated via a combination of fluorescence imaging and numerical modeling, enabling optimization of operation parameters and geometry. The combination of fluorescence studies and numerical simulations addresses another important challenge facing development and optimization of batch or flow-through PET tracer reactors: working with radioactivity. Typically, one requires protective radiation shielding and measurement equipment, and the need to allow time for radioactive decay after each experiment limits the throughput of studies. Applying numerical methods (Ansari and Kim 2009) and experimental studies in the absence of radioactivity to better understand the dynamics of flow and material transport inside the reaction chamber are an attractive solution to overcome some of those shortcomings.
The work here is generalizable to microfluidic devices containing large-volume chambers in other application areas.
Fabrication of microfluidic chip
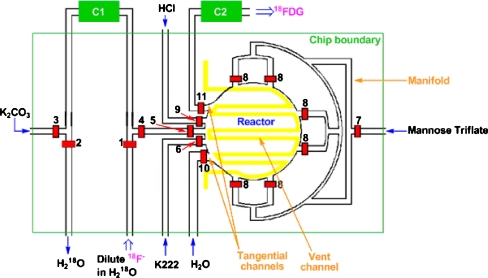
The coin shaped microfluidic chip (Fig. 1) was fabricated using the soft lithography method (Erickson 2005) in a class 1000 clean room environment. The general procedure for the fabrication of integrated, multilayer elastomeric microfluidics chips has been described elsewhere (c.f. 11g). Fully-cured chips were interfaced with reagents and control pneumatics via steel tubes inserted into the punched chip ports with the other end of the steel tubes connected to flexible PTFE tubing leading to reagent vials or controlled pressure sources.
Fig. 1.
Complete design of the “coin-shaped reactor” chip. C1 is the ion exchange column, and C2 is the product purification column, both located off-chip. Reagents are introduced or removed through the indicated channels, via open valves 1–11. The radiator vent is shown in yellow. The light green square outlines the physical boundaries of the chip
Numerical modeling
To better understand the flow inside the reaction chamber, a numerical model of the reaction chamber was developed. The three-dimensional steady state incompressible Navier Stokes equations along with time dependant elution scalar field convection-diffusion equation were solved using COMSOL Multiphysics (COMSOL Multiphysics User’s Guide and Modeling Guide, Version 3.3, COMSOL, Stockholm, Sweden). The numerical studies covered two important aspects of the flow as primary focus. The first aspect was the angle the flow enters the reaction chamber and its effect on the quality of mixing inside the reactor. The second aspect was the effect of different back pressures imposed on the reactor inlet to induce optimal elution of the product out of the reaction chamber.
A top view of the basic simulation geometry is shown in Fig. 2. The inlet and outlet of the reactor are simplified as 20 μm high 250 μm wide channels that intersect the cylindrical cell reactor. The angle α depicts the angle between the inlet/outlet to the normal of the reactor. The angle β depicts the angle between the location of the inlet and outlet. Both angles α and β were varied systematically. The inlet flow rate was specified by a uniform velocity boundary condition at the inlet. Zero pressure was specified at the outlet boundary condition. The no-slip boundary condition was specified for the remaining surfaces.
Fig. 2.
Top view of the simulation geometry for the cell reactor for two baseline geometries considered in this study. The symbol α defines the angle between the inlet/outlet to the normal of the reactor geometry. The symbol β defines the angle between the location of the inlet and outlet. (a) the straight through geometry is defined by α = 0° and β = 180°, (b) the second baseline geometry is defined by α = 45° and β = 60°
Figure 3 shows the 3-D meshed geometry. Approximately 26 × 103 three-dimensional tetrahedron elements were used in a typical simulation. The mesh is more highly resolved near the inlet because of the large velocity gradients associate with the fluid jetting out of the inlet. Simulations were conducted with higher resolution meshes to ensure the solutions were grid independent.
Fig. 3.
Three-dimensional geometry of the reactor for two baseline cases. Typically, the mesh consists of approximately 26 × 103 3-D tetrahedron elements. Near the inlet, the elements are more refined to better resolve the fluid jetting out of the inlet into the reaction chamber: (a) straight through geometry defined by α = 0° and β = 180°, (b) second baseline geometry defined by α = 45° and β = 60°
Experimental studies
Mixing and elution optimization inside the fabricated reaction chamber were studied using fluorescent imaging techniques. For mixing quality evaluation testes, the reactor was partially filled with an aqueous dye solution (Alexa Fluor4 fluorophore dye; 0.1 mg/mL) followed by dead end injection of pure water and monitoring the quality of mixing over time. The gas permeable ceiling allowed dead end filling of the reactor during various tests cases. A Nikon Eclipse E800 microscope (equipped with Hamamatsu ORCA-ER camera) was used to acquire images of the reaction chamber. The efficiency of product elution was also studied using fluorescent imaging method. The water eluent was delivered from completely filled Tygon tubing (ID 0.05 cm, 360 cm total length). Total fluorescence emission within the reactor was monitored to record elution efficiency. The elution process was considered complete when the total reactor fluorescence measure had decreased by 95% of the initial value.
Results and discussions
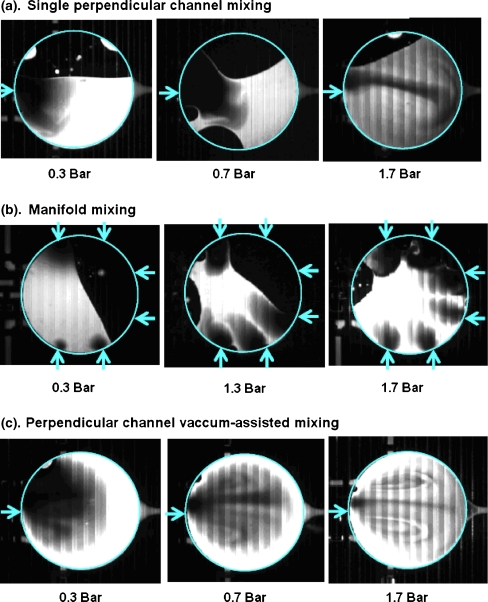
For the experimental studies of mixing optimization, water entered the reactor partially filled with fluorescent water through the single straight channel at a given back pressure. When dye entered the reactor through the single straight channel, the two liquids stayed virtually unmixed, the incoming liquid merely filling the available space, up until all the water had filled the reactor and motion had been ceased as seen in Fig. 4(a). Mixing was very slow, occurring only by diffusion at the boundary of the two liquids. At water pressures of 1.7 bar or higher, when the fluid’s flow rate (and inertia) was substantially increased, a more complex jet-like stirring pattern of the two liquids was achieved, somewhat increasing the interface area between the two liquids and accelerating mixing. However at such pressures, risk of valve failure was expected to increase and therefore such high pressures were undesirable.
Fig. 4.
Mixing study images were recorded within 2 s subsequent to water delivery (before any diffusion can take place). Dark areas represent water and light areas represent fluorescent dye solution. Pattern of vertical lines is due to the vent channel above the reactor. Arrows represent location of reactor ports
Next we evaluated the mixing characteristics of the 6-inlet manifold (Fig. 4(b)), based on the idea that simultaneous fluid entry from multiple ports could improve the mixing as more layers of the fluid will be generated and increasing the interfacial area. Although diffusion-dominated mixing was improved by utilizing multiple port liquid entry, the inertia-driven aspect of mixing turned out to be less pronounced than the case of single channel case. This observation has two contributing factors: a) six jets of water counteract each other in a symmetric fashion pushing and containing all the initial reactor contents toward the center of the reactor and b) the water inertia was reduced as a single channel flow rate split between the six ports. The overall impact of the loss of the jet-like stirring pattern decreased mixing effectiveness, despite the increase in interfacial area due to the six incoming streams.
We returned to the single straight channel tests with high inertia which has been reported to contribute to the enhanced mixing (Duffy et al. 1998; Mautner 2004). The velocity of the fluid entrance jet could be further increased by reducing the reactor pressure through the vacuum vent, increasing the net pressure driving the fluid into the reactor and thus increasing the total flow rate (Fig. 4(c)). By applying negative pressure to the vent line, gaseous contents of the reactor were removed through the membrane. This is observed by an absence of the initial air bubble in Fig. 4(c) compared to Fig. 4(a) and (b). In this condition, the entry port to the reactor was opened by actuating the valve and thereby filling the reactor using the resulting higher pressure. The increased local pressure gradient resulted in a greater inlet velocity to the reactor. This “vacuum-assisted” method led to significant improvement of mixing at 0.7 bar inlet pressure. With 1 bar of inlet pressure, mixing was enhanced further by the formation of pronounced vortex patterns as demonstrated in Fig. 4(c). Lamination of the fluid stream into thin layers reduces the diffusion length and improves the overall mixing. We validated that such mixing was sufficient by driving the reaction of mannose triflate with 18F− resulting in completion of the reaction within 2.5 min.
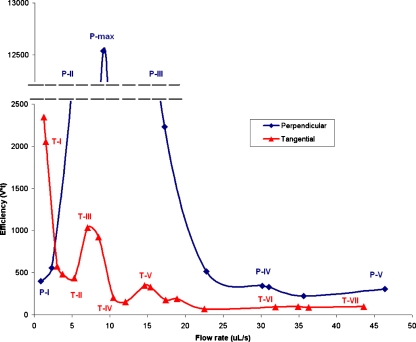
We next investigated the efficiency of product elution using fluorescent imaging. In the context of radiopharmaceutical synthesis, the reactor begins in a completely filled state (reaction product), and this product must be eluted such that recovery is high and volume is low. The coin-shaped reactor was uniformly filled with Alexa Fluor 4 solution. Two channels were opened simultaneously—one to deliver pressurized water eluent and the other which was kept at atmospheric pressure to allow the contents to exit to a collection vial. The water eluent was delivered from completely filled Tygon tubing (ID 0.05 cm, 360 cm total length). Total fluorescence emission within the reactor was monitored to record elution efficiency, and elutions were considered complete when the total reactor fluorescence has decreased by 95%. The 95% elution volume (V95) was calculated from the filled exit tubing length. The 95% elution time (t95) was another key value of interest due to the importance of speed when working with short-lived radioisotopes. Different elution conditions were compared in terms of their “efficiency” defined as the product of V95 and t95 (Fig. 5).
Fig. 5.
Elution trends with perpendicular and tangential patterns. Efficiency is a product of time and elution volume
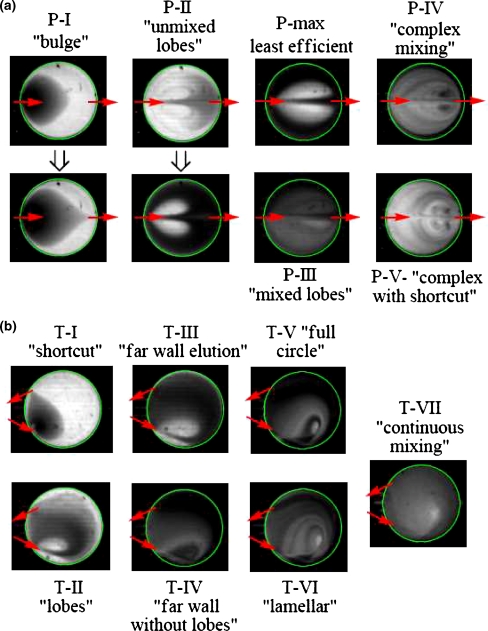
Two elution channel geometries were selected for the tests. One geometry had entrance and exit channels perpendicular to the reactor circumference (e.g., Fig. 1, port 5) located opposite to one another (Fig. 6(a)) and the other geometry utilized the tangential entrance (e.g., Fig. 1, ports 10 and 11) and exit channels (Fig. 6(b)). Correlating Figs. 5 and 6, one can see that at certain flow rates, the difference of elution efficiency value between the two geometries is very significant while the same value being similar at other flow rates. The tangential elutions were always more efficient than perpendicular ones with the optimum conditions being met at several local minima such as those presented by T-II and T-IV where letter “T” corresponds to tangential entry/exit configuration as shown in Fig. 5. While pattern T-II, observed at these flow rates is slightly less efficient than pattern T-IV, it only requires fluid pressures of 0.5–0.8 bar, an advantage for reducing the risk of valve failure during operation. The conditions of T-II were chosen for the optimized radio-synthesis. Note that pattern T-VI would not be a suitable choice due to increased time of elution resulting in further decay of the radioactive dose.
Fig. 6.
Patterns observed during elution studies with various flow rates perpendicular (a) and tangential (b) inlet/outlet geometries
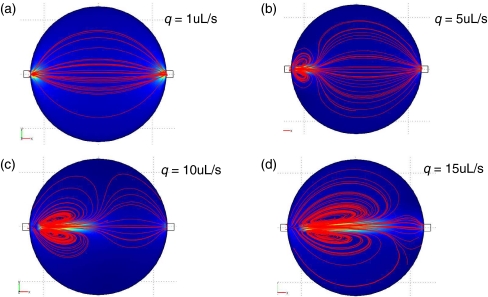
We next performed simulation on the modeled geometry discussed earlier. Figure 7 shows the velocity magnitude and streamlines for flow rates q = 1, 5, 10, 15 μl/s. As observed in Fig. 7(a), the low flow rate q = 1 μl/s has an inlet Reynolds number Re = 4. In this case, inertia does not play an important role and the flow is distributed over the entire reactor. For higher flow rates, inertia becomes more dominant as a jet of the fluid enters the reactor. This is clearly indicated by the recirculating vortices depicted by the streamlines. These recirculating vortices can lower the efficiency of the elution process. We will address this in more details later.
Fig. 7.
Flow patterns for the baseline case where α = 0, β = 180 with varying inlet flow rates. The blue color represents low fluid velocity magnitude, while the orange color represents high fluid velocity magnitude. Streamlines of the fluid are indicated in red. (a) q = 1 uL/s, (b) q = 5 uL/s, (c) q = 10 uL/s, (d) q = 15 uL/s
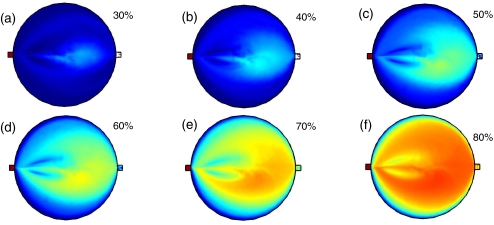
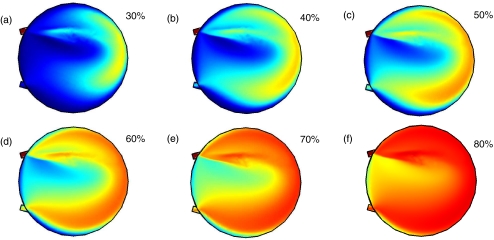
The results of the scalar elution are shown in Fig. 8 with the blue color corresponding to c = 0 where there is no elution fluid and red color representing c = 1 with completely eluted fluid. The degree of elution is calculated by averaging the concentration over the reactor volume shown in Fig. 8 ranging from 6% to 69%.
Fig. 8.
Scalar fields during elution for the baseline case where α = 0, β = 180 with an inlet flow rate q = 15 uL/s. The blue color indicates no elution fluid, while the red color indicates elution fluid. The percent of elution shown are: (a) 30%, (b) 40%, (c) 50%, (d) 60%, (e) 70%, (f) 80%
Elution patterns observed with the straight channel geometry change with increasing flow rate (Figs. 5 and 6(a); patterns S-I–S-V). The slowest flow rates (0–2.5 μl/s, Re = 0–10; Pattern S-I) lead to most volume-efficient elution that do not rely on inertia. As water enters the reactor, it produces a liquid front that does not mix with the reactor contents but forces undiluted contents through the opposite side exit channel. The eluent stream will eventually break through the original reactor content after which the elution becomes less efficient. The lower the flow rate, the more undiluted “product” can exit before the eluent breaks through to the exit port and thus at extremely low flow rates, elution efficiency is the maximized.
The steep increase in elution volume is dominated by Pattern S-II as inertia becomes significant and Reynolds number rises above 10. The eluent enters rapidly and breaks through to the opposite side of the reactor. Some eluent has sufficient inertia to hit the farthest wall, change direction and return along the two sides to join the entering jet. Consequently, two fluorescent stagnating lobes which are emptied primarily by diffusion into the surrounding moving water that have little chance to be eluted are created. At higher flow rates, these un-eluted “lobes” increase in size and elution efficiency decreases. The peak of elution inefficiency is characterized by a two-lobe pattern (S-max) at a 12 μl/s flow rate (Re = 60). At rates higher than 12 μl/s inertial mixing becomes important and pattern S-III dominates. In this case no bright and dark stagnant regions are observed, but rather a gradual decline in reactor fluorescence light intensity over time as the contents are removed by dilution. The elution efficiency does not change significantly between 23 and 36 μl/s flow rates. At higher flow rates, (up to 46 μl/s, Re = 240) elution efficiency drops as some of the entering liquid pushes directly to the exit channel (Pattern S-V).
Tangential elutions exhibit a more complex flow pattern sequence with increasing flow rate (Figs. 5 and 6(b); patterns T-I–T-VII). There are several local minima and maxima in efficiency rather than a single peak. The existence of these extrema is due to many qualitatively different flow patterns observed as flow rate is changed. There are three ranges (patterns) of flow rates that lead to very efficient elutions, and those ranges alternate with highly inefficient elutions. In Pattern T-I (0–1.5 μl/s, Re < 10) the eluent has little inertia and follows the path of least resistance with little mixing, shortcutting from entrance to the exit, leaving most of the original reactor contents behind in the reactor. This inefficient pattern is determined by the relative proximity of the ports, rather than their tangential geometry.
As the flow rate increases and the incoming fluid gains more inertia, the direction of the initial “jet” approaches more closely the direction of the channel. However, the entering inertia is insufficient for the fluid to cross the entire layer of reactor content: the eluent gets turned around, generating the “lobe” pattern (Pattern T-II). This more efficient elution is followed through the first local minimum (3–7 μl/s, Re = 15–40) corresponding to V95.T95 ≈ 500. Its relative efficiency rises because the stream of eluent extends further into the reactor to force more contents out.
Pattern T-III (7–9 μl/s, Re = 40–50) requires the most eluent. Stagnant lobes dominate this elution, similar to Pattern S-II. However, compared to straight channel elution, tangential channel elution required about ¼ the amount of eluent at similar flow rates.
As the flow rate is increased (10–12 μl/s, Re = 50–60) Pattern T-IV is formed. A rapidly flowing jet of fluid washes the far wall of the reactor first. No bright regions are observed indicating the importance of dilution effects in this pattern. This pattern constitutes the second local minimum.
Pattern T-V (14–21 μl/s, Re = 70–110) is characterized by another loss of efficiency. The efficiency of this structured pattern decreases because the entering jet of fluid has sufficient inertia to follow the trajectory along the far wall of the reactor to the exit. Some eluent makes a full circle along the circumference, uniting with the incoming jet. This pattern is then conceptually similar to one large lobe which stays un-eluted for a long time as eluent moves around it. Similar behavior can be seen in Fig. 6(b).
Further efficiency minima and maxima are observed at higher flow rates. The optimal elution conditions are created with tangential channels operated at flow rates in the narrow range of 3–5 μl/s. While Pattern T-II, observed at 5 μl/s flow rate is only slightly less efficient than patterns T-IV and T-VI, it only requires fluid pressures of 0.5–0.8 bar, an advantage for reducing the risk of valve failure during operation.
Comparing the plots for the tangential and perpendicular elutions in Fig. 5, the former are more efficient at all flow rates except for the extremely slow ones which due to decaying nature of radio isotopes and importance of timely delivery of the dose are not attractive. Such flow rates are very difficult to maintain pneumatically. Slight increase in flow rate leads to an immediate loss of efficiency in the straight elution case. Therefore, a tangential elution exhibiting similar efficiency at a higher flow rate was considered to be a more robust choice.
Further observations can be made from the two baseline geometry simulations resembling the location of the inlet and exit ports in the actual reactor. For α = 0 and β = 180 representing perpendicular elution case were inlet and outlet ports are located on a straight line and α = 45, β = 60 represent tangential elutions where inlet and outlet ports were located in an angle facing the center of the reactor two distinct behaviors of the flow can be distinguished. The instantaneous elution scalar fields for α = 0 and β = 180 case in Fig. 8 correspond to the different stages of completion. The effects of the recirculating vortices are apparent as stirring imposed by the vortices better helps with the completion of the elution. These results are consistent with the data obtained from the perpendicular elution experiments discussed earlier. The vortices (“lobes”) appear at higher flow rates and increase in size as the flow rate increases. Close correlation can be observed between patterns in Fig. 8, those resulting from fluorescence experiments in Fig. 5 and velocity profiles of Fig. 7.
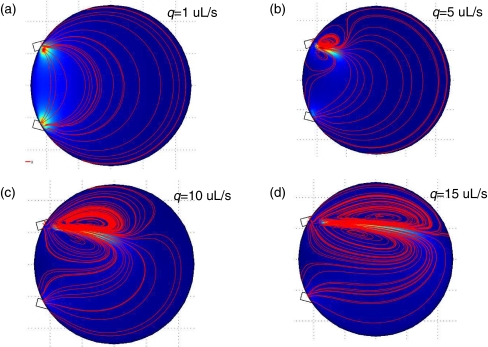
Similarly, the results of the tangential elution simulation, presented in Fig. 9, indicate the onset of elution inside the reactor due to existence of the recirculating regions. It is seen that at low inlet flow rate of 1 μl/s corresponding to Reynolds number of Re = 4, there is very little inertia to induce mixing in the reactor. Note that empirical results of Fig. 6(b) show the same behavior in the actual flow which further validates computational results. As the flow rate is increased to 5 μl/s, the Reynolds number is increased to 20 and inertial effects become more pronounced. At the highest flow rate of 15 μl/s corresponding to Re = 60, the jet of the incoming eluent cuts all the way across the reactor and two counter rotating vortices dominate the flow field. These results once more confirm the explanations of the empirical data obtained with fluorescent tangential elutions presented in Fig. 4(b). Both the jet along the far wall at high flow rates and the shortcut at the low flow rates have been explained in Fig. 9 and confirmed in Fig. 11.
Fig. 9.
Flow patterns for the baseline case where α = 45, β = 60 with varying inlet flow rates. The blue color represents low fluid velocity magnitude, while the orange color represents high fluid velocity magnitude. Streamlines of the fluid are indicated in red. (a) q = 1 uL/s, (b) q = 5 uL/s, (c) q = 10 uL/s, (d) q = 15 uL/s
Fig. 11.
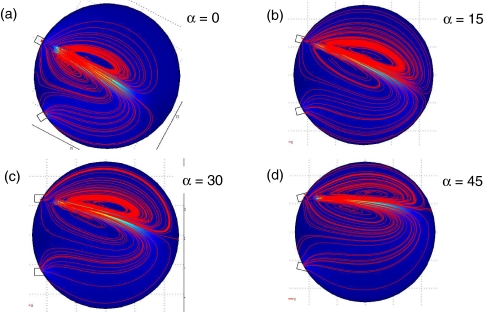
Flow patterns with an inlet flow rate of q = 15 uL/s for various angles α. Inertial effects cause the fluid to jet out of the inlet into the cell reactor creating counter rotating vortices. The blue color represents low fluid velocity magnitude, while the orange color represents high fluid velocity magnitude. Streamlines of the fluid are indicated in red. (a) α = 0, (b) α = 15, (c) α = 30, (d) α = 45
Distribution of the scalar elution concentration inside the reactor in Fig. 10 shows the effect of the jet extending out from the inlet and impinging on the back wall of the reactor chamber and redirecting the jet towards the exit port. This creates a large-scale circulation in the reactor, which helps elute the fluid. At flow rates equal or higher than 5 μl/s, inertial effects cause the fluid to jet from the inlet into the reaction chamber. This is especially significant comparing the straight and tangential elution at the highest flow rate of 15 μl/s, where inlet Reynolds numbers approach Re = 60. For perpendicular elution, the jet at the inlet port creates two counter-rotating vortices that produce substantial re-circulation in the chamber and away from the exit port, and can reduce elution efficiency (see Fig. 8(f)). On the other hand, with tangential elution the jet and the bigger vortex are directed towards the exit port resulting in more efficient elution (see Fig. 10(f)).
Fig. 10.
Scalar fields during elution for the baseline case where α = 45, β = 60 with an inlet flow rate q = 15 uL/s. The blue color indicates no elution fluid, while the red color indicates elution fluid. The percent of elution shown are: (a) 30%, (b) 40%, (c) 50%, (d) 60%, (e) 70%, (f) 80%
The effects of the angles α and β were studied further for the high flow rate case of q = 15 μl/s, by first systematically varying α, with β = 60. The resulting velocity magnitude and streamlines are shown in Fig. 11, for α = 0, 15, 30, 45. The angle of the outlet does not appear to have any significant effect on the flow pattern. However, the angle of the inlet significantly affects the location of the jet emanating from the inlet. The α = 45 case (Fig. 11(d)), directs the jet (and recirculating vortices) to the upper portion of the reaction chamber. This creates large-scale clockwise circulation, which helps elute the fluid from the chamber. As a result, the elution time is lower for α = 45, as compared to the other angles studied.
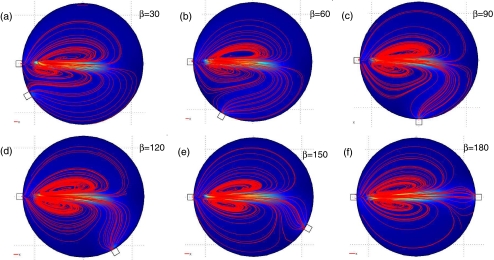
The effect of the angle β on the elution times was examined by fixing α = 0, and varying β = 30, 60, 90, 120, 150, and 180. The resulting velocity magnitude and streamlines are shown in Fig. 12. When then angle β is small, there is a weak large-scale circulation that helps to elute fluid from the reactor. When β = 180 (corresponding to straight through elution), there is no large-scale clockwise or counterclockwise circulation, and the elution efficiency is reduced. Typically, the smaller β allows for more efficient elution than the larger β. It was found that the most efficient elution occurs for large angles of α and small angles of β. An optimal configuration for short elution times and low elution volumes determined based on the above simulations is with tangential elution at α = 45, β = 60, and flow rate of q = 15 μl/s. These parameters are consistent with the existing design of the microfluidic radio-synthesizer of PET probes, suggesting that intuitive design of geometry has already resulted in optimal elution efficiency and consequently higher yields.
Fig. 12.
Flow patterns with an inlet flow rate of q = 15 uL/s for various angles β. Inertial effects cause the fluid to jet out of the inlet into the cell reactor creating counter rotating vortices. The blue color represents low fluid velocity magnitude, while the orange color represents high fluid velocity magnitude. Streamlines of the fluid are indicated in red. (a) β = 30, (b) β = 60, (c) β = 90, (d) β = 120, (e) β = 150, (f) β = 180
Conclusion
As length scales in microfluidics devices become smaller resulting in limited Reynolds numbers and less efficient elution and mixing compared to macro-scale fluidics, utilizing flow and geometry to enhance active mixing and more efficient elution becomes of paramount importance. Through experimental and numerical studies, we have shown the optimal design criteria from the standpoint of mixing and efficient elution of the product for the coin-shaped microfluidic radio-synthesis reaction chamber for PET radiosynthesis. The numerical model used in this work was a simplified model of a more complex system which can be studied using more advanced methods of Computational Fluid Dynamics. The close agreement between numerical and experimental results suggests that computational modeling can serve as a powerful tool for optimizing both chip design and operating parameters, exploring new chip designs without fabricating new chips, and even gleaning insights without complicated measurement equipment. Additionally, the decaying nature of radio-isotopes and radiation safety limitations better justify acquiring a platform such as the one discussed in this work to optimize on-chip radiochemistry processes reducing user exposure.
Acknowledgements
This work was funded by Siemens Molecular Imaging, Biomarker Research, Culver City, CA and by the Institute for Collaborative Biotechnologies through contract no. W911NF-09-D-0001 from the U.S. Army Research Office. The content of the information herein does not necessarily reflect the position or policy of the Government and no official endorsement should be inferred.
Open Access
This article is distributed under the terms of the Creative Commons Attribution Noncommercial License which permits any noncommercial use, distribution, and reproduction in any medium, provided the original author(s) and source are credited.
References
- Ansari MA, Kim K. A numerical study of mixing in a micro-channel with circular mixing chambers. Fluid Mechanics and Transport Phenomena. AIChE Journal. 2009;55(9):2217–2225. doi: 10.1002/aic.11833. [DOI] [Google Scholar]
- Chan EM, Mathies RM, Alivisatos AP. Size-controlled growth of CdSe nanocrystals in microfluidic reactors. Nano Lett. 2003;2:199–201. doi: 10.1021/nl0259481. [DOI] [Google Scholar]
- Chung Y-C, et al. Lab Chip. 2004;4:70–77. doi: 10.1039/b310848c. [DOI] [PubMed] [Google Scholar]
- Czernin J, Phelps M. Positron emission tomography scanning: current and future applications. Annu. Rev. Med. 2002;53:89–112. doi: 10.1146/annurev.med.53.082901.104028. [DOI] [PubMed] [Google Scholar]
- de Vries EFJ, et al. Evaluation of [11C]rofecoxib as PET tracer for cyclooxygenase 2 overexpression in rat models of inflammation. Nucl. Med. Biol. 2008;35(1):35–42. doi: 10.1016/j.nucmedbio.2007.07.015. [DOI] [PubMed] [Google Scholar]
- Dresel S. PET in Oncology. Berlin: Springer GmbH; 2008. [Google Scholar]
- Duffy DC, et al. Rapid prototyping of microfluidic systems in poly(dimethylsiloxane) Anal. Chem. 1998;70:4974–4984. doi: 10.1021/ac980656z. [DOI] [PubMed] [Google Scholar]
- Eckelman WC, Reba RC, Kelloff GJ. Targeted imaging: an important biomarker for understanding disease progression in the era of personalized medicine. Drug Discov. Today. 2008;13:748–759. doi: 10.1016/j.drudis.2008.05.009. [DOI] [PubMed] [Google Scholar]
- Elizarov AM. Microreactors for radiopharmaceutical synthesis. Lab Chip. 2009;9:1326–1333. doi: 10.1039/b820299k. [DOI] [PubMed] [Google Scholar]
- Elizarov A, et al. Design and optimization of a coin-shaped micro-reactor for PET radiopharmaceutical synthesis. J. Nucl. Med. 2010;51:282. doi: 10.2967/jnumed.109.065946. [DOI] [PMC free article] [PubMed] [Google Scholar]
- Erickson D. Towards numerical prototyping of labs-on-chip: modeling for integrated microfluidic devices. Microfluid. Nanofluid. 2005;1(4):301–318. doi: 10.1007/s10404-005-0041-z. [DOI] [Google Scholar]
- Gillies JM, et al. Microfluidic reactor for the radiosynthesis of PET radiotracers. Appl. Radiat. Isot. 2006;64:325–332. doi: 10.1016/j.apradiso.2005.08.007. [DOI] [PubMed] [Google Scholar]
- Haeberle S, et al. Centrifugal micro-mixer. Chem. Eng. Technol. 2005;28(5):613–616. doi: 10.1002/ceat.200407138. [DOI] [Google Scholar]
- Hashimoto M, et al. Polymerase chain reaction/ligase detection reaction/hybridization assays using flow-through microfluidic devices for the detection of low-abundant DNA point mutations. Biosens. Bioelectron. 2006;21:1915–1923. doi: 10.1016/j.bios.2006.01.014. [DOI] [PubMed] [Google Scholar]
- Hatakeyama T, Chen DL, Ismagilov RF. Microgram-scale testing of reaction conditions in solution using nano-liter plugs in micro-fluidics with detection by MALDI-MS. J. Am. Chem. Soc. 2006;128:2518–2519. doi: 10.1021/ja057720w. [DOI] [PMC free article] [PubMed] [Google Scholar]
- Huebner A, et al. Microdroplets: a sea of applications? Lab Chip. 2008;8:1244–1254. doi: 10.1039/b806405a. [DOI] [PubMed] [Google Scholar]
- Kawaguchi T, et al. Room-temperature Swern oxidations by using a microscale flow system. Angew. Chem. Int. Ed. 2005;44:2413–2416. doi: 10.1002/anie.200462466. [DOI] [PubMed] [Google Scholar]
- Knuuti J, Bengel FM. Positron emission tomography and molecular imaging. Heart. 2008;94:360–367. doi: 10.1136/hrt.2007.118992. [DOI] [PubMed] [Google Scholar]
- Laverman P, et al. Development of infection and inflammation targeting compounds. Curr. Radiopharm. 2008;1:42–48. doi: 10.2174/1874471010801010042. [DOI] [Google Scholar]
- Lee C, et al. Multistep synthesis of a radiolabeled imaging probe using integrated microfluidics. Science. 2005;310:1793–1796. doi: 10.1126/science.1118919. [DOI] [PubMed] [Google Scholar]
- Lin C, et al. Rapid circular microfluidic mixer utilizing unbalanced driving force. Biomed. Microdevices. 2007;9(1):43–50. doi: 10.1007/s10544-006-9009-3. [DOI] [PubMed] [Google Scholar]
- Liu J, Hansen C, Quake SR. Solving the “world-to-chip” interface problem with a microfluidic matrix. Anal. Chem. 2003;75:4718–4723. doi: 10.1021/ac0346407. [DOI] [PubMed] [Google Scholar]
- Lu SY, Pike VW. Micro-reactors for PET tracer labeling. In: Schubiger PA, Lehman L, Friebe M, editors. PET Chemistry, The Driving Force in Molecular Imaging. Berlin: Springer; 2007. pp. 271–287. [Google Scholar]
- Mautner T. Biosens. Bioelectron. 2004;19:1409–1419. doi: 10.1016/j.bios.2003.12.023. [DOI] [PubMed] [Google Scholar]
- Miller PW. Radiolabeling with short-lived PET (positron emission tomography) isotopes using microfluidic reactors. J. Chem. Technol. Biotechnol. 2009;84:309–315. doi: 10.1002/jctb.2061. [DOI] [Google Scholar]
- Mishina M. Positron emission tomography for brain research. J. Nippon Med. Sch. 2008;75:68–76. doi: 10.1272/jnms.75.68. [DOI] [PubMed] [Google Scholar]
- Nutt R. 1999 ICP Distinguished Scientist Award, The history of positron emission tomography. Mol. Imag. Biol. 2002;4(1):11–26. doi: 10.1016/S1095-0397(00)00051-0. [DOI] [PubMed] [Google Scholar]
- Phelps M. Inaugural article, Positron emission tomography provides molecular imaging of biological processes. Proc. Natl. Acad. Sci. USA. 2000;97(16):9226–9233. doi: 10.1073/pnas.97.16.9226. [DOI] [PMC free article] [PubMed] [Google Scholar]
- Pither R. PET and the role of in vivo molecular imaging in personalized medicine. Expert Rev. Mol. Diagn. 2003;3:703–713. doi: 10.1586/14737159.3.6.703. [DOI] [PubMed] [Google Scholar]
- Roberge DM, et al. Microreactor technology: a revolution for the fine chemical and pharmaceutical industries? Chem. Eng. Technol. 2005;28:318–323. doi: 10.1002/ceat.200407128. [DOI] [Google Scholar]
- Shoghi-Jadid K, et al. Localization of neurofibrillary tangles and beta-amyloid plaques in the brains of living patients with Alzheimer disease. Am. J. Geriatr. Psychiatry. 2002;10:24–35. [PubMed] [Google Scholar]
- Shu CYJ, et al. Visualization of a primary anti-tumor immune response by positron emission tomography. Proc. Natl. Acad. Sci. U. S. A. 2005;102:17412–17417. doi: 10.1073/pnas.0508698102. [DOI] [PMC free article] [PubMed] [Google Scholar]
- Steel CJ, et al. Automated PET radiosyntheses using microfluidic devices. J. Labelled Comp. Rad. 2007;50:308–311. doi: 10.1002/jlcr.1259. [DOI] [Google Scholar]
- Vallabhajosula S. [18]F-labeled positron emission tomographic radiopharmaceuticals in oncology: an overview of radiochemistry and mechanisms of tumor localization. Semin. Nucl. Med. 2007;37:400–419. doi: 10.1053/j.semnuclmed.2007.08.004. [DOI] [PubMed] [Google Scholar]
- van Dam RM, et al. Automated microfluidic-chip-based stand-alone instrument for the synthesis of radiopharmaceuticals on human-dose scales. Proc NanoTech. 2007;3:300–303. [Google Scholar]
- Varagnolo L, et al. 18F-labeled radiopharmaceuticals for PET in oncology, excluding FDG. Nucl. Med. Biol. 2000;27:103–112. doi: 10.1016/S0969-8051(99)00109-2. [DOI] [PubMed] [Google Scholar]
- Wang J. Positron emission tomography: applications in drug discovery and drug development. Curr. Top. Med. Chem. 2005;5:1053–1075. doi: 10.2174/156802605774297056. [DOI] [PubMed] [Google Scholar]
- Watts P, Haswell SJ. Microfluidic combinatorial chemistry. Curr. Opin. Chem. Biol. 2003;7:380–387. doi: 10.1016/S1367-5931(03)00050-4. [DOI] [PubMed] [Google Scholar]
- Weber WA. Use of PET for monitoring cancer therapy and for predicting outcome. J. Nucl. Med. 2005;46:983–995. [PubMed] [Google Scholar]
- Wester H-J, et al. Fast and repetitive in-capillary production of [18F]FDG. Eur. J. Nucl. Med. Mol. Imaging. 2009;36:653–658. doi: 10.1007/s00259-008-0985-9. [DOI] [PubMed] [Google Scholar]
- Yang S, Lin J, Lee G. A vortex-type micro-mixer utilizing pneumatically driven membranes. J. Micromech. Microeng. 2009;19:035020. doi: 10.1088/0960-1317/19/3/035020. [DOI] [Google Scholar]
- Yu M, et al. Rapid microfluidic production of PET biomarker [18F]FDG. J Nucl Med, Meeting Abstracts. 2006;47:159–160. [Google Scholar]


