

Abstract
Recently, High-content screening (HCS) has been combined with RNA interference (RNAi) to become an essential image-based high-throughput method for studying genes and biological networks through RNAi-induced cellular phenotype analyses. However, a genome-wide RNAi-HCS screen typically generates tens of thousands of images, most of which remain uncategorized due to the inadequacies of existing HCS image analysis tools. Until now, it still requires highly trained scientists to browse a prohibitively large RNAi-HCS image database and produce only a handful of qualitative results regarding cellular morphological phenotypes. For this reason we have developed intelligent interfaces to facilitate the application of the HCS technology in biomedical research. Our new interfaces empower biologists with computational power not only to effectively and efficiently explore large-scale RNAi-HCS image databases, but also to apply their knowledge and experience to interactive mining of cellular phenotypes using Content-Based Image Retrieval (CBIR) with Relevance Feedback (RF) techniques.
1. Introduction
High-content screening (HCS) is a powerful high-throughput technology for generating cellular images that are rich in phenotypic information and has been widely used in functional proteomics [1] and drug profiling [2]. In HCS, multiple images are collected per microplate well and processed by image analysis algorithms to extract multiparametric cellular measurements on cell growth rate, sizes of cells, localizations of organelles, etc. Nonetheless, rich phenotypic information about complex cellular structure and morphology (e.g., the dynamics and organization of filamentous actin and microtubules, the connection topology between neurons, etc.) are usually left unexplored. These cellular phenotypes are the result of the global activities of the underlying biological networks. To better understand the function of these networks and their components, additional information is required to relate them to observed phenotypes.
RNA interference (RNAi) is a revolutionary method for silencing gene expression and provides causal links between genes and functions through RNAi-induced loss-of-function phenotypes. For example, RNAi-based full-genome morphological profiling has offered deep insights into genes functioning in the first two rounds of cell division in the C. elegans embryo [3]. RNAi high-throughput screening (RNAi-HTS) is increasingly used to identify and understand the molecular components and pathways responsible for key cellular processes [4–7]. These screens are highly successful as they identify not only most of the known components but also a great number of genes previously unknown to be involved in a given molecular pathway or cellular process. It is widely expected that genome-wide RNAi-HCS will be increasingly used to profile the cellular phenotypic characteristics of genes, which can be combined with other types of biological data (e.g., transcriptional profiling data and protein-protein interaction data) to elucidate both gene functions and structures of biological networks.
Figure 1 illustrated the procedure of a genome-wide RNAi-HCS study that generated the data for this work. The screen was carried out in 384-well plates (Figure 1C). RNAi was achieved by using double strand RNAs (dsRNAs) that specifically target the mRNA products of genes. The GFP-labeled Drosophila primary neuron cells in each well were treated with one dsRNA targeting at a particular gene (i.e., knockdown a gene by a dsRNA). The experiment used about 21,300 dsRNAs that target at all genes in the Drosophila genome. The morphologies of the GFP-labeled cells in each well were imaged on a robotic microscope. Six images were taken for each well. In addition, each experiment has multiple replicates. Hence, each RNAi treatment is associated with a set of images taken from multiple replicates. Each plate has several control wells, where cells were either untreated or subject to the baseline treatments. Images from the control wells are defined as wildtype images (Figure 1A). Some RNAi-treated cells may demonstrate phenotypes. For example, actin dsRNA treated cell cultures show smaller cell clusters with weaker connectivity (Figure 1B). This kind of experiment is very useful to identify genes involving in neuron development or maintenance. Since it is also a new kind of biological experiment, most of the observed phenotypes are novel phenotypes (i.e. uncategorized phenotypes). It is extremely time-consuming to formally define the phenotypes because the number of images is huge and the potential number of phenotypes is large and unknown. There is no existing tool capable of automatically and thoroughly analyzing these kinds of images.
Figure 1. Design of genome-wide RNAi-HCS screen in GFP-labeled Drosophila primary neural cells.
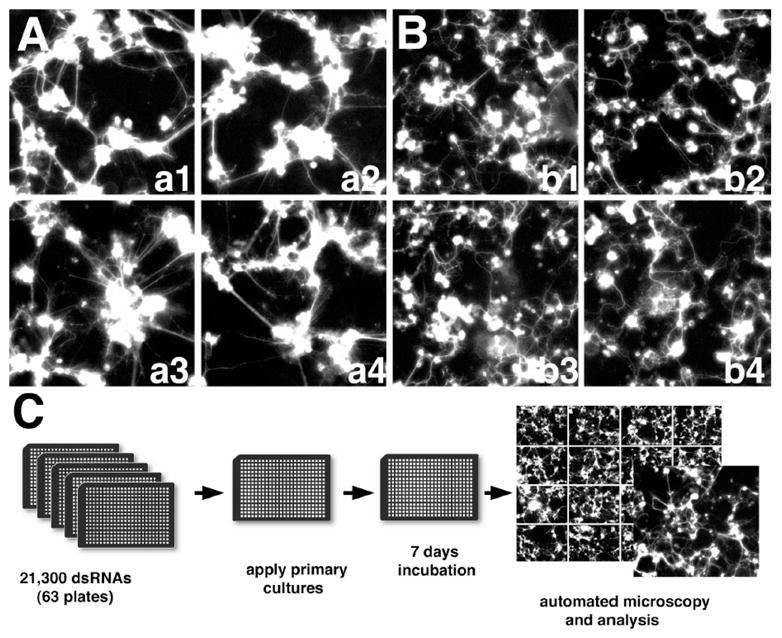
Images were acquired on robotic widefield fluorescence microscope from live cell cultures in 384-well plates. (A) Wildtype images. (B) Phenotype images of RNAi-treated cells. (C) Scheme of the genome-wide RNAi screen.
As shown in the above example, a typical genome-wide RNAi-HCS screen can easily generate about 100k high-resolution cellular images. However, little is known about the biological factors underlying the observed cellular phenotypes. Existing image analysis tools, such as AcuityXpress™ and MetaXpress™ from (www.moleculardevices.com), AttoVision™ from BD Biosciences (www.atto.com), BioApplications™ from Cellomics (www.cellomics.com), CellMine™ from BioImagene (www.bioimagene.com), CytoShop from Beckman Coulter, the iCyte® and iCys® Cytometric analysis software (www.compucyte.com), IN Cell Analyzer 1000 (www.amershambiosciences.com), QED Image (www.mediacy.com), NIH Image (rsb.info.nih.gov/nih-image), and UTHSCSA ImageTool (ddsdx.uthscsa.edu/dig/itdesc.html), perform reasonably well in low-level image analysis, for example, extracting fluorescence readouts, segmenting images into “biological objects”, extracting sizes, shapes, intensity, and texture of image segments, and so on. Nonetheless, they have very limited capacity in modeling, detecting, and recognizing complicated morphological phenotypes, which is a bottleneck of morphological studies using the HCS technology.
The Murphy Lab has pioneered in using supervised approaches to train subcellular pattern recognizer using high-content fluorescence microscopy images [8–10]. Nevertheless, classifiers obtained by supervised approaches require annotated images and only recognize phenotypes that they were trained to identify. Hence, a completely supervised approach is impractical when facing a huge collection of unannotated HCS images and a large novel phenotype set, especially, the size of which is unknown.
To bridge the huge gap between the high-level biological concepts (i.e., cellular phenotypes) and the low-level phenotypic profiles, we propose to use Visual data exploration (VDE) to deal with the flood of information. The basic idea of VDE is to present the data in some visual forms that allow users to gain insight into the data and generate hypotheses by directly interacting with the data. The advantage of VDE is that users are directly involved in the data mining process to combine the flexibility, creativity, and general knowledge of the human with the enormous storage capacity and the computational power of computers. This process is especially useful when little is known about the data and the exploration goals are vague, such as in analyzing a huge number of RNAi-HCS images.
However, without effective means to adequately explore large-scale HCS image databases, visual data exploration could be a daunting task. Existing works for visualizing HCS data, for example, Cellomics vHCS™ Discovery ToolBox (www.cellomics.com) and the method developed in [11], focus on visualizing simple quantitative readouts of markers instead of images and especially the relationships among images that convey profound information closely related to effects of chemical compounds, gene functions, and biological processes. Previous work on image database visualization [12, 13] targeted at personal photo albums, which are much smaller than HCS image databases, and did not consider computational needs specific to HCS image analyses. The Open Microscopy Environment (OME) project [14] provides an excellent open-source browser to navigate an HCS image database [15] that is described as a quasi-hierarchical structure representing the relationship between projects and datasets. However, this navigation scheme was not designed to facilitate phenotype discovery and categorization, which is one of our main focuses.
To this end, we have developed an application, imCellPhen - interactive mining of cellular phenotypes (http://combio.cs.brandeis.edu/imcellphen/), which provides intelligent interfaces for visualizing large-scale RNAi-HCS image databases and interactive mining of cellular phenotypes. imCellPhen has been used to facilitate the analysis of images generated in the genome-wide RNAi-based morphological screen of Drosophila primary neural cells (see Figure 1). In section 2, we briefly describe the extraction of low-level image features and the derivation of the metadata representation for RNAi treatments. The details of imCellPhen are explained in section 3. The techniques developed in this study can be applied to study other types of cells images generated by using the RNAi-HCS technology.
2. Metadata
A metadata representation was derived to represent RNAi treatments using their images. The first step is to extract low-level image features from RNAi-HCS images. The number of features and the types of features depend on the images in consideration. For example, based on the domain knowledge contributed by the biological experts, we developed an image processing toolkit to extract low-level features for describing the phenotypic information of the Drosophila primary neurons in the experiments (Figure 1). We first used the Otsu method [16], which chooses a global threshold to minimize the intraclass variance of the background and foreground layers (i.e. cell bodies), to convert a raw intensity image (Figure 2A) into a binary image (Figure 2B). A morphological image-opening with a disk of radius five was applied to the foreground layer to separate cell clusters connected by strong axon bundles which were misclassified into the cell body class. This step was followed by a morphological closing operation using the same mask. The morphologically modified foreground layer (Figure 2C) is divided into three categories: small dots (area ≤ 16 pixels), small cell clusters (16 pixels < area ≤ 400 pixels), and large cell clusters (400 pixels < area). We then applied a Gabor filter-based approach [17] to the raw image with cell clusters excluded and computed the axon strength map (Figure 2D). An example of connection features is highlighted in Figure 2E. The connections among wildtype cell clusters tend to be straight and simple. After discarding weak connections (strength < 0.3), very long connections (length > 300), and complex connections (ratio feature > 1.3), we derived a connectivity map (Figure 2E). The mean and variance of the strength, length, and ratio feature of the connections were computed and denoted as the connectivity features of each image. The complexity of axon branching is also an important phenotypic feature and can be estimated by computing the corner information in the image. A set of binary patterns were defined to search for corners in the binarized axon strength map (Figure 2F).
Figure 2. Image analysis of neuron images.

(A) The original widefield fluorescence image of GFP-labeled primary neurons and glia. (B) Identification of cell bodies. (C) Remove axon bundles (arrows). (D) The axon strength map. (E) The connectivity map. As the yellow connection shows, each connection has three features: the length, the strength, and the ratio of its length to the Euclidean distance between two its two end points. (F) The corner map. A corner map is a binary image, and provides information on the amount of branched features in the cell culture. A corner is represented as 1, otherwise 0.
Similar to other types of high-throughput technology, the HCS technology generates noisy data. As we mention before, multiple images (i.e., inside-plate replicates) are taken from different fields in each microplate well to account for noise and variances. The replicates from the same well may vary greatly. For example, automatic cell culture preparation could cause uneven cell distribution in microplate wells. A microplate well may contain fields with much fewer cells than the average cell density in the well. Images taken from those fields are not representative and should be excluded from the follow-up computations. We currently treat unrepresentative images as outliers and filter them out using principal component analysis, which was shown to be effective in detecting high value range outliers [18]. This method basically computes and ranks samples on their Mahalanobis distance from the centroid. Typically, outliers are those with large Mahalanobis distances.
After filtering out outliers, the raw feature vector of a well is computed by averaging the feature vectors of its representative images. In addition, each plate will have a certain number of control wells, cells in which are either untreated or subject to baseline treatments. Images collected from the control wells are used to normalize the data, which is a common practice to deal with plate-to-plate variations. We observed that the distributions of the raw features in the images of control wells in the same plate are approximately Gaussian. Hence, we can use this property to normalize the raw features of other images captured from the same plate to obtain Z-scores, which has been widely used in high-throughput screen data analysis [19, 20]. The normalized feature vector of a well contains a set of Z-scores.
If a well was treated with a dsRNA, we associated the feature vector of the well with the gene targeted by that dsRNA. If an experiment is carried out with several replicates under the same experimental conditions, the feature vectors of a dsRNA across all replicates will be averaged to obtain the metadata of that dsRNA. The rest of computation will use this metadata.
3. Intelligent Interfaces
The interfaces of imCellPhen include two major parts: (a) a RNAi-oriented Pattern-based VDE interface; and (b) a CBIR-RF interface.
3.1. RNAi-oriented Pattern-based VDE Interface
The VDE process for a large database usually contains three key components: overview, zoom and filter, and details-on-demand, which was called the visual-information-seeking mantra [21, 22]. First, users need to get an overview of the data, which allows them to identify interesting patterns and then focus on one or more of them. During visual pattern analysis, users need to drill-down and access details of the data. The visualization interface should not only provide the basic visualization techniques for all components but also bridge the gaps between them. For example, it is useful to display a visual cue in the overview denoting the subset of the data which the user is focusing on in the zoom and filter view. Since the size of an HCS image database is very large, direct visualization of all its images will not generate sensible results. It is more tangible to first summarize the database into patterns, which are discovered by clustering techniques as potential phenotypes, and visualize patterns as well as the relationship among patterns.
Therefore, we developed a P-VDE (pattern-based VDE) prototype, imCellPhen (see Figure 3), for visualizing HCS image databases. The P-VDE interface has three views: overview, zoom-view and detail-view. The overall structure of the database is visualized in the overview allowing users to quickly navigate through the database by patterns and perceive the global relationships among patterns. Users can zoom in and visualize details of one or a few patterns in the zoom-view, and then select one image in the zoom-view for the close-up examination in the detail-view.
Figure 3. The P-VDE Interface.

(A) The overview displays the dendrogram. The red rectangle is the resizable and movable lens. (B) The Zoom-view displays the 2D layout of the zoom-graph. The black square indicates the ancestor node selected to connect sub-trees in the lens. (C) The Detail-view shows the high resolution version and detailed values of features of the selected image. (D) A close-up view of (A).
imCellPhen uses hierarchical clustering techniques, which have been widely applied to various biological data such as microarray gene expression profiles, to extract the structure of an image database (i.e. summarize an image database into patterns). The dendrogram of a hierarchical clustering result is displayed in the overview (Figure 3A). The overview has a movable and resizable lens (red rectangle in Figure 3A) that allows users to selectively zoom in/out part of the hierarchical structure so that they can quickly navigate through the image database. The local structure selected by the lens is a set of disjoint sub-trees that may or may not include leaves. The problem with directly visualizing these sub-trees in the zoom-view is that it is not clear to users how they are related. To appropriately visualize the sub-trees, we create a zoom-graph that includes all selected sub-trees and the relationships between them, and visualize the zoom-graph in the zoom-view (Figure 3B).
The zoom-graph is created by finding the minimal set of ancestor nodes to connect the sub-trees while still maintaining the relative relationships between sub-trees in the original dendrogram. The root nodes of those sub-trees are collected first. For each pair of root nodes, the closest common ancestor node is found in the dendrogram. This is done simply by iterating through ancestor nodes of root nodes and finding the closest ancestor node shared by them. Every time, the algorithm creates a joint node in the zoom-graph to connect the pair of sub-trees closest to one another among all pair of sub-trees. The distance between two sub-trees is defined as the sum of the distances between the roots of the sub-trees and their closest common ancestor node, which is represented by the joint node. Two edges are then added to connect the new joint node and the roots of the sub-trees. This process is repeated until all sub-trees are connected to form the final zoom-graph. The 2D layout of the zoom-graph is computed using the Barnes-Hut algorithm [23]. The Barnes-Hut algorithm simulates repulsive forces among nodes to spread them apart and spring forces between connected nodes to keep them close to each other.
Each node of the selected sub-trees is visualized as its representative image, which is chosen to be one that is closest to the center of the sub-cluster represented by the node. It is very important to represent clusters by their representative images and visualize the relations among clusters for the following two reasons. First, clustering analysis results may not be perfect if image features are not comprehensively extracted or the assumptions made by clustering analyses do not match the reality very well. Images and the relationship among clusters can help users make correct judgments. Second, as the old proverb says: A picture is worth a thousand words, it is more effective for users to explain themselves to developers via images – the main subjects of the concern. For example, biologists can use images to illustrate which image features are biological important but are neglected by computational biologists. The ancestor nodes used to connect sub-trees are visualized as big dots. The user can interact with image icons in the zoom-view by clicking and dragging them. When an image icon is double-clicked in the zoom-view, its high resolution version and detailed information will be shown in the detail-view (Figure 3C). In addition, all images in the corresponding sub-cluster are listed in the detailed-view for browsing.
3.2. CBIR-RF Interface
Computational models of high quality are of course needed to automatically, reliably, and quantitatively annotate a wide spectrum of images. Such models cannot be built without enough domain knowledge or be trained without sufficient training samples. However, since little or no knowledge about novel phenotypes is available, the accumulation of domain knowledge and training data usually requires human experts to manually annotate images, which is impractical for large-scale HCS image databases. P-VDE interfaces can help human experts selectively explore and annotate a subset of closely related images. Nonetheless, P-VDE relies on unsupervised approaches to discover patterns and reveal the relationships among patterns. The assumptions made by unsupervised approaches may not match the reality very well, and hence will result in low quality results. Constructing appropriate assumptions requires domain knowledge specific to each phenotype, which is yet to be accumulated. As advocated by Shneiderman and Plaisant, predefined objective criteria can be applied to a task, but it is necessary to consider human values when making decisions [22]. We believe that a practical solution to the above dilemma is to develop intelligent interfaces which are capable of learning from human experts. Basically, human experts start using the intelligent interfaces with little or no domain knowledge. While browsing the database using the interfaces, human experts will provide feedback for the interfaces to perform self-improvement. Such an interactive data exploration process not only satisfies the information needs of users but also allow domain knowledge to be implicitly accumulated as phenotype recognizers by the intelligent interfaces.
We are currently working in this direction by applying content-based image retrieval (CBIR) with Relevance Feedback (RF) techniques to RNAi-HCS image analyses. CBIR, a technique that uses images as queries to search for similar ones in an image database, has been an active research field in the last decade as a result of advances in the Internet and high-throughput digital image sensor technologies [24–26]. Since it is impossible to automatically generate satisfactory descriptive texts for images in many applications, it has been widely recognized that a more efficient and intuitive way to represent and index images would be based on properties that are inherent in the images themselves. CBIR describes an image by a feature vector representing its visual cues such as color, layout, shape, and texture. To retrieve images, users provide a CBIR system with example images or sketched figures. The system computes the feature vector representation of these examples and search for similar images in the database. This kind of indexing method provides an efficient and effective way to search for large-scale image databases. Several CBIR methods have recently been developed for biomedical image databases [27–29]. Conventional CBIR techniques compute the similarities between a query and the images in the database using predefined computational models, the construction of which requires domain knowledge. It can be a daunting task to design and fine-tune such a computational model. Hence, modern CBIR systems use users’ relevance feedback (RF) to improve the computational models so that the retrieval results are perceptually and semantically more meaningful. RF was originally used in traditional text-based Information retrieval systems [30, 31]. It is the process of automatically improving an existing query to approximate users’ information needs using the qualitative information fed back by users about the relevance of previously retrieved information. This technique is especially useful if users do not have a well-developed idea of what information they exactly want or they are not able to express their information needs into a suitable query. The above properties make CBIR with RF (CBIR-RF) a promising technique for analyzing HCS images. The CBIR-RF research was also identified as one of the future directions in biomedical image analysis [29].
We recently implemented a naïve-Bayes-Classifier-based CBIR-RF for interactive analysis of RNAi-HCS images. A naive Bayes classifier (NBC) is a simple probabilistic classifier based on applying Bayes’ theorem with strong (naive) independence assumptions about features [32]. When an image node is right-clicked in the zoom-view, a context menu will pop up (see Figure 4). By clicking the “Image Retrieval” menu item, the system will automatically switch to the CBIR-RF interfaces and lists all the leaf-nodes below that selected node as unlabeled images (see Figure 5A). Biologists may judge these images basing on their knowledge and experience, and move the images into the positive class (Figure 5B) or the negative class (Figure 5C). The positive and negative samples will be used to train our NBC after the “Retrieve” button is pressed. The system will then used the trained NBC to scan the rest images in the HCS database and return top 10% hits in each retrieval operation. The retrieved images are listed in the unlabeled image panel (Figure 5A) in the order of their similarities to the query. Biologist may repeat this select-and-retrieve process until the satisfactory result is obtained. The above iterative process allows biologists to construct a phenotype recognizer without the need of programming. If the detailed information of a certain image is needed, users may double-click an image in any of the panels. Then a higher resolution image and its features will be shown in the detail-view (Figure 5D).
Figure 4.
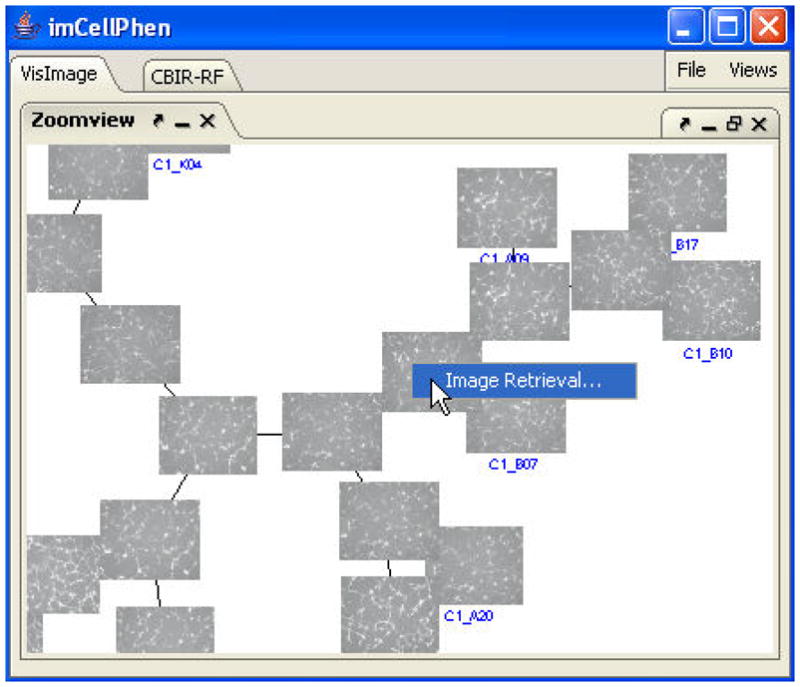
Pop-up menu of Image Retrieval.
Figure 5. The CBIR-RF Interface.
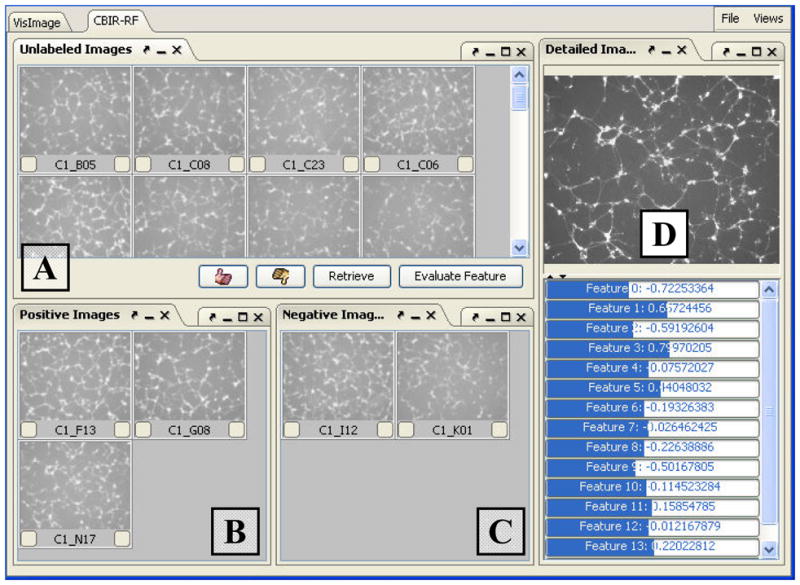
(A) This panel lists all unlabeled images and the retrieved images. (B) The positive image list. (C) The negative image list. (D) The detail-view for a selected image.
We are currently facing a challenging situation in which the HCS technology is being used to generate cellular images at explosively higher rates than they can be meticulously processed. The CBIR-RF technology can offer a timely solution. Our NBC-based CBIR-RF technique allows researchers to search for images even when they are not able to express their interests into suitable queries. This is especially useful when researchers can only start with a small incomprehensive set of images to build a recognizer for a novel phenotype. At the same time, we also realized that the overwhelming numbers of images and novel phenotypes will dramatically undercut the effectuality of a stand-alone CBIR-RF application and even make it as a repulsive tool. Therefore, only if it is integrated with unsupervised pattern mining techniques and P-VDE interfaces as provided by imCellPhen, can CBIR-RF techniques be effective in using RNAi-HCS to carry out large-scale studies of complicated cellular morphologies.
4. Conclusions
Although the RNAi-HCS technology has greatly facilitated the biomedical discovery, it also imposed serious challenges by generating huge volumes of images that are enriched in gene function information and beyond the capability of existing image processing tools. To help biologists deal with these challenges, we have developed imCellPhen to facilitate the application of RNAi-HCS technology to biomedical research.
imCellPhen first uses unsupervised clustering analysis techniques to summarize a large-scale RNAi-HCS image database into patterns. The image database is then visualized as a graph of patterns in the P-VDE interfaces, which allows users to effectively and adequately explore the image database and gain insights into the data. The visualization of images especially the relationships among images greatly helps users interact with the data and data clusters intuitively. The patterns discovered by unsupervised techniques may not be able to define phenotypes well enough and should be subject to visual examination and refinement. imCellPhen provides users with CBIR-RF techniques to interactively construct and refine phenotype recognizers. Our integration of the CBIR-RF techniques with the P-VDE interfaces will make it feasible for biologists to study complicate phenotypes on an unprecedented massive scale. In the future, we will explore the application of other classifiers in the context of large-scale RNAi-HCS image analysis.
This tool will greatly facilitate the collaboration and communication between experimental and computational biologists in investigating complex cellular morphologies using RNAi-HCS technology. It allows experimental biologists to convey domain knowledge, which is difficult to describe in words or mathematically, however, can be easily conveyed through image examples, to computational biologists. This kind of interaction will eventually lead to the development of tools capable of comprehensively and automatically processing RNAi-HCS images.
Acknowledgments
This work is supported by NIH 1R01EB007042-01A1.
Contributor Information
Chen Lin, Email: clin@brandeis.edu.
Pengyu Hong, Email: hongpeng@brandeis.edu.
References
- 1.Liebel U, et al. A microscope-based screening platform for large-scale functional protein analysis in intact cells. FEBS Lett. 2003;554(3):394–8. doi: 10.1016/s0014-5793(03)01197-9. [DOI] [PubMed] [Google Scholar]
- 2.Perlman ZE, et al. Multidimensional drug profiling by automated microscopy. Science. 2004;306(5699):1194–8. doi: 10.1126/science.1100709. [DOI] [PubMed] [Google Scholar]
- 3.Sonnichsen B, et al. Full-genome RNAi profiling of early embryogenesis in Caenorhabditis elegans. Nature. 2005;434(7032):462–9. doi: 10.1038/nature03353. [DOI] [PubMed] [Google Scholar]
- 4.Pelkmans L, et al. Genome-wide analysis of human kinases in clathrin- and caveolae/raft-mediated endocytosis. Nature. 2005;436(7047):78–86. doi: 10.1038/nature03571. [DOI] [PubMed] [Google Scholar]
- 5.Muller P, et al. Identification of JAK/STAT signalling components by genome-wide RNA interference. Nature. 2005;436(7052):871–5. doi: 10.1038/nature03869. [DOI] [PubMed] [Google Scholar]
- 6.Eggert US, et al. Parallel chemical genetic and genome-wide RNAi screens identify cytokinesis inhibitors and targets. PLoS Biol. 2004;2(12):e379. doi: 10.1371/journal.pbio.0020379. [DOI] [PMC free article] [PubMed] [Google Scholar]
- 7.Wheeler DB, Carpenter AE, Sabatini DM. Cell microarrays and RNA interference chip away at gene function. Nat Genet. 2005;37(Suppl):S25–30. doi: 10.1038/ng1560. [DOI] [PubMed] [Google Scholar]
- 8.Boland MV, Markey MK, Murphy RF. Automated recognition of patterns characteristic of subcellular structures in fluorescence microscopy images. Cytometry. 1998;33(3):366–75. [PubMed] [Google Scholar]
- 9.Boland MV, Murphy RF. A neural network classifier capable of recognizing the patterns of all major subcellular structures in fluorescence microscope images of HeLa cells. Bioinformatics. 2001;17(12):1213–23. doi: 10.1093/bioinformatics/17.12.1213. [DOI] [PubMed] [Google Scholar]
- 10.Murphy RF, Boland MV, Velliste M. Towards a systematics for protein subcelluar location: quantitative description of protein localization patterns and automated analysis of fluorescence microscope images. Proc Int Conf Intell Syst Mol Biol. 2000;8:251–9. [PubMed] [Google Scholar]
- 11.Smellie A, Wilson CJ, Ng SC. Visualization and interpretation of high content screening data. J Chem Inf Model. 2006;46(1):201–7. doi: 10.1021/ci050404g. [DOI] [PubMed] [Google Scholar]
- 12.Kang H, Shneiderman B. Visualization Methods for Personal Photo Collections: Browsing and Searching in the PhotoFinder. IEEE International Conference on Multimedia and Expo; 2000; New York City, NY, USA. [Google Scholar]
- 13.Moghaddam B, et al. Visualization and User-Modeling for Browsing Personal Photo Libraries. International Journal of Computer Vision. 2004;56(1–2):109–130. [Google Scholar]
- 14.Goldberg IG, et al. The Open Microscopy Environment (OME) Data Model and XML file: open tools for informatics and quantitative analysis in biological imaging. Genome Biol. 2005;6(5):R47. doi: 10.1186/gb-2005-6-5-r47. [DOI] [PMC free article] [PubMed] [Google Scholar]
- 15.Hochheiser H, Goldberg IG. Quasi-hierarchical, interactive navigation of images and meta-data in the Open Microscopy Environment. IEEE International Symposium on Biomedical Imaging; 2006; Arlington, Virginia, U.S.A. [Google Scholar]
- 16.Otsu N. A Threshold Selection Method from Gray-Level Histograms. IEEE Transactions on Systems, Man, and Cybernetics. 1979;9(1):62–66. [Google Scholar]
- 17.Wang Z, Jenkin M, Archibald C, Petriu E, editors. Advances in Machine Vision: Strategies and Applications. World Scientific Press; Singapore: 1992. Using complex Gabor filters to detect and localize edges and bars; pp. 151–170. [Google Scholar]
- 18.Lalor GC, Zhang C. Multivariate outlier detection and remediation in geochemical databases. Sci Total Environ. 2001;281(1–3):99–109. doi: 10.1016/s0048-9697(01)00839-7. [DOI] [PubMed] [Google Scholar]
- 19.Mitchison TJ. Small-molecule screening and profiling by using automated microscopy. Chembiochem. 2005;6(1):33–9. doi: 10.1002/cbic.200400272. [DOI] [PubMed] [Google Scholar]
- 20.Malo N, et al. Statistical practice in high-throughput screening data analysis. Nat Biotechnol. 2006;24(2):167–75. doi: 10.1038/nbt1186. [DOI] [PubMed] [Google Scholar]
- 21.Shneiderman B. Proc IEEE Symp Visual Languages. IEEE CS Press; 1996. The eye have it: A task by data type taxonomy for information visualizations. [Google Scholar]
- 22.Shneiderman B, Plaisant C. Designing the User Interface: Strategies for Effective Human-Computer Interaction. 4. Addison Wesley; 2004. [Google Scholar]
- 23.Barnes J, Hut P. A Hierarchical O(N log N) Force-calculation Algorithm. Nature. 1986;324(4):446–449. [Google Scholar]
- 24.Furht B, Smoliar SW, Zhang HJ. Video and Image Processing in Multimedia Systems. Kluwer Academic Publishers; 1995. [Google Scholar]
- 25.Rui Y, Huang TS, Chang SF. Image retrieval: current techniques, promising directions and open issues. Journal of Visual Communication and Image Representation. 1999;10:39–62. [Google Scholar]
- 26.Smeulders AMW, et al. Content-based image retrieval at the end of the early years. IEEE Transactions on Pattern Analysis and Machine Intelligence. 2000;22(12):1349–1380. [Google Scholar]
- 27.Shyu CR, et al. ASSERT: A Physician-in-the-Loop Content-Based Retrieval System for HRCT Image Databases. Computer Vision and Image Understanding. 1999;75(1–2):111–132. [Google Scholar]
- 28.Antani S, et al. Partial Shape Matching for CBIR of Spine Xray Images. SPIE Electronic Imaging, Storage and Retrieval Methods and Applications for Multimedia. 2004:5307–01. [Google Scholar]
- 29.Muller H, et al. A review of content-based image retrieval systems in medical applications-clinical benefits and future directions. Int J Med Inform. 2004;73(1):1–23. doi: 10.1016/j.ijmedinf.2003.11.024. [DOI] [PubMed] [Google Scholar]
- 30.Rocchio J. Relevance feedback in information retrieval. Englewood Cliffs, New Jersey: Prentice Hall; 1971. [Google Scholar]
- 31.Salton G, McGill MJ. Introduction to Modern Information Retrieval. McGraw-Hill Book Company; 1983. [Google Scholar]
- 32.Duda R, Hart P, Stork D. Pattern Classification. 2. New York, NY: John Wiley and Sons, Inc; 2000. [Google Scholar]