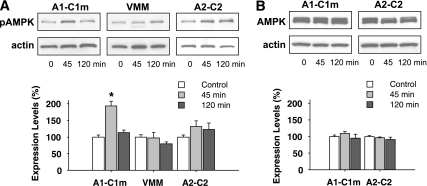
FIG. 2.
Total and phosphorylated forms of AMPKα in three hindbrain regions after 2DG injection. Tissue homogenates were obtained 45 or 120 min after saline (control) or 2DG (200 mg/kg s.c.) injection. Equivalent amounts of protein were subjected to SDS-PAGE and immunoblotted with anti-pAMPKα, anti-total AMPKα, or anti–β-actin antibody. A: Upper panel: immunoblots of pAMPKα and β-actin in A1–C1m, VMM, and A2–C2 regions with saline or 2DG injection. Lower panel: quantitative data. B: Upper panel: immunoblots of total AMPKα and β-actin in A1–C1m and A2–C2 regions. Lower panel: quantitative data. To compare expression levels of these proteins, the intensity of each band was quantified and normalized with β-actin and expressed as the percentage of saline control rats. *P < 0.01 vs. the control saline-injected rats. Fisher PLSD test after one-way ANOVA (n = eight rats for each group).

