

Abstract
A growing consensus suggests that the brain makes simple choices by assigning values to the stimuli under consideration and then comparing these values to make a decision. However, the network involved in computing the values has not yet been fully characterized. Here, we investigated whether the human amygdala plays a role in the computation of stimulus values at the time of decision making. We recorded single neuron activity from the amygdala of awake patients while they made simple purchase decisions over food items. We found 16 amygdala neurons, located primarily in the basolateral nucleus that responded linearly to the values assigned to individual items.
Introduction
A growing consensus suggests that the brain makes simple choices by assigning values to the stimuli under consideration and then comparing them to make a decision (Montague and Berns, 2002; Rangel et al., 2008; Kable and Glimcher, 2009; Rushworth et al., 2009; Rangel and Hare, 2010). A critical question in the literature, to which a considerable amount of effort is being devoted, is to characterize all of the areas that contribute to the computation of the stimulus values at the time of choice. Monkey electrophysiology (Wallis and Miller, 2003; Padoa-Schioppa and Assad, 2006, 2008) and human functional magnetic resonance imaging (fMRI) studies (Paulus and Frank, 2003; Kable and Glimcher, 2007; Plassmann et al., 2007, 2010; Tom et al., 2007; Valentin et al., 2007; Hare et al., 2008, 2009, 2010; Levy et al., 2010) have shown that activity in the orbitofrontal cortex (OFC) is consistent with the encoding of stimulus value at the time of choice. However, since it is extremely unlikely that this is the only area involved in these computations, there is an ongoing research effort to identify other areas that either encode the necessary value signals or contribute to their computation.
An area of significant interest in this regard is the amygdala. This interest is motivated by several facts. First, monkey electrophysiology studies have shown that this area encodes the value of stimuli during pavlovian appetitive and aversive conditioning tasks (Paton et al., 2006; Belova et al., 2007, 2008; Salzman et al., 2007). Second, monkey lesion studies have also shown that normal amygdala activity is necessary to be able to revaluate food stimuli after feeding to satiation (Izquierdo and Murray, 2007) and that it plays a role in updating the value of conditioned stimuli in reversal learning paradigms (Machado and Bachevalier, 2007; Murray and Izquierdo, 2007). Third, the anatomical connectivity of the amygdala in primates, which includes extensive bilateral connectivity with OFC, puts it in a privileged position to influence the computation of values (Stefanacci and Amaral, 2000, 2002; Ghashghaei and Barbas, 2002; Price, 2003; Ghashghaei et al., 2007). Fourth, lesions to the basolateral amygdala (BLA) subnucleus in rodents have been shown to greatly affect consummatory behavior related to pavlovian conditioning, which might be modulated by the underlying value of the stimuli (Holland et al., 2002; Balleine and Killcross, 2006). Work in rodents has also shown that the BLA plays a necessary role in the revaluation of stimuli that result from physiological changes such as feeding to satiation (Balleine et al., 2003). Pharmacological inactivation of the rodent BLA by microinfusion has also been shown to induce impairments in judgments based on the relative value attached to different courses of action (Ghods-Sharifi et al., 2009).
Here, we address this question in humans by recording single neuron activity from the amygdala of awake patients while they make simple purchase decisions over food items. The task provides a participant- and trial-specific behavioral measure of the value assigned to each food item at the time of decision, which we then compare with the responses in single amygdala units.
Materials and Methods
Participants.
Three patient-participants with pharmacologically intractable epilepsy participated in the study (2 female, 1 male; ages 20, 23, and 38 years; ages of seizure onset 18, 15, and 35 years; full-scale IQ within normal range). Patients had depth electrodes implanted bilaterally in the amygdala as a part of a surgical treatment for their condition. Informed consent was obtained from each patient before participation after the nature and possible consequences of the studies were explained to them. The study was approved by the University of Iowa Institutional Review Board. Patients did not incur additional risk by participating in these studies, and the decision to implant the electrodes, as well as their location, was driven solely by medical considerations.
Stimuli.
Patient-participants made purchase decisions on 50 different sweet and salty junk foods (e.g., candy bars and chips). The stimulus set was taken from a previous related fMRI study (Plassmann et al., 2007) and was constructed to consist of foods that are familiar to most participants, and that range from neutral to highly appetitive. The foods were presented to the participants using color pictures depicting both the package and a sample of the food (Fig. 1A) (size 2 × 3 inches; 72 dpi resolution). The stimuli were presented on a standard liquid crystal display monitor in the participants' room in the University of Iowa Hospital and Clinics Clinical Research Center.
Figure 1.

A, Experimental time line. Arrows show the onset of the display, bid request, and revealed choice of bid. B, Bids in session 1 versus session 2. Each point denotes a population of participant-item pairs (with the size of the point increasing on the number of observations there). Red lines summarize the best linear fit between the two variables.
Behavioral task.
Patients participated in two identical sessions, consisting of 50 trials each, which were run back to back. In each trial, they had to make a purchase decision regarding the food stimuli described above. Stimuli were shown in random order and were not repeated within sessions. Participants were endowed with $3 in bidding money and on every trial had to decide to bid for the right to eat the food shown in that trial at the end of the experiment. In each trial, they were allowed to bid between $0 and $3. The timeline of events in shown in Figure 1A. Stimuli were shown for 1 s before participants could enter their bid. The trial ended as soon as the bid was recorded. Trials were separated by a 1 s intertrial interval. Participants entered their bid either through a key press (PT156, possible bids $0, $1, $2, or $3), or a continuous graphic slider manipulated by the mouse wheel (PT173 and PT175). The bids for the first session for PT173 were entered by key press.
At the end of the experiment, one of the trials was selected at random and implemented, which is a common procedure in behavioral economics. Importantly, the food item for the selected trial was sold to the participant using a Becker–DeGroot–Marshack (BDM) auction mechanism (Becker et al., 1964). The rules of a BDM are as follows. Let b denote the participant's bid for the selected trial, and let n be a random number drawn between $0 and $3 from a known distribution (in our case, $0, $1, $2, and $3 were chosen with equal probability). If b ≥ n, the participant gets the item, but he only pays a price equal to n. In contrast, if b < n, the participant does not get the item but also he does not have to pay anything. The participant keeps all unspent funds.
Note several important features of the task. First, the unique optimal strategy in a BDM auction is to bid the true valuation for each food, a fact that was explained to the participants during the experimental instruction period. This is useful because it provides us with a trial-by-trial measure of the subjective value that the brain assigns to each of the stimuli during the decision. Second, since only one of the decision trials was implemented, participants did not need to worry about spreading his $3 across the different food items. Furthermore, since they did not know which trial would count, and every decision had a positive probability of being selected, their best strategy was to treat every trial as if it were the only one. Third, because participants were restricted to bid on the $0–$3 range, and PT156 could only bid in discrete amounts, their bids are only an approximation about their true underlying value for the foods at the time of choice.
Neurophysiological recordings.
As part of their clinical treatment, patients were implanted with multicontact recording grids over the perisylvian cortex, as well as hybrid depth electrodes (HDEs) in Heschl's gyrus and either unilateral or bilateral amygdala. The patient's electrocorticograms were monitored continuously for seizure activity for 2 weeks following implantation. A modified HDE containing 14 high-impedance microwires and 4 low-impedance macrocontact recording sites (Fig. 2A) was also inserted into the nonpathological amygdala (Howard et al., 1996). The electrode used in PT175 had an extra microwire (which in the figures below is referred to as “contact 15”). The HDEs have been developed as part of a collaborative arrangement between the University of Iowa and Radionics Inc. and are currently manufactured by AD-TECH. They have the same external physical characteristics as standard clinical depth electrodes, but have been internally modified to enable the simultaneous recording of local field potentials and single-unit or multi-unit activity (Howard et al., 1996). Research recordings were obtained simultaneously from the grid and depth electrodes while the patient-participants were reclining in a bed or sitting upright in a chair in the human electrophysiological recording facility at the University of Iowa General Clinical Research Center.
Figure 2.

A, Schematic of the hybrid depth electrode specifically designed to penetrate the amygdala. B, Postoperative structural MRI of patient-participant PT175 showing the artifact of the hybrid depth electrode. Red arrows indicate the macro-contact artifact reference location used to localize microwire contacts. C, Preoperative structural MRI of patient-participant PT175 referencing microwire contacts 7–10 (red marker) relative to the amygdala complex demarcated in blue. The contact location identified in B was projected onto this image.
We were able to record from 7 neurons in PT156 (right amygdala), 14 neurons in PT173 (left amygdala), and 30 neurons in PT 175 (15 in left, 15 in right). Due to technical problems with the recording equipment, we were only able to record single-unit activity in the HDE in one experimental session for each patient (with a total of 50 trials per participant).
Structural MRI.
We acquired T1-weighted structural MRI scans within 1 month before the implantation surgery, as well as 1 d before the electrode removal surgery. The data were acquired in a Siemens 3.0 tesla scanner (scanning parameters: contiguous non-overlapping coronal scans with 1.0 mm slice thickness; in-plane resolution 0.781 × 0.781 × 1.0 mm).
Stereotactic atlas-based localization of the electrode contact sites.
The localization of the recoding sites for the HDE was done with references to the atlas of Mai et al. (2008), which provided a detailed histological demarcation of medial temporal lobe structures, including subnuclei in the amygdala. We used a nonlinear brain-morphing method (Oya et al., 2009) to project the subnuclei of the amygdala onto the MRI volumes of individual participants. The depth electrodes created localized artifacts on the postimplantation MRI images that are readily identified (Fig. 2, compare B, C). The center of each artifact was manually selected to identify the location of each electrode. This location information was used to manually trace the location of the electrode sites in the preimplantation MRI image. Results of the electrode localization are shown in Figure 3.
Figure 3.
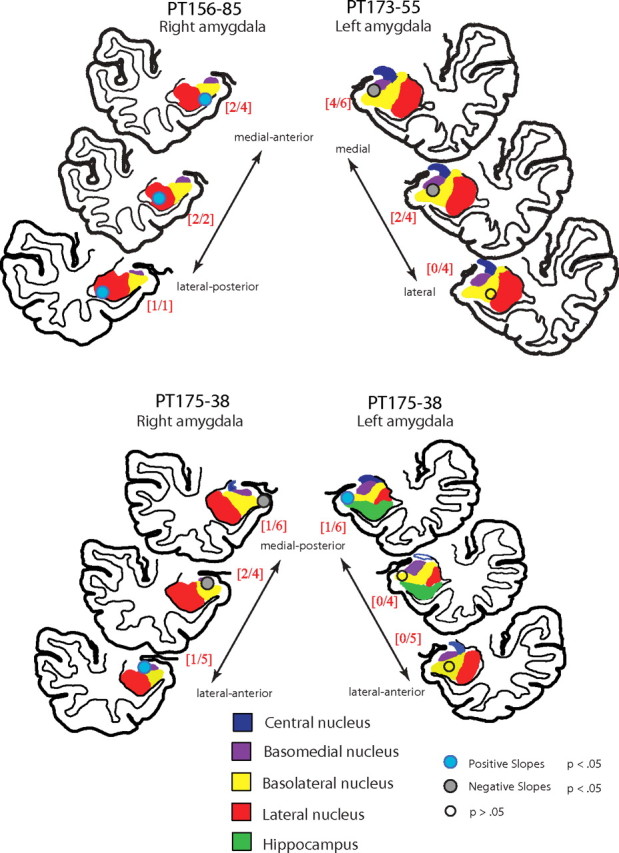
Estimated anatomical location within the amygdala of the three groups of microwire recording sites: 1–6, 7–10, and 11–14:15 (circles). The spatial groups are color coded according to the sign of the statistically significant associations between the units identified by those contacts and the measured bids. In all cases, the sign of the weights were consistent within each group. The ratio of the number of neurons that covaried with bids to the total number of recorded neurons in each spatial group is shown in red brackets.
Sorting of single-unit activity.
Action potentials (spikes) for single units or multiple units were identified from the continuous high-bandwidth, high-impedance recordings from the HDE sampled at 12207 Hz. A typical example of this recording over an interval of 5 s is shown in supplemental Fig. S1A (available at www.jneurosci.org as supplemental material). Candidate spikes were selected by amplitude thresholding, decomposed using wavelet analysis, and clustered using the algorithm developed by Quiroga et al. (2004, 2005). The wavelet analysis was based on a Haar wavelet that decomposed the candidate spikes into a nine-dimensional feature space. Spikes were clustered with similar shapes to the same unit using a stochastic nonparametric superparamagnetic approach (Domany, 1999). A single temperature parameter was titrated manually following automatic clustering. Generally, a single cluster dominated in terms of cluster size for each unit, and it was this dominant cluster that was used for further analysis. Examples are shown in supplemental Fig. S1B (available at www.jneurosci.org as supplemental material).
Basic analysis of single-unit activity.
We carried out the following basic analyses for each neuron. First, we constructed raster plots of single-unit activity in each trial, aligned to the beginning of the trial and sorted by the measured bid value for the shown item. Second, we constructed a peristimulus time histogram (PSTH) of spike activity, as a function of bin value, using non-overlapping 50 ms time bins. Third, for each time bin count we estimated a generalized linear regression of spike counts on bid value to identify time bins at which responses were related to the value of the stimuli, as measured by the bids. Results for three representative units, one from each patient-participant, are shown in Figure 4.
Figure 4.
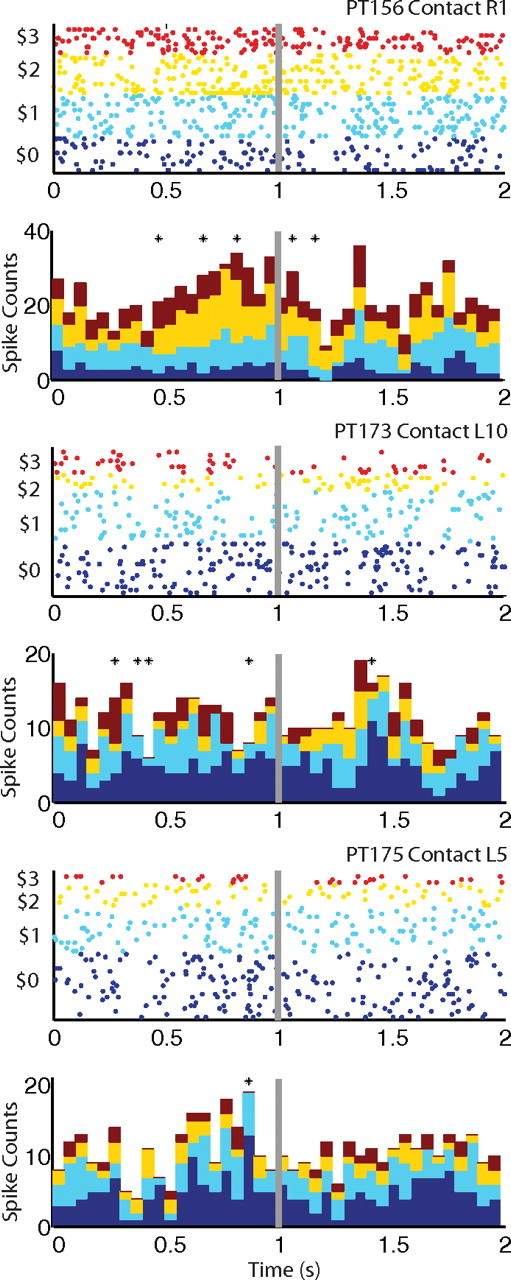
Top in each panel, Raster plots for single units sorted by measured bids for a representative neuron for each patient-participant. Bottom in each panel, Stacked poststimulus time histograms binned in 50 ms intervals from stimulus onset for each value category color coded the same as the dot-rasters. The time of request for a monetary bid is shown as a gray vertical line. Black marks denote statistically significant association with the bid value for the current food item in a specified time bin.
Point process models of the spike trains.
We also analyzed the response patterns of each neuron using a point process modeling approach, which has been repeatedly used to identify the variables driving the dynamics of spiking activity of single neurons (Brown et al., 1998, 2002, 2004; Smith and Brown, 2003; Eden et al., 2004; Paninski, 2004, 2006; Paninski et al., 2004; Truccolo et al., 2005; Ergün et al., 2007). In this framework, the spike train for neuron j within an experimental session is characterized by a sequence or set of individual spike times [s1j, …, smj]. Let Nj (t) denote the spike-counting process measuring the number of spikes that have occurred from time 0 to t, and ΔNj (t) = Nj (t) − Nj (t − Δt) denote the number of spikes that take place during the interval t − Δt to t. This formalism is illustrated in supplemental Figure S1C,D (available at www.jneurosci.org as supplemental material).
The stochastic spike time process is completely characterized by its conditional intensity function, which is defined by the following:
 |
where Ht denotes the spiking history as of time t (Daley and Vere-Jones, 2003). Note that the quantity λj (t | Ht)Δt approximates the spiking probability over the time interval t − Δt to t.
We used a generalized linear model (GLM) to estimate the conditional intensity as a function of different sets of covariates (McCullagh and Nelder, 1989; Berman and Turner, 1992). We binned the data into K time increments of Δt = 50 ms and assume that this bin size is small enough so that that the covariates and the parameters of the spiking process are approximately constant within the bin. We assume the number of spikes that arrive in the kth bin is distributed as a Poisson process. This gives rise to the likelihood function over the entire recording session, as follows:
 |
where θ is a vector of parameters characterizing the conditional intensity function, tk is the upper bound for the kth time increment, and ΔNkj denotes the number of spikes in the kth time interval. We then estimated the parameters of the model using standard maximum likelihood methods (Dobson, 2002).
We considered two natural alternative models of the conditional intensity function. (To simplify the discussion below, the time index k is dropped, and the subscript t is assumed to be a discrete index.)
Model 1.
In this model, the conditional intensity function only depends on the value of the item being evaluated in that trial, as measured by the bid. This implies the following:
where bt is a variable that takes the value of the bid of the item being shown during the evaluation and response periods, and is zero otherwise (formalized as a boxcar). β is the weighting of the revealed value for the jth neuron over the entire session of bidding. For log-linear models, the parameter estimates are often interpreted on the exponential scale (Dobson, 2002), so that for each $1 increase in bid the discharge rate would be predicted to increase by a factor of eβbid.
Model 2.
In this model, the conditional intensity function depends on both the current bid and on the local history of spiking activity, as follows:
 |
The introduction of spiking history provides an assessment of the contribution of intrinsic neural activity to the prediction of the neuron firing over the current interval of time. We assumed that Q = 4, which, given the bin size of 50 ms, corresponds to a history of 200 ms.
Note that model 1 is nested within model 2, which will be useful in the model comparisons below.
Model comparison.
We compared the fit of the two models using the deviance statistic, which for a model M is defined by the following:
where l(θmax, ΔN1:K) is the maximum log-likelihood for a saturated model of the conditional intensity function that contains as many parameters as data points, and l(θ̂, ΔN1:K) is log-likelihood for the estimated model of interest. This measure is useful because if model M1 is nested within M2, then their relative fit can be compared using the difference in the following deviance:
which has a sampling distribution that is well approximated by a χ2 with degrees of freedom equal to the difference in the number of parameters between the two models (Dobson, 1983).
Results
Behavioral results
We measured the reliability of the bid data by comparing the bids in the first session to the bids in the second session (Fig. 1B). The correlations between both sets of bids were 0.58 (p < 10−5) for PT156, 0.69 (p < 10−8) for PT173, and 0.91 (p < 10−19) for PT175. We also investigated whether the bids revealed in a given trial were affected by the value of the items shown in previous recent trials. We did this by estimating an autoregressive linear model of the current bid on the values of the previous three trials. We found no significant effect of the lagged bid values, indicating that each current bid was independent of prior bids.
Contact localization
We used a flexible nonlinear atlas-to-patient morphing technique to identify the location of the contacts for each electrode (for details, see Materials and Methods). All of the microwire contacts were localized to specific amygdala subnuclei, although the distal group of microwires for the right PT175 implanted electrode made contact with the adjacent entorhinal cortex. The subnuclei locations for each contact are described in detail in Figure 3.
Basic single-unit results
We were able to isolate 51 units across the three participants. For each of these units, we carried out the following analysis. First, we constructed raster plots for three representative neurons, one from each participant, shown in Figure 4. They provide a complete description of spike activity in every recorded trial, sorted by bid value. Second, for every trial we computed total spike activity in 50 ms non-overlapping bins aligned to the beginning of the trial. The bottom figure in each panel provides a stacked PSTH conditioned on the to-be-revealed bid value. The sum of the stacked bars is equal to the standard PSTH of total counts in each bin. Third, for each time bin we estimated a log-linear regression of spike counts on bids. As shown in the figure, in all of the neurons we found that total spike counts were associated with bids (positively or negatively) in some time intervals before the request for bid (identified by the gray line).
Point process GLM analysis
One limitation of the previous analyses is that, given the small number of trials that can be collected from single units with these human patients, and the randomness in the spike processes, there is a significant amount of noise in the data within each time bin. One way of addressing this limitation is to estimate a generalized linear model of the spike process, a method that has been used previously to identify the variables driving the dynamics of spiking activity of single neurons. We compared two simple models of spike activity. In model 1, the local spiking probability depended linearly on the value of the item bid shown at the time. In model 2, the local spiking probability depended linearly on the value, and also on the last 200 ms of spiking activity. These models were estimated independently for each unit (for details, see Materials and Methods).
Figure 5A summarizes the results by describing the sign and magnitude with which the local spiking activity is related to the bids. For PT156, five of the seven neurons that we were able to isolate in the right amygdala exhibited a positive and significant responsivity to the bids. For PT173, 6 of the 14 neurons that were isolated exhibited a negative and significant responsivity to the values. For PT175 1 of 15 neurons isolated in left amygdala and 1 of the 15 neurons isolated in right amygdala were positively and significantly responsive to values, and 3 of the 15 units isolated in right amygdala were negatively responsive.
Figure 5.
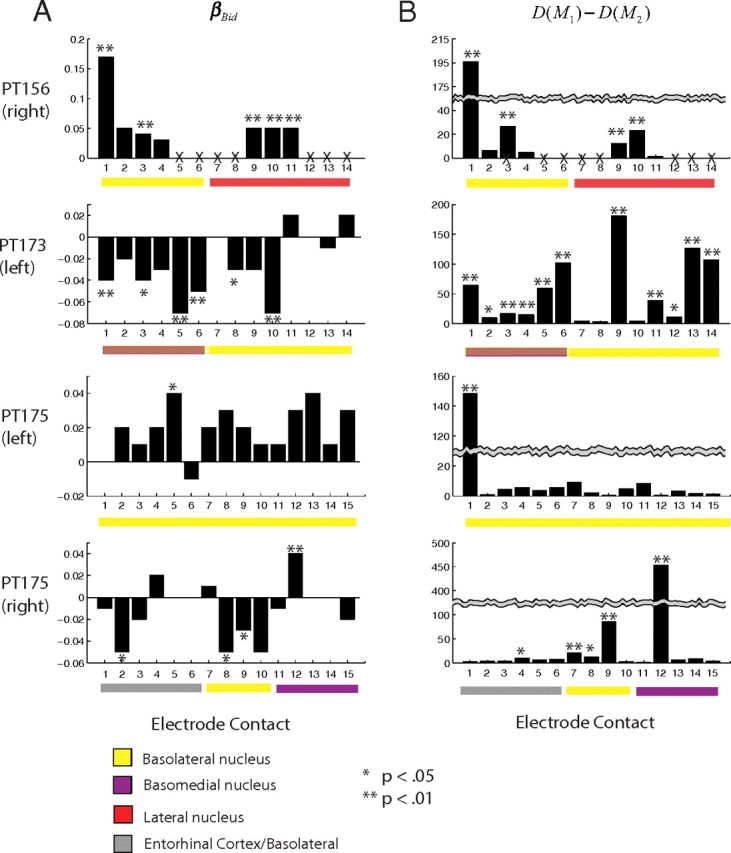
Summary of GLM analyses for all recorded units. A, Strength and significance of the association between spiking activity and bids in each contact. B, Deviance test of the extent to which recent spiking history had a significant influence on single-unit activity. Active contacts on the hybrid electrode are labeled according to anatomical location. Broken wires on PT156 are denoted by Xs. Contact group 1–6 for PT173 is on the border of the basolateral and basomedial subnuclei and denoted as a color transparency.
Our analyses also allowed us to compare the fit of the two models of the spike process. As described in the Materials and Methods section, when two models are nested their relative fits can be compared using the difference in their deviance statistics. Figure 5B summarizes the model comparison analysis by plotting the difference in deviances between model 1 and model 2 for each isolated unit. Note that large numbers of this statistic indicate that the more complicated model 2, which includes the local history of activity, provides a better fit to the spike data while accounting for the increase in parameters. In almost all of the units that exhibited a significant association with the bids, model 2 provided a significantly better fit of the spike data. This finding is important because it shows that the spike process that these amygdala units exhibit is subject to dynamic forces that are not fully captured by the value of the stimulus alone but are conditionally dependent on the intrinsic spiking history over the course of the trial.
Figure 6 provides two alternative ways of evaluating the GLM expression. Figure 6A shows how three different variables change as a function of time, as follows: (1) the raw spike counts zero-phase filtered with a 128-tap finite impulse response (FIR) filter with a 1 Hz low-pass cutoff; (2) the spike rates predicted by the estimated model 1; and (3) the spike rates predicted by the estimated model 2. Model 1 (red) expresses the conditional intensity (instantaneous rate) as the exponential of the log-linear relationship of the spiking activity and bid covariate, and consequently reveals graphically the degree to which the bid value predicts the rate. The temporal clustering of intrinsic spike events for this neuron can be observed as large modulations in predicted rate by model 2 (black) exceeding that of the extrinsic bid alone fit of model 1 (red). The general improvement of the predicted spike rate is characterized by the observed large differences in deviance between model 1 and model 2. Although the filtered raw spike counts (gray) can be seen to smoothly covary with the parametric conditional intensity, it fails to capture the fine detail revealed using the Poisson GLM, which formally takes into account the covariates of interest and provides a principled method for hypothesis testing.
Figure 6.
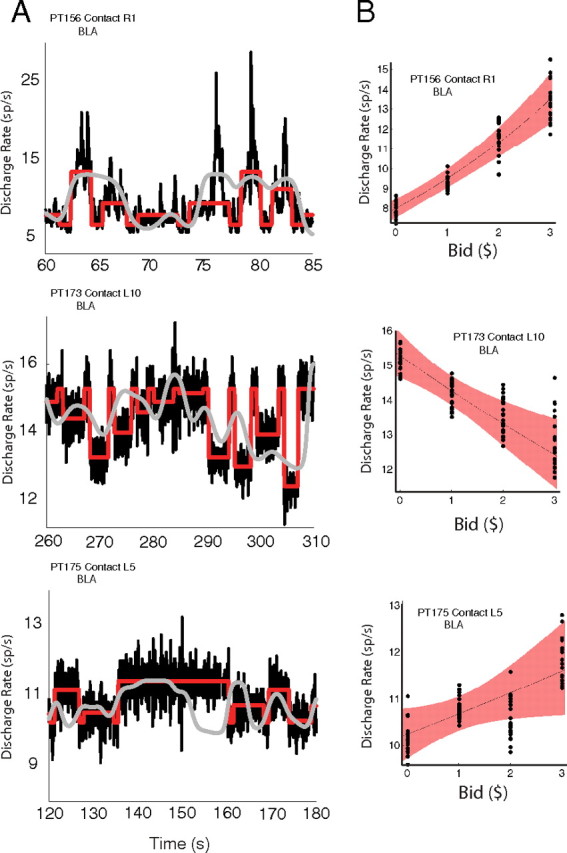
Conditional intensity function modeled as a GLM for single neurons for three representative neurons. A, Subset interval from a single experimental session showing three time series: the raw spike counts filtered with a zero-phase FIR filter (gray), the spike rates predicted by the estimated model 1 (red), and the spike rates predicted by the estimated model 2 (black). B, Predicted discharge rate as a function of measured bids. Basic analysis: spikes categorized by behavioral bids over all trials are summarized as a scatter of 20 bootstrapped mean counts (black dots). Parametric GLM: 95% confidence envelope (red ribbon) of the conditional intensity function from model 1 as a function of bid value.
An alternative way of evaluating the expression of the estimated GLM is to plot the predictions and confidence intervals of the models as a function of the value of the item shown in the trial. Figure 6B compares the 95% confidence envelope of the predicted spike rates with bootstrapped means of actual mean spike activity for the trials in each value category. (We obtained 20 bootstrapped means by drawing random samples from each bid category with replacement.) The figure shows that the assumption of a linear relationship between the behaviorally measured values and the spiking activity provides a general good description of the data.
Spatial location of value-related activity
Figure 3 provides a description of the localization of the value-related activity within amygdala subnuclei. The figure shows the location of contact groups 1–6 (in the most medial-anterior section), 7–10 in the medial section, and 11–14 in the more lateral posterior section. Figure 3 provides a color-coded summary of the significance and sign of the association with bids. The ratios of the number of neurons that covaried significantly with the bid value to the total number of recorded neurons in each spatial group are shown in red brackets. Note that of the 16 neurons that covaried significantly with bids, 11 were localized inside or at the boundary of the BLA subnucleus.
Discussion
The results presented here provide evidence consistent with the hypothesis that single neuron activity in the human amygdala might play a role in either encoding or computing stimulus values at the time of choice. The results also suggest that a significant fraction of amygdala neurons might participate in these computations, since 16 of 51 recorded units exhibited responses that were linearly associated with the behavioral bids, and that the BLA subnucleus might play an especially important role, since 11 of the 16 neurons were located or bordered there. We found similar proportions of neurons exhibiting positive and negative associations with the measured values (9 of 16 were negative), which suggests that the amygdala might have detectors for both the appetitiveness and the aversiveness of stimuli.
These results are interesting for several reasons. First, to the best of our knowledge, they provide the first direct demonstration that single units in the human amygdala respond in a manner compatible with the computation of stimulus values at the time of decision making. Second, while most animal recordings are based on highly learned tasks, our participants performed a novel bidding task for which they had no previous practice and used relatively novel stimuli. This suggests that the amygdala's involvement in value computations at the time of choice is not restricted to highly practiced and familiar environments. Third, the results suggest that the amygdala plays a role in valuation even in humans, despite the expanded and specialized role of the frontal cortex in this species.
Our results are consistent with findings from the previous literature about the role of the amygdala in valuation in nondecision contexts. In particular, previous monkey electrophysiology studies have shown that this area encodes the value of both stimuli during pavlovian appetitive and aversive conditioning tasks (Paton et al., 2006; Belova et al., 2007, 2008; Salzman et al., 2007). Interestingly, these previous studies also found a combination of positive and negative associations with the value of the stimuli, with a small excess of negative coding. If robust, these findings would suggest that the amygdala is involved in both types of coding, with a small dominance of negative responses, which helps to reconcile our findings with the large literature on amygdala responses to fear-conditioned stimuli (LeDoux, 2000; Morrison and Salzman, 2010). Together, this growing body of literature suggests that the amygdala is likely to play a critical role in the computation of stimulus values across a large range of decision and perceptual tasks.
We found that activity in the amygdala units was heavily influenced by recent spiking activity. Past intrinsic spiking activity, as characterized by the GLM analysis, may reveal collective dynamics important to the encoding of value (Truccolo et al., 2010). It is unlikely that the intrinsic activity modeled by the spiking history in the GLM is due only to random background activity. If that were the case, the variance would largely be accounted for by the GLM constant or intercept. These higher order modulations may reflect reciprocal streams of information to and from the OFC or the ventral striatum. Further experimentation and analysis will be required to investigate the interactions with other brain areas implicated in the computation of value.
One natural question is what is the precise role that the amygdala signals found here play in the computation of values at the time of decision making. Although at this stage we can only speculate, several pieces of evidence suggest that the amygdala might influence decision making in the class of tasks studied here by influencing the stimulus value signals computed in the OFC. First, the OFC shares many reciprocal connections with the amygdala (McDonald, 1998; Baxter and Murray, 2002; Price, 2003; Winstanley et al., 2004; Schoenbaum and Roesch, 2005; Roy et al., 2009; Murray and Wise, 2010). Second, a recent fMRI study of decision making in patients with amygdala damage found that they exhibited impaired value processing in the ventromedial prefrontal cortex (Hampton et al., 2007). Converging evidence from the rodent literature has shown that OFC neurons encoding expected outcome value are greatly reduced in BLA-lesioned rats, along with observed deficits in goal-directed behavior (Schoenbaum et al., 2003).
Our experimental design and methodology have some limitations that should be addressed in future studies. First, because only neutral-to-appetitive stimuli were used, the value of their stimuli and the arousal and attentional responses that they generate are very highly correlated. As a result, although our results are consistent with the presence of value signals in these units, and this is consistent with the previous literature involving this area of the amygdala in valuation in nonhuman primates (Morrison and Salzman, 2010), we cannot rule out the possibility that the identified units respond to arousal or attention instead of value. Second, due to the difficulties, ethics, and limitations of carrying out single-unit recordings in human patients, we were only able to record single-unit activity in 50 trials per participant. Since activity in single units is known to be noisy, this is likely to have introduced a false-negative bias in our analyses, which suggests that our results should put a lower bound on the fraction of amygdala units that are likely to be involved in value-related computations.
Footnotes
This work was supported by the National Institute on Alcohol Abuse and Alcoholism and Collaborative Research in Computational Neuroscience Grant R01AA018736 (R.L.J., A.R., M.A.H.), National Science Foundation Grant SES-0820316 (R.L.J.), National Institutes of Health Grants R01DC04290 (M.A.H.), MO1RR59 (General Clinical Research Centers Program, M.A.H.), the Hoover Fund (M.A.H.), and the Carver Trust (M.A.H.).
References
- Balleine BW, Killcross S. Parallel incentive processing: an integrated view of amygdala function. Trends Neurosci. 2006;29:272–279. doi: 10.1016/j.tins.2006.03.002. [DOI] [PubMed] [Google Scholar]
- Balleine BW, Killcross AS, Dickinson A. The effect of lesions of the basolateral amygdala on instrumental conditioning. J Neurosci. 2003;23:666–675. doi: 10.1523/JNEUROSCI.23-02-00666.2003. [DOI] [PMC free article] [PubMed] [Google Scholar]
- Baxter MG, Murray EA. The amygdala and reward. Nat Rev Neurosci. 2002;3:563–573. doi: 10.1038/nrn875. [DOI] [PubMed] [Google Scholar]
- Becker GM, DeGroot MH, Marschak J. Measuring utility by a single-response sequential method. Behav Sci. 1964;9:226–232. doi: 10.1002/bs.3830090304. [DOI] [PubMed] [Google Scholar]
- Belova MA, Paton JJ, Morrison SE, Salzman CD. Expectation modulates neural responses to pleasant and aversive stimuli in primate amygdala. Neuron. 2007;55:970–984. doi: 10.1016/j.neuron.2007.08.004. [DOI] [PMC free article] [PubMed] [Google Scholar]
- Belova MA, Paton JJ, Salzman CD. Moment-to-moment tracking of state value in the amygdala. J Neurosci. 2008;28:10023–10030. doi: 10.1523/JNEUROSCI.1400-08.2008. [DOI] [PMC free article] [PubMed] [Google Scholar]
- Berman M, Turner TR. Approximating point process likelihoods with GLIM. J R Stat Soc Ser C Appl Stat. 1992;41:31–38. [Google Scholar]
- Brown EN, Frank LM, Tang D, Quirk MC, Wilson MA. A statistical paradigm for neural spike train decoding applied to position prediction from ensemble firing patterns of rat hippocampal place cells. J Neurosci. 1998;18:7411–7425. doi: 10.1523/JNEUROSCI.18-18-07411.1998. [DOI] [PMC free article] [PubMed] [Google Scholar]
- Brown EN, Barbieri R, Ventura V, Kass RE, Frank LM. The time-rescaling theorem and its application to neural spike train data analysis. Neural Comput. 2002;14:325–346. doi: 10.1162/08997660252741149. [DOI] [PubMed] [Google Scholar]
- Brown EN, Kass RE, Mitra PP. Multiple neural spike train data analysis: state-of-the-art and future challenges. Nat Neurosci. 2004;7:456–461. doi: 10.1038/nn1228. [DOI] [PubMed] [Google Scholar]
- Daley DJ, Vere-Jones D. An introduction to the theory of point processes. Ed 2. New York: Springer; 2003. [Google Scholar]
- Dobson AJ. Introduction to statistical modelling. New York: Chapman and Hall; 1983. [Google Scholar]
- Dobson AJ. An introduction to generalized linear models. Ed 2. Boca Raton, FL: Chapman and Hall/CRC; 2002. [Google Scholar]
- Domany E. Superparamagnetic clustering of data—the definitive solution of an ill-posed problem. Physica A. 1999;263:158–169. [Google Scholar]
- Eden UT, Frank LM, Barbieri R, Solo V, Brown EN. Dynamic analysis of neural encoding by point process adaptive filtering. Neural Comput. 2004;16:971–998. doi: 10.1162/089976604773135069. [DOI] [PubMed] [Google Scholar]
- Ergün A, Barbieri R, Eden UT, Wilson MA, Brown EN. Construction of point process adaptive filter algorithms for neural systems using sequential Monte Carlo methods. IEEE Trans Biomed Eng. 2007;54:419–428. doi: 10.1109/TBME.2006.888821. [DOI] [PubMed] [Google Scholar]
- Ghashghaei HT, Barbas H. Pathways for emotion: interactions of prefrontal and anterior temporal pathways in the amygdala of the rhesus monkey. Neuroscience. 2002;115:1261–1279. doi: 10.1016/s0306-4522(02)00446-3. [DOI] [PubMed] [Google Scholar]
- Ghashghaei HT, Hilgetag CC, Barbas H. Sequence of information processing for emotions based on the anatomic dialogue between prefrontal cortex and amygdala. Neuroimage. 2007;34:905–923. doi: 10.1016/j.neuroimage.2006.09.046. [DOI] [PMC free article] [PubMed] [Google Scholar]
- Ghods-Sharifi S, St Onge JR, Floresco SB. Fundamental contribution by the basolateral amygdala to different forms of decision making. J Neurosci. 2009;29:5251–5259. doi: 10.1523/JNEUROSCI.0315-09.2009. [DOI] [PMC free article] [PubMed] [Google Scholar]
- Hampton AN, Adolphs R, Tyszka MJ, O'Doherty JP. Contributions of the amygdala to reward expectancy and choice signals in human prefrontal cortex. Neuron. 2007;55:545–555. doi: 10.1016/j.neuron.2007.07.022. [DOI] [PubMed] [Google Scholar]
- Hare TA, O'Doherty J, Camerer CF, Schultz W, Rangel A. Dissociating the role of the orbitofrontal cortex and the striatum in the computation of goal values and prediction errors. J Neurosci. 2008;28:5623–5630. doi: 10.1523/JNEUROSCI.1309-08.2008. [DOI] [PMC free article] [PubMed] [Google Scholar]
- Hare TA, Camerer CF, Rangel A. Self-control in decision-making involves modulation of the vMPFC valuation system. Science. 2009;324:646–648. doi: 10.1126/science.1168450. [DOI] [PubMed] [Google Scholar]
- Hare TA, Camerer CF, Knoepfle DT, Rangel A. Value computations in ventral medial prefrontal cortex during charitable decision making incorporate input from regions involved in social cognition. J Neurosci. 2010;30:583–590. doi: 10.1523/JNEUROSCI.4089-09.2010. [DOI] [PMC free article] [PubMed] [Google Scholar]
- Holland PC, Petrovich GD, Gallagher M. The effects of amygdala lesions on conditioned stimulus-potentiated eating in rats. Physiol Behav. 2002;76:117–129. doi: 10.1016/s0031-9384(02)00688-1. [DOI] [PubMed] [Google Scholar]
- Howard MA, 3rd, Volkov IO, Granner MA, Damasio HM, Ollendieck MC, Bakken HE. A hybrid clinical-research depth electrode for acute and chronic in vivo microelectrode recording of human brain neurons—technical note. J Neurosurg. 1996;84:129–132. doi: 10.3171/jns.1996.84.1.0129. [DOI] [PubMed] [Google Scholar]
- Izquierdo A, Murray EA. Selective bilateral amygdala lesions in rhesus monkeys fail to disrupt object reversal learning. J Neurosci. 2007;27:1054–1062. doi: 10.1523/JNEUROSCI.3616-06.2007. [DOI] [PMC free article] [PubMed] [Google Scholar]
- Kable JW, Glimcher PW. The neural correlates of subjective value during intertemporal choice. Nat Neurosci. 2007;10:1625–1633. doi: 10.1038/nn2007. [DOI] [PMC free article] [PubMed] [Google Scholar]
- Kable JW, Glimcher PW. The neurobiology of decision: consensus and controversy. Neuron. 2009;63:733–745. doi: 10.1016/j.neuron.2009.09.003. [DOI] [PMC free article] [PubMed] [Google Scholar]
- LeDoux JE. Emotion circuits in the brain. Annu Rev Neurosci. 2000;23:155–184. doi: 10.1146/annurev.neuro.23.1.155. [DOI] [PubMed] [Google Scholar]
- Levy I, Snell J, Nelson AJ, Rustichini A, Glimcher PW. The neural representation of subjective value under risk and ambiguity. J Neurophysiol. 2010;103:1036–1047. doi: 10.1152/jn.00853.2009. [DOI] [PubMed] [Google Scholar]
- Machado CJ, Bachevalier J. The effects of selective amygdala, orbital frontal cortex or hippocampal formation lesions on reward assessment in nonhuman primates. Eur J Neurosci. 2007;25:2885–2904. doi: 10.1111/j.1460-9568.2007.05525.x. [DOI] [PubMed] [Google Scholar]
- Mai JK, Paxinos G, Voss T. Atlas of the human brain. Amsterdam: Academic; 2008. [Google Scholar]
- McCullagh P, Nelder JA. Generalized linear models. Boca Raton, FL: Chapman and Hall/CRC; 1989. [Google Scholar]
- McDonald AJ. Cortical pathways to the mammalian amygdala. Prog Neurobiol. 1998;55:257–332. doi: 10.1016/s0301-0082(98)00003-3. [DOI] [PubMed] [Google Scholar]
- Montague PR, Berns GS. Neural economics and the biological substrates of valuation. Neuron. 2002;36:265–284. doi: 10.1016/s0896-6273(02)00974-1. [DOI] [PubMed] [Google Scholar]
- Morrison SE, Salzman CD. Re-valuing the amygdala. Current opinion in neurobiology. 2010;20:221–230. doi: 10.1016/j.conb.2010.02.007. [DOI] [PMC free article] [PubMed] [Google Scholar]
- Murray EA, Izquierdo A. Orbitofrontal cortex and amygdala contributions to affect and action in primates. Ann N Y Acad Sci. 2007;1121:273–296. doi: 10.1196/annals.1401.021. [DOI] [PubMed] [Google Scholar]
- Murray EA, Wise SP. Interactions between orbital prefrontal cortex and amygdala: advanced cognition, learned responses and instinctive behaviors. Curr Opin Neurobiol. 2010;20:212–220. doi: 10.1016/j.conb.2010.02.001. [DOI] [PMC free article] [PubMed] [Google Scholar]
- Oya H, Kawasaki H, Dahdaleh NS, Wemmie JA, Howard MA., 3rd Stereotactic atlas-based depth electrode localization in the human amygdala. Stereotact Funct Neurosurg. 2009;87:219–228. doi: 10.1159/000225975. [DOI] [PMC free article] [PubMed] [Google Scholar]
- Padoa-Schioppa C, Assad JA. Neurons in the orbitofrontal cortex encode economic value. Nature. 2006;441:223–226. doi: 10.1038/nature04676. [DOI] [PMC free article] [PubMed] [Google Scholar]
- Padoa-Schioppa C, Assad JA. The representation of economic value in the orbitofrontal cortex is invariant for changes of menu. Nat Neurosci. 2008;11:95–102. doi: 10.1038/nn2020. [DOI] [PMC free article] [PubMed] [Google Scholar]
- Paninski L. Maximum likelihood estimation of cascade point-process neural encoding models. Network. 2004;15:243–262. [PubMed] [Google Scholar]
- Paninski L. The most likely voltage path and large deviations approximations for integrate-and-fire neurons. J Comput Neurosci. 2006;21:71–87. doi: 10.1007/s10827-006-7200-4. [DOI] [PubMed] [Google Scholar]
- Paninski L, Pillow JW, Simoncelli EP. Maximum likelihood estimation of a stochastic integrate-and-fire neural encoding model. Neural Comput. 2004;16:2533–2561. doi: 10.1162/0899766042321797. [DOI] [PubMed] [Google Scholar]
- Paton JJ, Belova MA, Morrison SE, Salzman CD. The primate amygdala represents the positive and negative value of visual stimuli during learning. Nature. 2006;439:865–870. doi: 10.1038/nature04490. [DOI] [PMC free article] [PubMed] [Google Scholar]
- Paulus MP, Frank LR. Ventromedial prefrontal cortex activation is critical for preference judgments. Neuroreport. 2003;14:1311–1315. doi: 10.1097/01.wnr.0000078543.07662.02. [DOI] [PubMed] [Google Scholar]
- Plassmann H, O'Doherty J, Rangel A. Orbitofrontal cortex encodes willingness to pay in everyday economic transactions. J Neurosci. 2007;27:9984–9988. doi: 10.1523/JNEUROSCI.2131-07.2007. [DOI] [PMC free article] [PubMed] [Google Scholar]
- Plassmann H, O'Doherty JP, Rangel A. Appetitive and aversive goal values are encoded in the medial orbitofrontal cortex at the time of decision making. J Neurosci. 2010;30:10799–10808. doi: 10.1523/JNEUROSCI.0788-10.2010. [DOI] [PMC free article] [PubMed] [Google Scholar]
- Price JL. Comparative aspects of amygdala connectivity. Ann N Y Acad Sci. 2003;985:50–58. doi: 10.1111/j.1749-6632.2003.tb07070.x. [DOI] [PubMed] [Google Scholar]
- Quiroga RQ, Nadasdy Z, Ben-Shaul Y. Unsupervised spike detection and sorting with wavelets and superparamagnetic clustering. Neural Comput. 2004;16:1661–1687. doi: 10.1162/089976604774201631. [DOI] [PubMed] [Google Scholar]
- Quiroga RQ, Reddy L, Kreiman G, Koch C, Fried I. Invariant visual representation by single neurons in the human brain. Nature. 2005;435:1102–1107. doi: 10.1038/nature03687. [DOI] [PubMed] [Google Scholar]
- Rangel A, Hare T. Neural computations associated with goal-directed choice. Curr Opin Neurobiol. 2010;20:262–270. doi: 10.1016/j.conb.2010.03.001. [DOI] [PubMed] [Google Scholar]
- Rangel A, Camerer C, Montague PR. A framework for studying the neurobiology of value-based decision making. Nat Rev Neurosci. 2008;9:545–556. doi: 10.1038/nrn2357. [DOI] [PMC free article] [PubMed] [Google Scholar]
- Roy AK, Shehzad Z, Margulies DS, Kelly AM, Uddin LQ, Gotimer K, Biswal BB, Castellanos FX, Milham MP. Functional connectivity of the human amygdala using resting state fMRI. Neuroimage. 2009;45:614–626. doi: 10.1016/j.neuroimage.2008.11.030. [DOI] [PMC free article] [PubMed] [Google Scholar]
- Rushworth MF, Mars RB, Summerfield C. General mechanisms for making decisions? Curr Opin Neurobiol. 2009;19:75–83. doi: 10.1016/j.conb.2009.02.005. [DOI] [PubMed] [Google Scholar]
- Salzman CD, Paton JJ, Belova MA, Morrison SE. Flexible neural representations of value in the primate brain. Ann N Y Acad Sci. 2007;1121:336–354. doi: 10.1196/annals.1401.034. [DOI] [PMC free article] [PubMed] [Google Scholar]
- Schoenbaum G, Roesch M. Orbitofrontal cortex, associative learning, and expectancies. Neuron. 2005;47:633–636. doi: 10.1016/j.neuron.2005.07.018. [DOI] [PMC free article] [PubMed] [Google Scholar]
- Schoenbaum G, Setlow B, Saddoris MP, Gallagher M. Encoding predicted outcome and acquired value in orbitofrontal cortex during cue sampling depends upon input from basolateral amygdala. Neuron. 2003;39:855–867. doi: 10.1016/s0896-6273(03)00474-4. [DOI] [PubMed] [Google Scholar]
- Smith AC, Brown EN. Estimating a state-space model from point process observations. Neural Comput. 2003;15:965–991. doi: 10.1162/089976603765202622. [DOI] [PubMed] [Google Scholar]
- Stefanacci L, Amaral DG. Topographic organization of cortical inputs to the lateral nucleus of the macaque monkey amygdala: a retrograde tracing study. J Comp Neurol. 2000;421:52–79. doi: 10.1002/(sici)1096-9861(20000522)421:1<52::aid-cne4>3.0.co;2-o. [DOI] [PubMed] [Google Scholar]
- Stefanacci L, Amaral DG. Some observations on cortical inputs to the macaque monkey amygdala: an anterograde tracing study. J Comp Neurol. 2002;451:301–323. doi: 10.1002/cne.10339. [DOI] [PubMed] [Google Scholar]
- Tom SM, Fox CR, Trepel C, Poldrack RA. The neural basis of loss aversion in decision-making under risk. Science. 2007;315:515–518. doi: 10.1126/science.1134239. [DOI] [PubMed] [Google Scholar]
- Truccolo W, Eden UT, Fellows MR, Donoghue JP, Brown EN. A point process framework for relating neural spiking activity to spiking history, neural ensemble, and extrinsic covariate effects. J Neurophysiol. 2005;93:1074–1089. doi: 10.1152/jn.00697.2004. [DOI] [PubMed] [Google Scholar]
- Truccolo W, Hochberg LR, Donoghue JP. Collective dynamics in human and monkey sensorimotor cortex: predicting single neuron spikes. Nat Neurosci. 2010;13:105–111. doi: 10.1038/nn.2455. [DOI] [PMC free article] [PubMed] [Google Scholar]
- Valentin VV, Dickinson A, O'Doherty JP. Determining the neural substrates of goal-directed learning in the human brain. J Neurosci. 2007;27:4019–4026. doi: 10.1523/JNEUROSCI.0564-07.2007. [DOI] [PMC free article] [PubMed] [Google Scholar]
- Wallis JD, Miller EK. Neuronal activity in primate dorsolateral and orbital prefrontal cortex during performance of a reward preference task. Eur J Neurosci. 2003;18:2069–2081. doi: 10.1046/j.1460-9568.2003.02922.x. [DOI] [PubMed] [Google Scholar]
- Winstanley CA, Theobald DE, Cardinal RN, Robbins TW. Contrasting roles of basolateral amygdala and orbitofrontal cortex in impulsive choice. J Neurosci. 2004;24:4718–4722. doi: 10.1523/JNEUROSCI.5606-03.2004. [DOI] [PMC free article] [PubMed] [Google Scholar]