

Abstract
Background
Motor signs (MOSIs) are common in Alzheimer disease (AD) and may be associated with rates of cognitive decline, mortality, and cost of care.
Objective
To describe the progression and identify predictors of individual MOSIs in AD.
Methods
A cohort of 474 patients with AD at early stages was followed semiannually for up to 13.1 years (mean 3.6 years) in five centers in Europe and the United States. MOSIs were rated using a standardized portion of the Unified Parkinson's Disease Rating Scale. Overall, 3,030 visits/assessments of MOSIs (average 6.4/patient) were performed. Prevalence and incidence rates were calculated, and cumulative risk graphs were plotted for individual non-drug-induced MOSI domains. Rates of change over time taking into account potential covariates were also estimated. With use of each MOSI domain as outcome in Cox models, predictors of MOSI incidence were identified.
Results
At least one MOSI was detected in 13% of patients at first examination and in 36% for the last evaluation. Total MOSI score increased at an annual rate of 3% of total possible score. Rates of annual change for speech/facial expression (4%), rigidity (2.45%), posture/gait (3.9%), and bradykinesia (3.75%) were of similar magnitude, and their occurrence increased from first (3 to 6%) to last (22 to 29%) evaluation. Tremor was less frequent throughout the course of the disease (4% at first and 7% at last evaluation) and worsened less (0.75% increase/year).
Conclusions
Most motor signs occur frequently and progress rapidly in Alzheimer disease. Tremor is an exception in that it occurs less frequently and advances at slower rates.
Many studies have reported that motor signs (MOSIs) are commonly observed in Alzheimer disease (AD) and that they increase in frequency and severity over time. These MOSIs may result from different underlying mechanisms, and although they are usually considered as resulting from pathologic changes of the extrapyramidal system, their exact anatomic location is not clear. For this reason, in this article, we use the term “MOSI” to refer to what is usually described in the literature as extrapyramidal signs or parkinsonian signs or parkinsonism. Information about the presence of MOSIs in AD is important because they may predict cognitive decline,1-3 institutionalization,4-6 and death.5,7-10 In addition, as compared with AD patients without MOSIs, AD patients with MOSIs have on average $7,394 higher annual total cost of care (a 1-point increase in an MOSI scale has been associated with an annual increase of $827 in total costs of care).11
However, there is large variability in reported frequencies for various stages of the disease. For example, in a review of clinical series published over a 10-year period, frequency of MOSIs in AD ranged from 6% to >50%.12 Some of this inconsistency derives from methodologic differences including variable definitions of MOSIs, inclusion or exclusion of subjects who used neuroleptics, use of standardized scales vs just clinical evaluation, inclusion of subjects at varying stages of disease, variable levels of participation at follow-up, etc. Additionally, most information about MOSIs in AD is inferred from cross-sectional studies; although AD is a progressive disease, relatively little information is available from longitudinal studies tracking MOSI changes over time. Also, most studies examine MOSIs globally, and only few reports have focused on individual subsets of MOSIs.6 With few exceptions,13 MOSIs are treated dichotomously (either present or absent), limiting information about the full range of motoric changes that occur over time in AD. Finally, little is known about specific factors that influence the occurrence or rate of progression of MOSIs in AD.
To investigate these issues, we analyzed data from a large, multicenter cohort of patients with probable AD that included patients from very early disease stages and included semiannual, standardized assessment of MOSIs for up to 13 years of follow-up. We first attempted to characterize the occurrence of different types of MOSIs and MOSIs overall during the natural course of AD. Taking advantage of the fact that five different centers participated in this study, we examined whether development of MOSIs in AD differs for populations of different ethnic origin. We also investigated the existence of other factors that may predict which AD patients will develop MOSIs. We finally explored rates of change of different types of MOSIs and MOSIs overall over the course of AD, controlling for factors that may affect these rates.
Methods
Subjects
In these analyses, we include subjects from two Predictors Study cohorts.14 For the first cohort, patients were recruited and studied at three sites in the USA: Columbia University (NY), Johns Hopkins University (Baltimore, MD), and Harvard University (Boston, MA). For the second cohort, two additional sites in the European Union were added: Hospital de la Salpetriere (Paris, France) and University of Thessaly (Larissa, Greece). The study was approved by the appropriate local institutional review boards.
The inclusion and exclusion criteria as well as the evaluation procedures of the Predictors Study have been fully described elsewhere.14 In brief, patients met Diagnostic and Statistical Manual for Mental Disorders (3rd rev. ed.) criteria for primary degenerative dementia of the Alzheimer type and National Institute of Neurologic Disorders and Stroke/Alzheimer's Disease and Related Disorders Association criteria for probable AD. Enrollment required a modified Mini-Mental State (mMMS) score of ≥30 (maximum mMMS score, 57), which is equivalent to a score of approximately ≥16 on the Folstein Mini-Mental State Examination (MMSE).15,16 Exclusion criteria were diagnosis of Parkinson disease or parkinsonism at any time prior to the onset of intellectual decline, clinical or historical evidence of stroke, history of alcohol abuse or dependence, any electroconvulsive treatment within 2 years of recruitment or ≥10 electroconvulsive sessions at any time, and history or current clinical evidence of schizophrenia or schizoaffective disorder that started before the onset of intellectual decline. Each consecutive patient who met the inclusion but not the exclusion criteria of the study was included, except for those who did not consent to participate or who lived too far and were unable to return to the hospital for regular follow-up.
Patients' clinical diagnosis was revisited yearly, and only subjects who were consistently over time thought to have clinical AD were used for analyses. Subjects of this cohort were classified as having clinical AD (and not Lewy body dementia) because MOSIs did not develop until later stages of their disease.
Evaluation measures
At the initial visit, various demographic (age, ethnicity, sex, education, etc.) and disease severity features were assessed. APOE studies were not an original component of the Predictors Study because when data collection was initiated, APOE testing was not available. Beginning in the sixth year of the study, however, available subjects were approached to contribute blood samples for analyses. The pattern of each subject's APOE isoforms was determined using the method of Hixson.17 For the purposes of analysis, patients were dichotomized into two groups: those carrying an ε4 allele (either two ε4 alleles [ε4/ε4] or one ε4 allele [ε3/ε4 or ε2/ε4]) and those carrying no ε4 alleles (ε3/ε3 or ε2/ε2 or ε3/ε2).
Neurologic and mental status examinations were conducted at study entry and at 6-month intervals thereafter. The cognitive function measure used for the analysis was the mMMSE (in English for the US sites and in French- and Greek-translated versions for the European Union sites).15,16,18 This is a 57-point version of the original Folstein MMSE15 that includes the addition of digit span forward and backward,19 two additional calculation items, recall of the current and four previous presidents of the United States, confrontation naming of 10 items from the Boston Naming Test,20 one additional sentence to repeat, and one additional figure to copy. Functional capacity was assessed using the Blessed Dementia Rating Scale (BDRS) Parts I and II.21 The range is between 0 and 17, with higher scores indicating worse functional status.
MOSIs were assessed by trained examiners using a modified Unified Parkinson's Disease Rating Scale (UPDRS) that has good interrater reliability properties in dementia populations.22 More specifically, excellent agreement for all five rigidity items and gait and fair to good agreement for speech, facial expression, posture, and body bradykinesia/hypokinesia have been demonstrated with use of this scale.22 Because no tremor was detected in that study, adequate assessment of tremor reliability could not be performed, but good to excellent reliabilities for the UPDRS tremor items have been demonstrated in other studies.23 The reliability properties of the scale have been demonstrated for raters in the primary site of this study (Columbia University); no among-recruitment center assessments were performed because across-center reliability in a particular point in time would be of limited value, given the long duration of this study and continuous change of raters over time.
The following 11 items were rated on a scale of 0 to 4 (with 0 being normal and 4 indicating maximum impairment): speech, tremor at rest (in any limb), facial expression, neck rigidity, right arm rigidity, left arm rigidity, right leg rigidity, left leg rigidity, posture, gait, body bradykinesia/hypokinesia. The 11 items were grouped into the following five domains: speech/facial expression (two items, range 0 to 8), tremor (one item, range 0 to 4), rigidity (five items, range 0 to 20), posture/gait (two items, range 0 to 8), and bradykinesia (one item, range 0 to 4). Total MOSI score was used in the analyses in two different ways. First, a dichotomous MOSI variable was used: total score of ≥2 vs total score of <2. The reasons for this cutoff are as follows: 1) we previously demonstrated good interrater reliability for severity at least mild to moderate (score of ≥2, i.e., >1, which indicates slight severity)22; 2) this level of severity is also more likely to be noted by the average clinician. Second, to make better use of the full range of the recorded data, total MOSI score as a continuous variable was used (range 0 to 44). The domain subscores were also used in two different ways: dichotomous form (domain score of ≥2 vs domain score of <2) and continuous form.
Only non-drug-induced MOSIs were considered for these analyses. More specifically, at every 6-month visit, the following two items were recorded: 1) Was the patient on medications that could cause MOSIs (such as neuroleptics)? 2) Had the patient taken such medications in the past but did not continue to do so? If there was an affirmative answer to either of the two questions, the particular subject-evaluation was excluded from the analyses.
Statistical analyses
At first, we calculated prevalence of MOSIs at initial and last visits. Because patients were followed up for different lengths of time, we calculated incidence rates as follows: We took the total number of new cases (patients with new-onset MOSIs) during the follow-up period, divided it by the sum of follow-up time for all patients being followed up (until either development of MOSIs or last follow-up without MOSIs), and multiplied the result by 1,000. The resulting incidence rates express number of patients with new onset of MOSIs per 1,000 person-years of observation. We calculated and plotted survival curves with use of Kaplan–Meier survival analyses.24 All the above was done for MOSIs overall as well as for each MOSI domain. We used the dichotomous forms of the MOSI variables for these analyses.
Because of the clustered nature of the data and to make better use of the full range of the MOSI scores and characterize the rates of change of the MOSI scores, we also used generalized estimating equations (GEEs)25 to investigate potential predictors of MOSI. GEEs take into account the multiple visits per subject and the fact that the characteristics of the same individual over time (his/her MOSI score for this analysis) are likely to be correlated. The repeated measures for each subject are treated as a cluster. Total MOSI score (in its continuous form) was the dependent variable in this model. The model initially considered the effect of time for every MOSI evaluation (in years since the initial evaluation). A significant time effect indicates a marked change in MOSI scores over time. In a subsequent model, we simultaneously included the following predictors: time, age at intake in the study, sex, education in years, APOE genotype, mMMS score at initial evaluation, BDRS score at initial evaluation, and MOSI score at initial evaluation. A significant time effect in this model indicates a marked change in MOSI scores over time, controlling for the other predictors in the model. Similar GEE models were built for each MOSI domain.
Subsequently, we investigated potential predictors of incident MOSI. First, we used Cox proportional hazards analyses26 with total MOSIs (dichotomous form) as the outcome and duration (in years) between the initial visit and either development of MOSIs or last evaluation without MOSIs as the timing variable. Patients with MOSIs at first evaluation were not included in the Cox analyses. The following predictors were simultaneously included in the model: age at intake in the study, sex, education in years, APOE genotype, recruitment center (as a dummy variable), mMMSE score at initial evaluation, and BDRS score at initial evaluation. To identify potential predictors of individual MOSI domains, we calculated similar Cox models with each MOSI domain as the outcome.
Results
Overall, 474 subjects with AD, followed for up to 13.11 years, were included in the study. Basic demographic and clinical information are presented in table 1. There were 3,030 visits/assessments of MOSIs (up to 26/patient, with average 6.4/patient). During the period each subject was followed, missed visits were rare: Less than 18% missed more than one semiannual visit, and <9% missed more than two. Rates of missing individual MOSI items (when MOSI scale was administered) ranged between 0.7 and 4.5%.
Table 1. Demographic and clinical characteristics of patients.
| Age at study entry, mean (SD), y | 74.1 (8.8) |
| Men/women, n (%) | 191 (40)/281 (60) |
| Education, mean (SD), y | 13.3 (3.8) |
| No ε4 alleles/one or two ε4 alleles, n (%) | 95 (44)/119 (56) |
| Recruitment center | |
| New York, n (%) | 178 (38) |
| Baltimore, n (%) | 124 (26) |
| Boston, n (%) | 114 (23) |
| Paris, n (%) | 37 (8) |
| Larissa, n (%) | 21 (5) |
| mMMS at study entry, mean (SD) | 39.4 (6.2) |
| BDRS at study entry, mean (SD) | 3.5 (2.0) |
| Dead during follow-up, n (%) | 226 (48) |
| Duration of follow-up, mean (SD), y | 3.6 (3.1) |
mMMS = Modified Mini-Mental State; BDRS = Blessed Dementia Rating Scale.
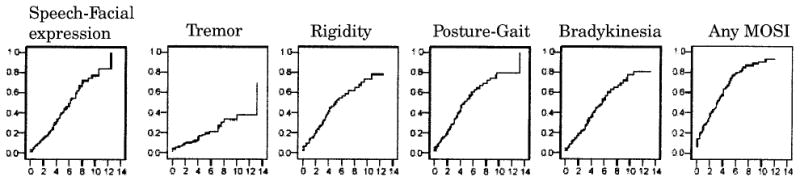
Prevalences of MOSIs (dichotomous, present vs absent) at first, last, and any evaluation and incidence rates are presented in table 2, and cumulative risk curves are plotted in figure 1. Frequencies of all MOSI domains increase as disease chronicity increases (more frequent last as compared with first evaluation). More specifically, the prevalence of any MOSI per year of follow-up was as follows: 1st year 18%, 2nd year 19%, 3rd year 25%, 4th year 33%, 5th year 46%, 6th year 41%, 7th year 39%, 8th year 47%, 9th year 90%, 10th year 67%, 11th year 62%, 12th year 64%, 13th year 71%. All MOSI domains occurred with roughly the same frequency (3 to 6% at first evaluation and 7 to 24% at last evaluation), with the exception of resting tremor, which was clearly less frequent at last evaluation (7%). Incidence rates were of roughly the same magnitude for speech/facial expression, rigidity, posture/gait, and bradykinesia (82 to 111 new cases with the above symptoms per 1,000 person-years of follow-up) and lower for tremor (29 new cases per 1,000 person-years of follow-up). This is graphically represented in the cumulative risk curves that indicate that there is a gradual increase in the probability of having MOSIs as the disease progresses. The slope of the curve is less steep for resting tremor.
Table 2. Prevalence for baseline, last, and any evaluation and incidence rates of each MOSI domain and of overall MOSIs.
| Baseline evaluation, n (%) | Last evaluation, n (%) | Any evaluation, n (%) | Incidence rate during follow-up, per 1,000 person-y | |
|---|---|---|---|---|
| Speech/facial expression | 16 (3) | 92 (20) | 102 (22) | 82 |
| Tremor | 17 (4) | 34 (7) | 51 (11) | 29 |
| Rigidity | 28 (6) | 86 (18) | 122 (26) | 95 |
| Posture/gait | 26 (6) | 112 (24) | 133 (29) | 111 |
| Bradykinesia | 19 (4) | 95 (20) | 113 (24) | 94 |
| Any MOSI | 62 (13) | 167 (36) | 207 (44) | 172 |
MOSI = motor sign.
Figure 1. Cumulative risk (1 – cumulative survival) curves of developing individual domain motor signs (MOSIs) and any MOSIs y-axes. The time axes (x) show years from first evaluation until development of signs (or last evaluation).
If all patients, including those whose MOSIs could be possibly drug induced, were included, the corresponding frequencies of any MOSIs are even higher: baseline evaluation 64 (14%), last evaluation 204 (43%), any evaluation 249 (53%). It is possible that motoric abnormalities in patients taking MOSI-inducing medication are not completely caused by medications but are also partially accounted for by AD-related enhanced sensitivity to neuroleptics. However, because it is not possible to separate the relative contribution of these two factors and to increase our confidence that the occurrence of MOSIs in the current study is strictly related to the underlying disease process, we analyze only non-drug-induced MOSIs.
The GEE models can better assess changes over time and assign significance, adjusting for covariates. In the initial GEE model, there was an increase of all MOSIs (continuous score) over time (β = 1.31, p < 0.0001). This corresponds to 1.34 units of higher MOSI score per year of follow-up. Taking into account that total MOSI score ranges from 0 to 44, this corresponds to 3% of the total possible score. In the adjusted GEE model, when simultaneously controlling for age, sex, education, APOE, baseline mMMS, baseline BDRS, and baseline MOSI score, there was still an increase of MOSI score over time, which was of similar magnitude (β = 1.32, p < 0.0001).
In the unadjusted models, there was an increase of speech/facial expression (β = 0.31, p < 0.0001), rigidity (β = 0.53, p < 0.0001), posture/gait (β = 0.30, p < 0.0001), and bradykinesia (β = 0.15, p < 0.0001) scores over time, whereas the increase was considerably smaller for tremor (β = 0.02, p = 0.02). In the models adjusted for age, sex, education, APOE, baseline mMMS, baseline BDRS, and baseline MOSI domain score, the results were similar: increased speech/facial expression (β = 0.33, p < 0.0001), rigidity (β = 0.49, p < 0.0001), posture/gait (β = 0.31, p < 0.0001), bradykinesia (β = 0.15, p < 0.0001), and tremor (β = 0.03, p = 0.01) scores over time. Taking into account the range of each domain score, the reported β coefficients of annual change correspond to the following percentages of the total possible score: speech/facial expression 4%, rigidity 2.45%, posture/gait 3.90%, bradykinesia 3.75%, and tremor 0.75%. Figure 2 gives a graphic representation of the GEE results by plotting mean scores for each MOSI domain and total MOSIs for each year of follow-up. It is evident that, with the exception of tremor, which increases only slightly, all MOSI domain scores increase considerably over time.
Figure 2. Mean scores for individual motor sign (MOSI) domains and total MOSIs (y axes) over the course of follow-up in years (x axes). Regression lines are derived from the generalized estimating equation models.

In a Cox model that examined the incidence of any MOSI, while simultaneously considering age, sex, education, recruitment center, APOE, baseline mMMS, and baseline BDRS, there was a significant APOE effect (risk ratio [RR] 0.43, 95% CI 0.28 to 0.67) and baseline mMMS effect (RR 0.93, 95% CI 0.89 to 0.97) (table 3). Therefore, ε4 carriers and AD patients with higher baseline mMMS scores were less likely to develop MOSIs. In terms of individual MOSIs, women were less likely (or equivalently men were more likely) to develop speech/facial expression abnormalities. Subjects with higher mMMS at baseline were less likely to develop all MOSI domains, and subjects with lower BDRS (better functional status) were less likely to develop bradykinesia. The ε4 carriers were less likely to develop all MOSI domains. Of note, there were no differences between the two APOE groups for gender (χ2 = 0.57, p = 0.45), education (t = −0.93, p = 0.36), baseline mMMS scores (t = −0.80, p = 0.43), or baseline BDRS scores (t = 1.75, p = 0.08). In addition, mean age for ε4 carriers was 71.5 (SD 6.89) years and for non-ε4 carriers 71.9 (SD 9.38) years (t = 0.33, p = 0.74). Despite some random fluctuations for individual extrapyramidal signs, the RRs of the five recruitment centers for the any MOSI category ranged between 0.92 and 1.42. Overall, there were no significant recruitment center effects for any of the MOSI domains.
Table 3. Cox models predicting occurrence of individual MOSI domains and any MOSI overall.
| Parameter | Speech/facial expression | Tremor | Rigidity | Posture/gait | Bradykinesia | Any MOSI |
|---|---|---|---|---|---|---|
| Baltimore | 1.33 (0.69–2.58) | 0.78 (0.28–2.16) | 1.51 (0.82–2.80) | 1.13 (0.61–2.11) | 1.29 (0.69–3.39) | 1.42 (0.86–2.34) |
| Boston | 0.80 (0.32–1.99) | 0.63 (0.18–2.23) | 1.17 (0.55–2.49) | 0.73 (0.34–1.57) | 0.78 (0.34–1.77) | 0.92 (0.51–1.68) |
| Paris | 0.66 (0.08–5.44) | 0.73 (0.08–6.57) | 2.05 (0.68–6.16) | 1.46 (0.53–4.04) | 1.68 (0.50–5.58) | 1.15 (0.49–2.70) |
| Larissa | 1.68 (0.47–6.07) | 1.98 (0.48–8.11) | 0.96 (0.26–3.62) | 1.60 (0.41–6.24) | 0.98 (0.20–4.58) | 1.31 (0.52–3.30) |
| Females | 0.48* (0.26–0.88) | 0.54 (0.23–1.27) | 0.78 (0.45–1.34) | 1.14 (0.66–1.96) | 1.05 (0.61–1.82) | 0.81 (0.53–1.24) |
| Age | 0.98 (0.95–1.02) | 1.01 (0.96–1.06) | 0.98 (0.95–1.01) | 1.01 (0.98–1.05) | 1.00 (0.97–1.04) | 1.01 (0.99–1.04) |
| Education | 1.00 (0.92–1.08) | 0.92 (0.82–1.02) | 1.04 (0.97–1.11) | 1.03 (0.96–1.10) | 1.04 (0.97–1.12) | 1.01 (0.96–1.07) |
| ε4 carriers | 0.50* (0.27–0.90) | 0.24* (0.10–0.61) | 0.37* (0.22–0.63) | 0.49* (0.28–0.83) | 0.43* (0.25–0.74) | 0.43* (0.28–0.67) |
| mMMS at baseline | 0.87* (0.82–0.93) | 0.88* (0.81–0.96) | 0.91* (0.86–0.96) | 0.95* (0.90–1.00) | 0.94* (0.89–1.00) | 0.93* (0.89–0.97) |
| BDRS at baseline | 1.03 (0.56–1.24) | 0.81 (0.62–1.05) | 1.11 (0.95–1.29) | 1.11 (0.95–1.29) | 1.20* (1.02–1.41) | 1.01 (0.89–1.13) |
Risk ratios (95% CI) are tabulated. Recruitment center risks have been calculated with the New York center as the reference.
Significant (95% CI not including 1) association.
MOSI = motor sign; mMMS = Modified Mini-Mental State; BDRS = Blessed Dementia Rating Scale.
Overall, 99 patients came to autopsy examination, 93% of which had AD-type pathologic changes (87% received the pathologic diagnosis of AD and 6% had senile changes of the Alzheimer type). Dementia with Lewy bodies was diagnosed in 22% (coexisting with AD-type changes in all but 1 patient). Diagnosis of dementia with Lewy bodies was present in 27% of autopsied patients with resting tremor at any evaluation and in 19% of those who never had resting tremor (χ2 = 0.43, p = 0.51). Dementia with Lewy bodies was diagnosed in 24% of patients who had MOSIs at any point of their evaluation and in 13% of patients who never manifested MOSIs (χ2 = 1.62, p = 0.20). Mean MOSI score (across all evaluations) was 6.6 for patients with and 4.7 for patients without diagnosis of dementia with Lewy bodies at autopsy (t = −1.14, p = 0.26).
Discussion
In this cohort of early AD patients, not all MOSIs behaved similarly during the course of illness. Frequencies for speech/facial expression, rigidity, posture/gait, and bradykinesia as well as incidence rates were very similar to each other. Resting tremor was the least frequent MOSI, which is in accordance with other studies.5,6,12,27 Frequency of all MOSIs was relatively uncommon at initial evaluation, but their prevalence increased as disease progressed, again consistent with previous reports.5,6,12,13 This was true for all domains but in particular for speech/facial expression, rigidity, posture/gait, and bradykinesia. Although tremor frequencies increased too, the incidence rate for tremor was the lowest.
Few studies attempted to precisely characterize patterns of progression of motoric signs in AD. According to a previous study that addressed this issue, an AD patient's overall level of parkinsonism at one point in time was not a good predictor of that person's trajectory of change or a very good measure of that person's cumulative burden of parkinsonism during the follow-up observation period.13 Therefore, differences between reported rates in previous studies may derive from each study using MOSI measures cross-sectionally assessed at single points in time.
We attempted to address this issue by calculating rates of MOSI change over time. Our data suggest that all MOSIs do not behave similarly. The annual increase in scores (of the total possible score) for speech/facial expression, rigidity, posture/gait, and bradykinesia ranged between 2.45 and 4%, whereas the corresponding number for tremor was much smaller (0.75%). These estimates were almost unchanged even with the inclusion of various covariates in the GEE models, including baseline MOSI values. The calculated rates are somehow smaller but quite close to previously reported ones.13 As a perspective for our results, in a large community-dwelling cohort of Parkinson disease patients, annual increases for bradykinesia, gait/balance, and rigidity ranged from 2 to 3.1%, but tremor did not change.28 Annual increase of the total MOSI score was 1.5% in that study as compared with 3% in the current one. However, direct comparison of these two rates is confounded by use of part of the UPDRS in our cohort, different baseline levels of MOSIs, and treatment with dopaminergic agents.
We investigated whether incidence of MOSIs differed by recruitment center by including it as a predictor in the analyses. The ethnic distribution of the patients enrolled in the Predictors Study was heavily weighted toward Caucasians (93%) with very few African Americans (4.8%) or Hispanics (2.7%). Therefore, we could address only the hypothesis that development of MOSIs is different among different Caucasian populations. Our results suggest no difference among Caucasian populations in terms of MOSI occurrence. This was true for all MOSI domains and for any MOSI overall. This would suggest that differences in reported frequencies among previous studies12 are not a function of different populations but of other methodologic differences.
Carrying the ε4 allele was associated with decreased risk for development of all MOSI domains. We had previously published this association between the APOE genotype and MOSIs in a subset of this cohort (99 patients).29 We now confirm this finding using a population that is much larger and further note that the association holds for all types of MOSIs. The presence of the ε4 allele has been associated with earlier age at disease onset, but whether it is related to different AD clinical and phenotypic subtypes is debatable because it may have a different effect on the processes that determine rates of progression. The APOE-related clinical heterogeneity30 may relate to underlying pathologic heterogeneity. Previous studies have indicated that frequency of the ε4 allele is significantly increased in AD with Lewy bodies but not in pure Lewy body disease (without concomitant AD changes)31 and that the ε4 allele is associated with higher neurofibrillary tangle32 and neuritic plaque33 burden in patients with both AD-type and Lewy body-type pathology. Consequently, presence of the ε4 allele may indicate mainly the AD type of underlying pathology, whereas patients without the ε4 allele may have a relatively higher contribution of Lewy body pathology to their clinical status. Therefore, AD patients carrying the ε4 allele may have lower risk for development of MOSIs because of the lower burden of concomitant Lewy body pathology.
We found that lower baseline cognitive performance was associated with higher risk for all MOSIs and lower baseline functional performance with higher risk for bradykinesia. This is not unexpected as baseline cognitive and functional scores may be a reflection of disease stage at study entry and therefore may be surrogates for disease severity (which is known to be associated with MOSIs in AD).6,12,13 Finally, as compared with men, women were at lower risk for developing speech/facial expression abnormalities and resting tremor. The importance of this finding is unclear as it was present for only two MOSI domains and has not been reported by previous studies.
Although there was a trend, no significant association was detected between MOSI and the diagnosis of dementia with Lewy bodies for the autopsied cases. There was a stronger (but still not significant) trend for the presence of dementia with Lewy bodies at autopsy for patients who had resting tremor. Still, diagnosis of dementia with Lewy bodies was not present for 73% of patients with resting tremor and for 76% of patients with MOSIs during any evaluation. The underlying pathologic substrate of MOSIs in AD is not clear. Lewy body changes are reported in 18 to 55% of AD patients.12,34-36 Although some studies have reported that AD patients with Lewy bodies at autopsy (as compared with those without) manifest more MOSIs during life,37,38 at least three clinicopathologic studies, including one from this cohort, found no associations between Lewy bodies and clinical MOSIs.39-41 In addition, it is known that AD patients without Lewy bodies may manifest MOSIs.42,43 Explanations other than Lewy bodies for the presence of MOSIs in AD include extranigral lesions involving mesocortical dopaminergic pathways,44 loss of striatal dopamine transporter sites,45 and reduced dopaminergic D2 receptors in the putamen.46 There are also studies that suggest that the dopaminergic system may not be involved in the MOSIs noted in AD.5,47 Alternatively, the dopaminergic system may be involved but via AD pathology itself. Senile plaques have been reported in the putamen, caudate, and substantia nigra,48 and neurofibrillary tangles have been noted in the substantia nigra.49 In a previous clinicopathologic study that involved some of the subjects from this cohort, we reported an association between MOSIs and nigral tangle pathology, in the absence of Lewy bodies.49 Finally, it is also possible that lesions outside the extrapyramidal system may be responsible for the MOSIs of the patients.
This study has limitations. First, we did not administer the full UPDRS, which may have restricted the full range of impairment in particular for appendicular bradykinesia. However, the items were selected on the basis of earlier characterization of MOSIs in AD. Second, assessment of MOSIs is often difficult and rater related. It is also very difficult to distinguish subtleties of various aspects of the motoric examination (such as different types of tone, velocity of movements, and gait abnormalities). However, we did not rely on clinical assessments but instead used a scale that has been shown to have good reliability properties and yields high rates of agreements across interviewers. Also, the examinations were performed mainly by experienced neurologists at large academic centers who were instructed to rate the “parkinsonian” aspect of motor abnormalities in AD patients. Still, it is possible that we had not been able to accurately distinguish between the various qualitative types of motoric disturbances. Third, the long duration of follow-up (although it may provide the advantage of more accurate recording of disease course) results in use of multiple different raters of MOSIs over time, which increases the variability of ratings of MOSIs. Fourth, AD patients were selected from tertiary care university hospitals and specialized diagnostic and treatment centers and therefore represent a nonrandom sample of those affected by AD in the population. In addition, the proportion of African Americans and Hispanics in our sample was very small. Therefore, our results cannot be generalized for population-based AD or for all ethnicities. Fifth, although we used survival analyses, which take advantage of variable follow-up times, a longer duration of follow-up may have provided a more complete conclusion about the fraction of AD patients that remain MOSI-free during the whole course of their disease.
Confidence in our findings is strengthened by several factors. To our knowledge, this is the largest study of its kind examining the issue of motoric abnormalities in AD supplying enough power for detection and more precise calculation of effects of interest and the ability to control for potential confounders. A major contribution of the current analyses lies in the careful diagnosis and clinical follow-up that patients received. Clinical diagnosis was based on uniform application of widely accepted criteria via a consensus diagnostic conference procedure. The clinical diagnosis of AD was confirmed in a high proportion of those who came to postmortem evaluation: Ninety-three percent of autopsied patients had AD-type pathologic changes. The patients were studied prospectively, which eliminates the potential biases inherent in deriving information from retrospective chart reviews. Evaluations were performed semiannually, which provides multiple assessments of MOSIs and therefore permits more accurate slope calculations. Our cohort had very high rate of follow-up participation with very few missing data. Clinical signs of interest were ascertained and coded in a standardized fashion at each visit. Most previous reports usually studied more impaired AD patients, capturing the part of the disease course corresponding to more advanced stages. Baseline mMMS score for this cohort was 39.4 (and always ≥30), corresponding to a Folstein MMSE score of 21; therefore, early AD patients were included so that the cohort describes the full range of progression over time. Patients were drawn from multiple locations, which increases generalizability of the findings. Reported frequencies of MOSIs and reported associations between MOSIs and other variables in many previous studies are confounded by not taking into account use of medications that may produce MOSIs. We excluded patient evaluations with medications that could produce parkinsonism, which provides higher confidence that the occurrence of MOSIs in the current study is strictly related to the underlying disease process.
These data provide a basis for expanding our understanding of the natural history of AD. MOSIs are quite common and become more prominent as the disease progresses. They also seem to occur universally, at least among Caucasian populations. However, not all MOSIs behave similarly. Tremor is the least frequent and seems to be relatively independent of disease progression. We found that ε4 carriers are at lower risk of developing MOSIs during the course of AD, an association that has not been explored by other studies and warrants further investigation. Knowledge of the natural course of MOSIs in AD is important, given their predictive ability for rates of cognitive decline and mortality and their association with increased cost of care. The underlying pathophysiologic substrate of their association with the APOE genotype and of their occurrence in general remains to be explored.
Acknowledgments
Supported by federal grants AG07370 and RR00645 and the Taub Institute for Research in Alzheimer's Disease and the Aging Brain.
References
- 1.Miller TP, Tinklenberg JR, Brooks JO, 3rd, Yesavage JA. Cognitive decline in patients with Alzheimer disease: differences in patients with and without extrapyramidal signs. Alzheimer Dis. 1991;5:251–256. doi: 10.1097/00002093-199100540-00004. [DOI] [PubMed] [Google Scholar]
- 2.Kraemer HC, Tinklenberg J, Yesavage JA. “How far” vs “how fast” in Alzheimer's disease. The question revisited Arch Neurol. 1994;51:275–279. doi: 10.1001/archneur.1994.00540150069019. [DOI] [PubMed] [Google Scholar]
- 3.Chui HC, Lyness SA, Sobel E, Schneider LS. Extrapyramidal signs and psychiatric symptoms predict faster cognitive decline in Alzheimer's disease. Arch Neurol. 1994;51:676–681. doi: 10.1001/archneur.1994.00540190056015. [DOI] [PubMed] [Google Scholar]
- 4.Drachman DA, O'Donnell BF, Lew RA, Swearer JM. The prognosis in Alzheimer's disease. “How far” rather than “how fast” best predicts the course. Arch Neurol. 1990;47:851–856. doi: 10.1001/archneur.1990.00530080033007. [DOI] [PubMed] [Google Scholar]
- 5.Soininen H, Laulumaa V, Helkala EL, Hartikainen P, Riekkinen PJ. Extrapyramidal signs in Alzheimer's disease: a 3-year follow-up study. J Neural Transm. 1992;4:107–119. doi: 10.1007/BF02251474. [DOI] [PubMed] [Google Scholar]
- 6.Lopez OL, Wisnieski SR, Becker JT, Boller F, DeKosky ST. Extrapyramidal signs in patients with probable Alzheimer disease. Arch Neurol. 1997;54:969–975. doi: 10.1001/archneur.1997.00550200033007. [DOI] [PubMed] [Google Scholar]
- 7.Burns A, Jacoby R, Levy R. Neurological signs in Alzheimer's disease. Age Ageing. 1991;20:45–51. doi: 10.1093/ageing/20.1.45. [DOI] [PubMed] [Google Scholar]
- 8.Samson WN, van Duijn CM, Hop WC, Hofman A. Clinical features and mortality in patients with early-onset Alzheimer's disease. Eur Neurol. 1996;36:103–106. doi: 10.1159/000117218. [DOI] [PubMed] [Google Scholar]
- 9.Van Dijk PT, Dippel DW, Van Der Meulen JH, Habbema JD. Comorbidity and its effect on mortality in nursing home patients with dementia. J Nerv Ment Dis. 1996;184:180–187. doi: 10.1097/00005053-199603000-00007. [DOI] [PubMed] [Google Scholar]
- 10.Mitchell SL, Rockwood K. The association between parkinsonism, Alzheimer's disease, and mortality: a comprehensive approach. J Am Geriatr Soc. 2000;48:422–425. doi: 10.1111/j.1532-5415.2000.tb04701.x. [DOI] [PubMed] [Google Scholar]
- 11.Murman DL, Kuo SB, Powell MC, Colenda CC. The impact of parkinsonism on costs of care in patients with AD and dementia with Lewy bodies. Neurology. 2003;61:944–949. doi: 10.1212/wnl.61.7.944. [DOI] [PubMed] [Google Scholar]
- 12.Ellis RJ, Caligiuri M, Galasko D, Thal LJ. Extrapyramidal motor signs in clinically diagnosed Alzheimer disease. Alzheimer Dis. 1996;10:103–114. doi: 10.1097/00002093-199601020-00008. [DOI] [PubMed] [Google Scholar]
- 13.Wilson RS, Bennett DA, Gilley DW, Beckett LA, Schneider JA, Evans DA. Progression of parkinsonian signs in Alzheimer's disease. Neurology. 2000;54:1284–1289. doi: 10.1212/wnl.54.6.1284. [DOI] [PubMed] [Google Scholar]
- 14.Stern Y, Folstein M, Albert M, et al. Multicenter study of predictors of disease course in Alzheimer disease (the “Predictors Study”). I. Study design, cohort description, and intersite comparisons. Alzheimer Dis. 1993;7:3–21. doi: 10.1097/00002093-199307010-00002. [DOI] [PubMed] [Google Scholar]
- 15.Folstein MF, Folstein SE, McHugh PR. “Mini-Mental State”. A practical method for grading the cognitive state of patients for the clinician. J Psychiatr Res. 1975;12:189–198. doi: 10.1016/0022-3956(75)90026-6. [DOI] [PubMed] [Google Scholar]
- 16.Stern Y, Sano M, Paulson J, Mayeux R. Modified Mini-Mental State Examination: validity and reliability. Neurology. 1987;37(suppl 1):179. [Google Scholar]
- 17.Hixson JE. Apolipoprotein E polymorphisms affect atherosclerosis in young males. Pathobiological Determinants of Atherosclerosis in Youth (PDAY) Research Group. Arterioscler Thromb. 1991;11:1237–1244. doi: 10.1161/01.atv.11.5.1237. [DOI] [PubMed] [Google Scholar]
- 18.Mayeux R, Stern Y, Rosen J, Leventhal J. Depression, intellectual impairment, and Parkinson disease. Neurology. 1981;31:645–650. doi: 10.1212/wnl.31.6.645. [DOI] [PubMed] [Google Scholar]
- 19.Wechsler D. Wechsler Adult Intelligence Scale Revised. New York: Psychological Corp.; 1981. [Google Scholar]
- 20.Kaplan E, Goodglass H, Weintraub S. Boston Naming Test. Philadelphia: Lea&Febiger; 1983. [Google Scholar]
- 21.Blessed G, Tomlinson BE, Roth M. The association between quantitative measures of dementia and of senile change in the cerebral grey matter of elderly subjects. Br J Psychiatry. 1968;114:797–811. doi: 10.1192/bjp.114.512.797. [DOI] [PubMed] [Google Scholar]
- 22.Richards M, Marder K, Bell K, Dooneief G, Mayeux R, Stern Y. Inter-rater reliability of extrapyramidal signs in a group assessed for dementia. Arch Neurol. 1991;48:1147–1149. doi: 10.1001/archneur.1991.00530230055021. [DOI] [PubMed] [Google Scholar]
- 23.Bennett DA, Shannon KM, Beckett LA, Goetz CG, Wilson RS. Metric properties of nurses' ratings of parkinsonian signs with a modified Unified Parkinson's Disease Rating Scale. Neurology. 1997;49:1580–1587. doi: 10.1212/wnl.49.6.1580. [DOI] [PubMed] [Google Scholar]
- 24.Kaplan E, Meier P. Nonparametric estimation from incomplete observations. J Am Stat Assoc. 1958;53:457–481. [Google Scholar]
- 25.Liang KY, Zeger SL. Longitudinal data analysis using generalized linear models. Biometrica. 1986;73:13–22. [Google Scholar]
- 26.Lawless J. Statistical model and methods for lifetime data. New York: Wiley; 1982. [Google Scholar]
- 27.Chen JY, Stern Y, Sano M, Mayeux R. Cumulative risks of developing extrapyramidal signs, psychosis, or myoclonus in the course of Alzheimer's disease. Arch Neurol. 1991;48:1141–1143. doi: 10.1001/archneur.1991.00530230049020. [DOI] [PubMed] [Google Scholar]
- 28.Louis ED, Tang MX, Cote L, Alfaro B, Mejia H, Marder K. Progression of parkinsonian signs in Parkinson disease. Arch Neurol. 1999;56:334–337. doi: 10.1001/archneur.56.3.334. [DOI] [PubMed] [Google Scholar]
- 29.Stern Y, Brandt J, Albert M, et al. The absence of an apolipoprotein epsilon 4 allele is associated with a more aggressive form of Alzheimer's disease. Ann Neurol. 1997;41:615–620. doi: 10.1002/ana.410410510. [DOI] [PubMed] [Google Scholar]
- 30.Scarmeas N, Brandt J, Albert M, et al. Association between the APOE genotype and psychopathologic symptoms in Alzheimer's disease. Neurology. 2002;58:1182–1188. doi: 10.1212/wnl.58.8.1182. [DOI] [PMC free article] [PubMed] [Google Scholar]
- 31.Nielsen AS, Ravid R, Kamphorst W, Jorgensen OS. Apolipoprotein E epsilon 4 in an autopsy series of various dementing disorders. J Alzheimers Dis. 2003;5:119–125. doi: 10.3233/jad-2003-5206. [DOI] [PubMed] [Google Scholar]
- 32.Hansen LA, Galasko D, Samuel W, Xia Y, Chen X, Saitoh T. Apolipoprotein-E epsilon-4 is associated with increased neurofibrillary pathology in the Lewy body variant of Alzheimer's disease. Neurosci Lett. 1994;182:63–65. doi: 10.1016/0304-3940(94)90206-2. [DOI] [PubMed] [Google Scholar]
- 33.Olichney JM, Hansen LA, Galasko D, et al. The apolipoprotein E epsilon 4 allele is associated with increased neuritic plaques and cerebral amyloid angiopathy in Alzheimer's disease and Lewy body variant. Neurology. 1996;47:190–196. doi: 10.1212/wnl.47.1.190. [DOI] [PubMed] [Google Scholar]
- 34.Ditter SM, Mirra SS. Neuropathologic and clinical features of Parkinson's disease in Alzheimer's disease patients. Neurology. 1987;37:754–760. doi: 10.1212/wnl.37.5.754. [DOI] [PubMed] [Google Scholar]
- 35.Joachim CL, Morris JH, Selkoe DJ. Clinically diagnosed Alzheimer's disease: autopsy results in 150 cases. Ann Neurol. 1988;24:50–56. doi: 10.1002/ana.410240110. [DOI] [PubMed] [Google Scholar]
- 36.Haan MN, Jagust WJ, Galasko D, Kaye J. Effect of extrapyramidal signs and Lewy bodies on survival in patients with Alzheimer disease. Arch Neurol. 2002;59:588–593. doi: 10.1001/archneur.59.4.588. [DOI] [PubMed] [Google Scholar]
- 37.Olichney JM, Galasko D, Salmon DP, et al. Cognitive decline is faster in Lewy body variant than in Alzheimer's disease. Neurology. 1998;51:351–357. doi: 10.1212/wnl.51.2.351. [DOI] [PubMed] [Google Scholar]
- 38.Heyman A, Fillenbaum GG, Gearing M, et al. Comparison of Lewy body variant of Alzheimer's disease with pure Alzheimer's disease: Consortium to Establish a Registry for Alzheimer's Disease, Part XIX. Neurology. 1999;52:1839–1844. doi: 10.1212/wnl.52.9.1839. [DOI] [PubMed] [Google Scholar]
- 39.McKeith IG, Perry RH, Fairbairn AF, Jabeen S, Perry EK. Operational criteria for senile dementia of Lewy body type (SDLT) Psychol Med. 1992;22:911–922. doi: 10.1017/s0033291700038484. [DOI] [PubMed] [Google Scholar]
- 40.Weiner MF, Risser RC, Cullum CM, et al. Alzheimer's disease and its Lewy body variant: a clinical analysis of postmortem verified cases. Am J Psychiatry. 1996;153:1269–1273. doi: 10.1176/ajp.153.10.1269. [DOI] [PubMed] [Google Scholar]
- 41.Stern Y, Jacobs D, Goldman J, et al. An investigation of clinical correlates of Lewy bodies in autopsy-proven Alzheimer disease. Arch Neurol. 2001;58:460–465. doi: 10.1001/archneur.58.3.460. [DOI] [PubMed] [Google Scholar]
- 42.Reinikainen KJ, Paljarvi L, Halonen T, et al. Dopaminergic system and monoamine oxidase-B activity in Alzheimer's disease. Neurobiol Aging. 1988;9:245–252. doi: 10.1016/s0197-4580(88)80061-7. [DOI] [PubMed] [Google Scholar]
- 43.Snowden MB, Bowen JD, Hughes J, Larson EB. Study of Alzheimer's dementia patients with parkinsonian features. J Geriatr Psychiatry Neurol. 1995;8:154–158. doi: 10.1177/089198879500800302. [DOI] [PubMed] [Google Scholar]
- 44.Morris JC, Drazner M, Fulling K, Grant EA, Goldring J. Clinical and pathological aspects of parkinsonism in Alzheimer's disease. A role for extranigral factors? Arch Neurol. 1989;46:651–657. doi: 10.1001/archneur.1989.00520420071025. [DOI] [PubMed] [Google Scholar]
- 45.Murray AM, Weihmueller FB, Marshall JF, Hurtig HI, Gottleib GL, Joyce JN. Damage to dopamine systems differs between Parkinson's disease and Alzheimer's disease with parkinsonism. Ann Neurol. 1995;37:300–312. doi: 10.1002/ana.410370306. [DOI] [PubMed] [Google Scholar]
- 46.Cross AJ, Crow TJ, Ferrier IN, Johnson JA, Markakis D. Striatal dopamine receptors in Alzheimer-type dementia. Neurosci Lett. 1984;52:1–6. doi: 10.1016/0304-3940(84)90341-0. [DOI] [PubMed] [Google Scholar]
- 47.Tyrrell PJ, Sawle GV, Ibanez V, et al. Clinical and positron emission tomographic studies in the “extrapyramidal syndrome” of dementia of the Alzheimer type. Arch Neurol. 1990;47:1318–1323. doi: 10.1001/archneur.1990.00530120062011. [DOI] [PubMed] [Google Scholar]
- 48.Rothschild D, Kasanin J. Clinicopathologic study of Alzheimer's disease. Arch Neurol Psychiatry. 1936;36:293–321. [Google Scholar]
- 49.Liu Y, Stern Y, Chun MR, Jacobs DM, Yau P, Goldman JE. Pathological correlates of extrapyramidal signs in Alzheimer's disease. Ann Neurol. 1997;41:368–374. doi: 10.1002/ana.410410312. [DOI] [PubMed] [Google Scholar]