Abstract
Pollen grains and subpollen particles contain NAD(P)H oxidases and shown to induce oxidative stress in the airway epithelium; however, the role of mitochondrial dysfunction induced by them has not been investigated on airway inflammation. Our results show that exposure of airway epithelial cells to ragweed pollen extract (RWE) induced oxidative modifications to NADH dehydrogenase (ubiquinone) Fe-S protein (NDUFS) 1 and NDUFS2 in mitochondrial respiratory complex I, as well as ubiquinol-cytochrome c reductase core protein I (UQCRC1) and II (UQCRC2) in complex III. Respiratory chain-associated proteins, the 75-kDa glucose-regulated protein, heat shock protein 70, heat shock protein 60, citrate synthase and voltage-dependent anion selective channel 1 were also damaged. Exposure of cells to RWE induced mitochondrial dysfunction as shown by increased H2O2 release from respiratory chain complex III. Mitochondrial dysfunction induced by antisense oligonucleotides to UQCRC2 increased mitochondrial ROS generation in lung epithelial cells. Most importantly, mitochondrial dysfunction in airway epithelium of sensitized Balb/c mice prior the RWE challenge increases the RWE-induced accumulation of eosinophils, mucin levels in the airways and bronchial hyperresponsiveness. A decrease in UQCRC1 expression did not significantly alter cellular ROS levels and parameters of airway inflammation. Based on these observations preexisting mitochondrial dysfunction induced by oxidant environmental pollutants and/or pollen grains exacerbate antigen-driven allergic airway inflammation. These data also imply that mitochondrial defect could be a risk factor and may be responsible for severe allergic disorders in atopic individuals.
Keywords: mitochondria, allergy, inflammation, lung
INTRODUCTION
It has been demonstrated that pollen grains and subpollen particles themselves generate reactive oxygen species (ROS)3 via their intrinsic NAD(P)H oxidases (1, 2). ROS generated by these pollen enzymes induce profound oxidative stress in the lungs within minutes after exposure (3). Inactivation of pollen NAD(P)H oxidases or elimination of oxygen radicals generated by them decreases the allergic inflammation in sensitized mice after pollen exposure (3, 4). Environmental factors including ozone, diesel exhaust particles, and tobacco smoke, as well as respiratory virus infections, which are known to increase the ROS production exacerbate allergic inflammation in asthma (5). Excessive levels of ROS can trigger signaling cascades and/or cause cellular damage through the oxidation of macromolecules, even in the mitochondria (6, 7). Indeed, it has been shown that ozone exposure, tobacco smoke and other environmental oxidant pollutants, induce oxidative damage to mitochondria in the airways (8–10). Based on these observations and the exclusively maternal transmission of mitochondria in humans (11), as well as a predominant maternal influence on atopy and asthma susceptibility, we proposed that oxidative damage-caused mitochondrial dysfunction contributes to underlying molecular processes in the development of allergic airway inflammation. We tested this hypothesis in a mouse model allergic asthma.
Herein we demonstrate that exposure to ragweed pollen extract induces oxidative modification of mitochondrial respiratory chain complex I and complex III resulting in mitochondrial dysfunction. We have identified that oxidative damage primarily to ubiquinol-cytochrome c reductase core protein 2 (UQCRC2) elevates production of mitochondrial ROS. Importantly, alteration of UQCRC2 expression level prior to allergen exposure significantly enhances antigen-induced airway inflammation and bronchial hyperresponsiveness in experimental animals. These results suggest that preexisting mitochondrial dysfunction inflicted by environmental oxidant pollutants intensifies antigen-driven allergic airway inflammation and could be a risk factor for development of atopic allergic disorders in susceptible individuals.
MATERIALS AND METHODS
Cell cultures
Human alveolar epithelial cells (A549) and mouse lung adenoma cells (LA-4) were obtained from American Type Cell Collection (ATCC) and cultured in Ham’s F-12 medium supplemented with 10% (A549) or 15% (LA-4) heat-inactivated FBS, L-glutamine (2 mM), penicillin (100 U/ml), and streptomycin (100 μg/ml) at 37°C in a humidified atmosphere with 95% air and 5% CO2. Mitochondrial DNA-depleted cells (ρ0) were developed as we had previously described (12). Briefly, A549 cell cultures were maintained in complete growth medium supplemented with 50 ng/ml ethidium bromide for >60 population doublings. Respiration-deficient cells became pyrimidine auxotrophs, and hence medium was supplemented with uridine (50 μg/ml) and sodium pyruvate (120 μg/ml) (13). Depletion of mitochondrial DNA was confirmed by Southern blot hybridization as previously described (14).
Measurement of intracellular ROS levels
Cells in suspension were loaded with 5 μM 2’,7’-dihydro-dichlorofluorescein diacetate (H2DCF-DA) for 15 min at 37 °C. After removing excess H2DCF-DA, cells were treated with 100 μg/ml of RWE and the changes in DCF fluorescence were determined at different time points by flow cytometry (BD FACS CantoTM Flow Cytometer, Benton Dickinson, San Jose, CA). Each data point represents the mean fluorescence of 12,000 cells, from three or more independent experiments. Alternatively, in parallel experiments cells at 70% confluence were loaded with 50 μM H2DCF-DA on 24-well plates (Costar, Corning, NY). Changes in fluorescence intensity in mock-treated and RWE-treated cells were measured using an FLx800 Microplate Fluorescent Reader (Bio-Tek Instruments, Winooski, VE) at 488 nm excitation and 530 nm emission wavelengths.
Mitochondria isolation and purification
Mitochondria were isolated and purified as we had previously described (12, 15). Briefly, cell pellets were incubated in a hypotonic buffer A (220 mM mannitol, 70 mM sucrose, 2 mM MOPS and 1 mM EGTA, pH 7.4) containing protease inhibitor cocktail (catalog No. P8340, Sigma-Aldrich, St. Louis, MO). Cell suspensions kept in ice bath were sonicated with a Branson sonifier by 4 pulses of 20% power and cell homogenates were centrifuged for 10 min at 4700 × g. Mitochondria were sedimented from supernatants by centrifugation at 7168 × g. Pellets were resuspended in buffer B (220 mM mannitol, 70 mM sucrose, 2 mM MOPS, pH 7.4) and centrifuged at 9072 × g. Crude mitochondrial solutions were layered on discontinuous sucrose gradients (1.5, 1.0 and 0.5 M sucrose in 10 mM MOPS and 1 mM EDTA, pH 7.4) (16) and ultracentrifuged for 1.5 h at 82705 × g (SW28 rotor, Beckman Coulter, CA). All centrifugation procedures were carried out at 4°C. The band containing mitochondria was removed and washed in 10 times volume of buffer B. Mitochondrial pellets were resuspended in buffer B containing protease inhibitor cocktail (Sigma) and kept in −80°C.
Isolation of mitochondrial respiratory complexes
Mitochondrial respiratory complexes (MRC) were isolated by blue native PAGE as previously described (17). Briefly, mitochondria (200 μg protein) were solubilized in 50 mM imidazole-HCl, 750 mM 6-aminocaproic acid (pH 7.0), and dodecyl maltoside (at a detergent-protein weight ratio of 1:4) for 30 min at 4oC and centrifuged at 16,100 × g. The supernatant was supplemented with Coomassie Brilliant Blue G-250 (at a dye-protein weight ratio of 1:4) and 10% glycerol and MRC complexes were electrophoresed in a 5–12% blue native PAGE (18). Mitochondrial respiratory complex bands were excised from the gel and incubated in a denaturing buffer (6% SDS, 150 mM 2-mercaptoethanol) and then placed on a 10% SDS-PAGE to separate individual proteins. To confirm the identification of MRC proteins, a MS601 MitoProfileR Human Total OXPHOS Complexes Detection Kit (Mitosciences, Eugene, OR) was used according to the manufacturer’s protocol.
Detection of oxidized proteins
Changes in oxidized protein levels were determined using an Oxyblot kit (Chemicon/Millipore, Temecula, CA) according to the manufacturer recommendations. Briefly, proteins were derivatized with 4-dinitrophenylhydrazine (DNPH) for 15 min followed by incubation at room temperature with a neutralization buffer (Chemicon/Millipore). Derivatized proteins were electrophoresed on a 10% SDS-PAGE and blotted on Hybond PVDF membranes (Amersham, Piscataway, NJ). Blots were blocked with 5% non-fat dry milk (blocking buffer) in Dulbecco’s PBS containing 0.05% Tween 20; (PBS-T) for 3 h and incubated with anti-DNP primary antibody (1:150) (Chemicon/Millipore) overnight at 4oC. In selected experiments, blots were incubated with primary antibody to 4-hydroxynonenal-protein adducts (1:300) (Oxis International Inc., Foster City, CA). In control experiments, blots were analyzed for components of the mitochondrial respiratory chain complexes using OXPHOS monoclonal antibody cocktail (1:200) (Mitosciences). After three washes with PBS-T, membranes were incubated for 1 h at room temperature with horseradish peroxidase-conjugated secondary antibodies (1:300) (Amersham, Piscataway, NJ). Immunocomplexes were visualized by chemiluminescence using the ECL kit (Amersham).
Protein identification
Protein bands were excised from Coomassie Blue stained gels, digested with trypsin, and subjected to mass spectrum analysis using a Model 4800 MALDI-TOF/MS analyzer (Applied Biosystems, Foster City, CA). Proteins were identified using the Swiss-Prot database and the Mascot algorithm as we reported previously (19). Expected values were considered significant when E ≤ 0.01 (20). MS analyses were conducted by the Biomolecular Resource Facility at UTMB.
Amplex Red Assay
Release of H2O2 from isolated mitochondria was measured by AmplexR Red (10-acetyl-3,7-dihydroxyphenoxazine; Molecular Probes) assay as we previously described (12). Briefly, mitochondria (100 μg/ml) were suspended in 50 μl (per well) reaction buffer and incubated with 0.25 U/ml AmplexR Red and 1 U/ml of HRP at 25°C for 30 min. The changes in fluorescence intensity were measured using a microplate reader (SpectraMass M2, Molecular Devices, Sunnyvale, CA) at 530/590 nm. The addition of catalase (400 U/ml, Sigma Inc), which catalyzes the decomposition of H2O2 to water and oxygen, decreased fluorescence signals by 90%. As a positive control, increasing concentrations of H2O2 (0–400 pmol) were used.
Mitochondrial quality was assessed by respiratory control ratio as previously described (21). Mitochondrial respiratory state 4 (ST4, resting state) was determined by oxygen consumption rate in the presence of respiratory substrates (5 mM glutamate/5 mM malate or 10 mM succinate/1μM rotenone). Respiratory state 3 (ST3, active state) was determined by oxygen consumption rate in the presence of respiratory substrates plus ADP and Pi. Respiratory control ratio was calculated as the ratio of ST3/ST4. Mitochondrial suspensions showing respiratory control ratio values > 2.5 were used for further experiments.
Down-regulation of target genes by antisense oligonucleotides
Antisense oligonucleotides (ASO) were designed by siDESIGNR Center on-line software (Dharmacon RNAi Technologies, Lafayette, CO) using the sequence database of the National Center for Biotechnology Information. The phosphorothioate protected ASO were synthesized by Integrated DNA Technologies (Coralville, IA). Down-regulation of target gene expression was evaluated by real time-RT PCR. Total RNA was isolated using an RNAqueous kit (Ambion, Austin, TX). A template of cDNA was synthesized using SuperScriptTM III First-Strand Synthesis SuperMix for qRT-PCR (Invitrogen, Carlsbad, CA). Real time PCR primers for UQCRC1 (Cat # PPM41408A) and UQCRC2 (Cat # PPM24606A) (SABiosciences, Frederick, MD) were used to analyze expression levels of these genes. To analyze transfection efficiency, Texas Red labeled ASO was added or transfected into LA-4 cells. Four h later cells were dried, fixed in acetone/methanol (1:1) and stained with 10 ng/ml of 4,6'-diamidino-2-phenylindole (DAPI). Cells were mounted on microscope slides and analyzed using a Nikon Eclipse TE 200 fluorescent microscope attached to a Photometrix CoolSNAP Fx CCD digital camera and MetaMorph software (version 6.09; Universal Imaging Corp.). Down-regulation of target genes by ASO was calculated based on percent of transfected cells and levels of PCR amplification. For down-regulation of UQCRC1 and UQCRC2 the following ASO were selected: UQCRC1; 3’-t*c*t*tgcaccagaaact*a*a*t and UQCRC2; 3’-g*g*t*acgacgataacaa*c*g*t (*phosphorothioate).
Sensitization and challenge of animals
BALB/c mice were purchased from Harlan Sprague-Dawley (San Diego, CA). All animal experiments were performed according to the National Institutes of Health Guide for Care and Use of Experimental Animals and approved by UTMB Animal Care and Use Committee. Eight-week old female mice were sensitized with RWE as previously described (3). Briefly, mice received two intraperitoneal administrations (days 0 and 4) of endotoxin-free (150 μg per animal) RWE (lot 34868; Greer Laboratories (Lenoir, NC) mixed with alum adjuvant (Pierce Laboratories, Rockford, IL) at a ratio 3:1. RWE-sensitized mice received intranasally 10 μg of antisense dissolved in 60 μl PBS at 36, 24 and 12 h prior to RWE challenge. Control mice received same volumes of PBS. On day 11, mice were challenged intranasally with RWE (100 μg dissolved in 60 μl PBS).
Assessment of UQCRC1 and UQCRC2 expression in the lungs
Levels of UQCRC1 and UQCRC2 proteins were analyzed by fluorescent microscopy. Briefly, lung sections were blocked for 30 min with rabbit non immune serum (1:100). After two washes with PBS-T, slides were incubated with primary antibodies to UQCRC1 (1:200) (Santa Cruz Biotechnology, Inc. Santa Cruz, CA) and UQCRC2 (1:200) (Novus Biologicals, Littleton, CO) as well as to cytochrome c oxidase subunit IIb (Cox IIb; Molecular Probes) for 60 min at 30°C. After two washes with PBS-T, cells were incubated with FITC-conjugated (Santa Cruz Biotechnology) or Texas Red-conjugated (Leinco Technologies, Inc., St. Louis, MO) F(ab’)2 secondary antibodies (1:200) for 60 min at 37°C. After a wash with PBS-T, cells were counterstained with 10 ng/ml of DAPI, and mounted using DakoCytomation (Carpinteria, CA) mounting medium. Sections were analyzed using a Nikon Eclipse TE 200 fluorescent microscope attached to a Photometrix CoolSNAP Fx CCD digital camera and MetaMorph software (version 5; Universal Imaging Corp.).
Differential cell counts
Three days after RWE challenge mice were euthanized and bronchoalveolar lavage fluids (BALF) were collected. Trachea was cannulated and lung lavage was performed by two instillations of 0.6 ml ice cold PBS. The BALF samples were centrifuged (800 × g for 5 min at 4oC), and the resulting supernatants were stored at −80 oC for further analysis. Total cell counts in BALF were determined from an aliquot of the cell suspension. Differential cell counts were performed on cytocentrifuge preparations (Shandon CytospinR 4 Cytocentrifuge, Thermo Scientific, Waltham, MA) stained with Wright-Giemsa, in a blind fashion by two independent researchers counting 200 cells from eachanimal.
Assessment of mucin levels
MUC5AC levels in the BALF were assessed by ELISA as previously described (22). Briefly, 96-well plates were coated with serially diluted BALF in coating buffer (50 mM Na2CO3, 50 mM NaHCO3) and then primary mouse anti-human MUC5AC antibody (1:16000) (clone 45M1, Lab Vision, Fremont, CA) was added. Binding of primary antibody was detected by peroxidase-conjugated goat anti-mouse secondary antibody (1:5000) (Amersham) and a peroxidase substrate, tetramethyl benzidine (eBioscience, San Diego). Changes in absorbance were measured at 450 nm using a SpectraMax 190 ELISA plate reader (Molecular Devices, Sunnyvale, CA). All incubations were done at 37°C.
Evaluation of allergic inflammation by histology
After bronchoalveolar lavage, the lungs were fixed with 4% paraformaldehyde, embedded in paraffin, sectioned to 5 μm and stained with haematoxylin and eosin. Perivascular and peribronchial inflammation were evaluated by a pathologist in a blinded fashion to obtain data for each lung. Mucin producing cells were assessed by periodic acid–Schiff staining of formalin-fixed, paraffin embedded lung sections. The stained sections were analysed as above and representative fields were photographed with a Photometrix CoolSNAP Fx camera mounted on a NIKON Eclipse TE 200 UV microscope.
Airway hyperresponsiveness
Changes in pause of breathing (Penh) as an index of airway obstruction were measured by barometric whole-body plethysmography (Buxco Electronics Inc, Troy NY) (23). Bronchial hyperreactivity was evaluated using the methacholine challenges (24). Briefly, mice were placed in a Buxco chamber, allowed to acclimate for 5 min and then exposed for 3 min to nebulized saline. Subsequently, mice were exposed to increasing concentrations (0, 6.25, 12.5, 25 and 50 mg/ml) of nebulized methacholine (Sigma) in saline. The median size of the aerosol doplets ranged between 1 and 4 μm (manufacturer’s specification). Bronchopulmonary resistance was expressed as enhanced pause = [(expiratory time/relaxation time) − 1] × (peak expiratory flow/peak inspiratory flow). The flow signals and the respiratory parameters were calculated using the Biosystem XA program (Buxco Electronics).
Statistical analysis
Data are presented as mean ± standard error of the mean. Mice were randomly grouped (group size, 4 to 6). All experiments were repeated 3 to 5 times. Statistical analysis was performed using the Student's t-test or ANOVA, followed by post hoc tests: Bonferroni’s (samples with equal variances) and Dunnett’s T3 (samples with unequal variances) with SPSS 14.0 software. Differences were considered to be statistically significant at P < 0.05.
RESULTS
Exposure to pollen extract induces oxidative damage to mitochondrial respiratory chain proteins
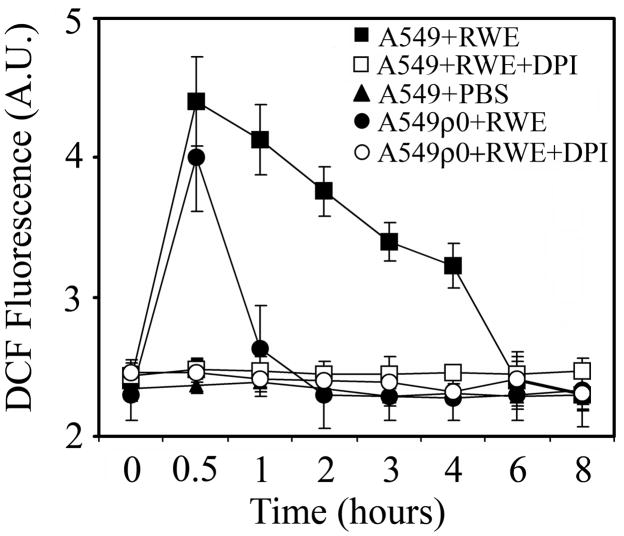
Pollen grains or their extracts induce oxidative stress in cultured cells and in the airway epithelium as well as conjunctiva of challenged experimental animals (1, 3). Here, we show that addition of RWE to human airway epithelial cells (A549), after an initial oxidative burst, resulted in a sustained increase in the intracellular ROS levels. At 6 h after RWE exposure, ROS levels decreased to basal values as shown in Figure 1. On the other hand, in mitochondrial DNA-depleted cells (A549ρ0) the oxidative burst was transient and lasted for approximately 1 h (Fig. 1). Diphenylene iodinium (DPI; 100 μM), a NADPH oxidase inhibitor (25), abolished the changes in ROS levels in both A549 and A549ρ0 cells (Fig. 1). Together, these results suggested that RWE-exposure caused oxidative modifications to mitochondrial respiratory chain resulting in elevated ROS generation from mitochondria.
FIG. 1.
Exposure of cells with functional mitochondria results in sustained increase in the intracellular ROS levels. Airway epithelial cells (A549) cells and mitochondrial DNA depleted A549ρ0 cells were loaded with H2DCF-DA and treated with 100 μg/ml RWE in the presence or absence of DPI, a NAD(P)H oxidase inhibitor. Changes in intracellular DCF fluorescence were determined by flow cytometry. The data points represent mean values of three independent experiments.
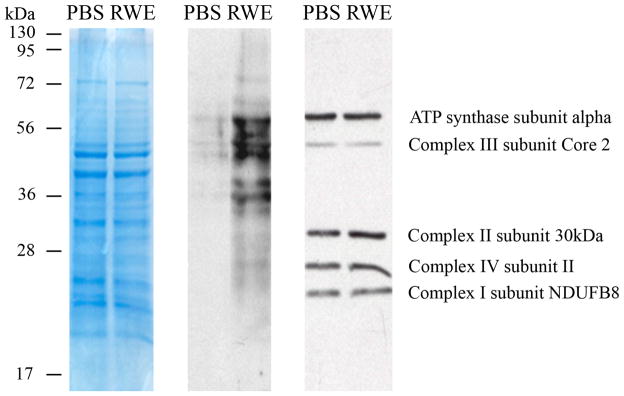
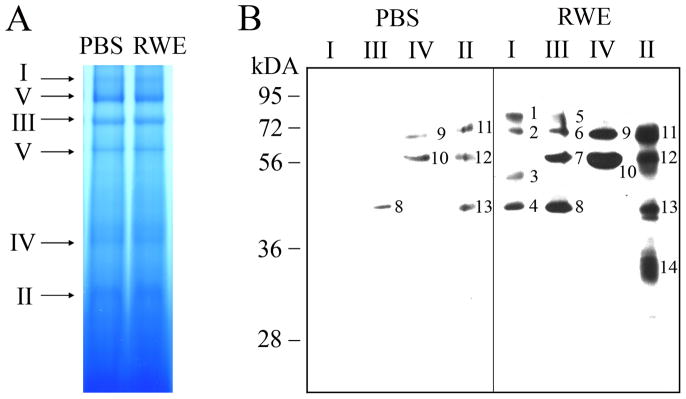
To test this hypothesis, we isolated and purified mitochondria from RWE-treated and control cells. First, overall changes in modified protein levels were analyzed, and as shown in Figure 2, a notable increase in carbonylated protein levels was observed in mitochondrial lysates from RWE-treated cells, but not from mock-treated cells. Next, the MRC complexes were isolated by blue native PAGE (Fig. 3A), their DNPH-derivatized proteins were separated in a 10% SDS-PAGE and damaged proteins were visualized by anti-DNP antibody (Fig. 3B). Levels of carbonylated proteins were increased in mitochondrial respiratory complexes and complex-associated proteins from RWE-treated cells compared to those from mock-treated ones (Fig. 3B). In complex I, anti-DNP antibody did not react with any DNP-derivatized proteins from mock-treated cells; while, it detected 4 carbonylated proteins from RWE-treated ones (Fig. 3B, right panel, 1, 2, 3, 4). In complex III, 3 protein bands appeared, as consequences of RWE treatment (Fig. 3B, right panel, 5, 6, 7). In the case of complex IV, only quantitative differences in the levels of carbonylated proteins were observed (Fig. 3B). Due to RWE-exposure, levels of carbonylated proteins further increased and an additional 31-kD protein was oxidatively damaged in complex II (Fig. 3B, right panel, 14). Furthermore, we observed elevated levels of 4-hydroxynonenal-protein adducts from RWE-treated cells (data not shown). Their patterns were similar; however, their abundances were less pronounced than those of carbonylated proteins shown in Fig. 2A.
FIG. 2.
Treatment of epithelial cells with RWE increases the levels of carbonylated proteins in mitochondria. Mitochondria isolated from mock-treated and RWE-exposed (100 μg/ml) cells were purified (Materials and Methods). Mitochondrial lysates were DNPH derivatized and subjected to SDS-PAGE (left panel). After blotting onto membrane, oxidatively-damaged proteins were detected using DNP-specific antibody (middle panel). In parallel experiments the relative levels of respiratory complex proteins in mitochondrial preparations were analyzed using OXPHOS monoclonal antibody cocktail (right panel). Results are from a representative experiment from three repeats.
FIG. 3.
Detection and identification of carbonylated mitochondrial respiratory complex proteins. A, Mitochondria isolated from mock-treated and RWE-exposed (100 μg/ml) cells were purified. Equal amounts of mitochondrial lysates were loaded and MRCs were isolated on blue native PAGE. B, Complexes (I–IV) were excised from blue native gels and DNPH derivatized prior to separation on 10% SDS-PAGE. Carbonylated proteins were visualized using antibody to DNP. Oxidatively damaged proteins identified by MALDI-TOF/MS analysis are shown in Table I.
MALDI-TOF/MS analysis of oxidatively-damaged proteins identified NADH dehydrogenase (ubiquinone) Fe-S protein (NDUFS) 1 and NDUFS2, both of them are parts of the catalytic core of the complex I (Table 1, Fig 3). Ubiquinol-cytochrome c reductase core protein I (UQCRC1) and UQCRC2, core components of the complex III, were also identified among the damaged proteins (Table 1, Fig 3). We did not find carbonylated electron transport proteins in either complex II or IV. In all experiments, several accessory proteins, co-migrated with the respiratory chain complexes during the blue native PAGE, were also damaged. These proteins include 75-kDa glucose-regulated protein (GRP75; associated with complex [C] III), heat shock protein (HSP) 70 (CI, CII, CIII, CIV) HSP60 (CII, CIV), citrate synthase (CISY; CII) and voltage-dependent anion selective channel 1 (VDAC1; CII) (Table 1, Fig 3).
Table 1.
Identification of oxidatively damaged protein
| Band numbera | Abbrev.b | Protein Name | MW (kDa) | E valuec | Access Swiss- Prot | Function | MRCd | Mitochondrial localization |
|---|---|---|---|---|---|---|---|---|
| 1 | NDUFS1 | NADH dehydrogenase (ubiquinone) Fe-S protein 1 | 75 | 7.3 × 10⁻¹² | P28331 | Electron transport | I | Inner membrane |
| 3 | NDUFS2 | NADH dehydrogenase (ubiquinone) Fe-S protein 2 | 49 | 1.5 × 10⁻¹¹ | O75306 | Electron transport | I | Inner membrane |
| 7 | UQCRC1 | Ubiquinol-cytochrome c reductase core protein I | 52 | 8.7 × 10−46 | P31930 | Structural protein | III | Inner membrane associated |
| 4, 8 | UQCRC2 | Ubiquinol-cytochrome c reductase core protein II | 48 | 9.2 × 10−45 | P22695 | Structural protein | I, III | Inner membrane associated |
| 5 | GRP75e | 75 kDa glucose- regulated protein | 74 | 6.9 × 10⁻¹⁹ | P38646 | Chaperone | III | Outer membrane |
| 2, 6, 9, 11 | HSP70e | Heat Shock Protein 70 | 74 | 3.5 × 10⁻²⁹ | Q8N1C8 | Chaperon | I, II, III, IV | Inner memrane associated |
| 10, 12 | HSP60e | Heat Shock Protein 60 | 61 | 3.7 × 10⁻²⁸ | Q96RI4 | Chaperon | II, IV | Matrix |
| 13 | CISYe | Citrate Synthase | 52 | 6.9 × 10⁻¹⁹ | O75390 | Krebs Cycle | II | Matrix |
| 14 | VDAC1e | Voltage-dependent anion-selective channel protein 1 | 31 | 4.4 × 10⁻¹⁸ | P21796 | Ion transport | II | Outer membrane |
Localization of bands is shown in Figure 3B.
Abbreviated name
Protein E value or expectation value assigned by the Mascot database is the number of matches with equal or better scores that are expected to occur by chance alone.
Mitochondrial respiratory chain complex
Proteins co-migrated with MRC complexes in blue native PAGE (Figure 3A,B)
Pollen extract triggers ROS production from mitochondrial respiratory chain complex III
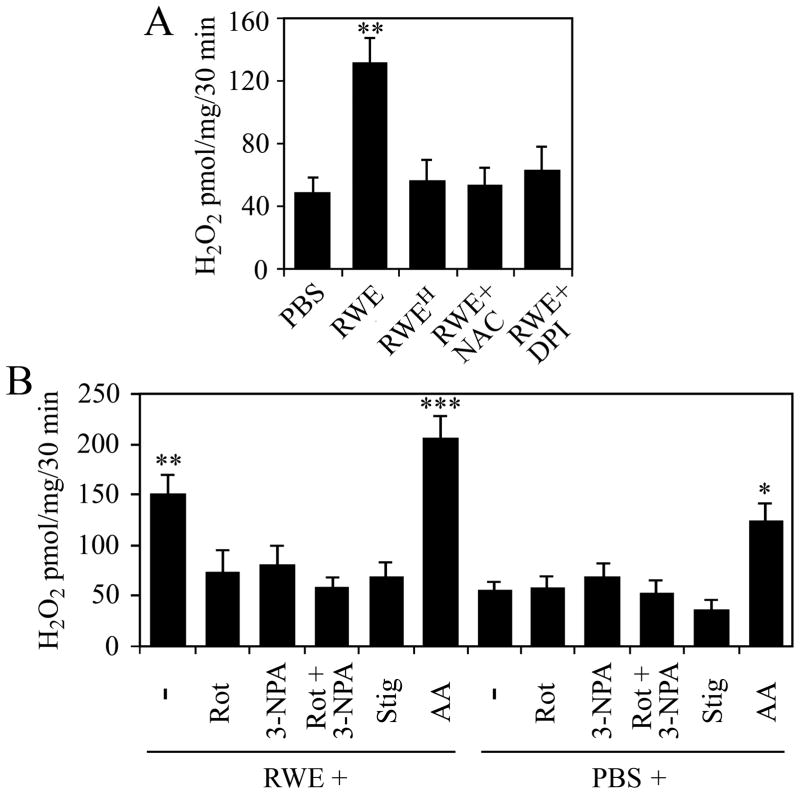
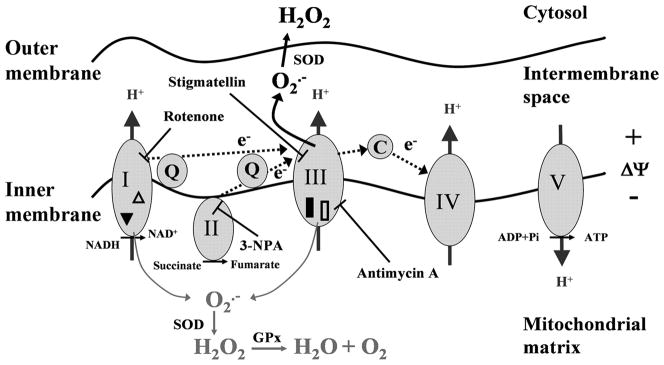
To analyze the functional consequences of damage to respiratory complexes, we determined the levels of ROS released from isolated mitochondria from RWE-treated and control cells. The primary mitochondrial reactive oxygen radical is the superoxide anion, which is rapidly converted to H2O2 by enzymatic or non-enzymatic pathways (26). Mitochondria isolated from RWE-treated cells produced significantly higher amount of H2O2 than those from mock-treated cells (Fig. 4A). In control experiments cells were exposed to heat-inactivated RWE (3) or they were treated with RWE in the presence of DPI (100 μM) or antioxidant (N-acetyl-L-cysteine; 10 mM, 3-h pretreatment). The H2O2 productions of mitochondria from these cells were close to the basal levels. These data are in line with the notion that oxidative mitochondrial damage leads to elevated ROS production (27). Complex I (rotenone; 10 μM) or complex II (3-nitropropionic acid; 3-NPA, 3 mM) inhibitor significantly decreased mitochondrial H2O2 production (Fig. 4B). The combined use of rotenone and 3-NPA decreased the H2O2 production nearly to the basal level (Fig. 4B), suggesting that electron flow from complex I and complex II chain is required for the increased ROS generation. Stigmatellin, which inhibits the Qo site of complex III at low concentration (0.06 μM) (28), abolished the RWE-induced mitochondrial H2O2 generation, while antimycin A (10 μM), an inhibitor of the electron transfer from cytochrome b to ubiquinone (12), further increased it, suggesting that complex III is most likely the source of the released ROS (Fig. 4B). Together, these observations indicated that oxidative damage to complex I proteins either did not result in increased ROS generation or ROS were released into the mitochondrial matrix where they were eliminated by antioxidants. These data further supported that in RWE-treated cells complex III was the major site of ROS released into the inner membrane space of mitochondria altering intracellular oxidative stress levels.
FIG. 4.
Mitochondria isolated from RWE-treated cells released higher amounts of H2O2 than mitochondria isolated from mock-treated cells. A, Pretreatment of cells with antioxidant (NAC) as well as physical (heat-treatment, RWEH) or chemical (DPI) inactivation of pollen NAD(P)H oxidases abolishes the ability of RWE to increase mitochondrial ROS generation. B, Identification of respiratory complex III, as a major site of ROS production in mitochondria from RWE-treated cells. Administration of rotenone (Rot), 3-NPA, as well as stigmatellin (Stig) to mitochondria decreases, while addition of antimycin A (AA) enhances RWE-induced mitochondrial ROS production. Data are presented as means ± SEM of 3 independent experiments. *P< 0.05, **P< 0.01, ***P< 0.001 vs. H2O2 release from mitochondria of mock- treated cells.
Down-regulation of UQCRC2 mimics its oxidative damage
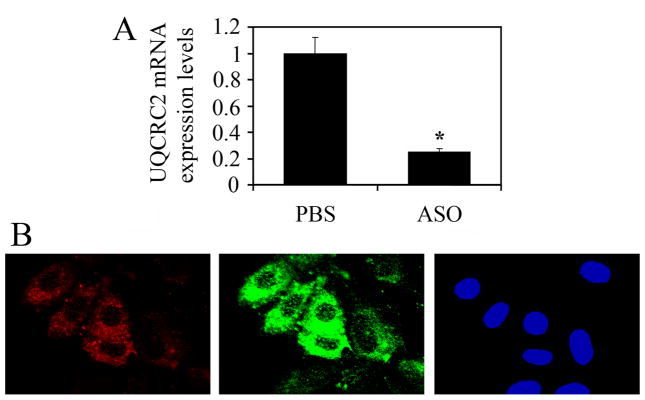
Mitochondrial proteins, damaged upon oxidative insult, change their function and oxidized proteins are known to accumulate during various pathophysiological states associated with oxidative stress (29). Because of the increased H2O2 release from complex III after RWE exposure, we focused our investigations on UQCRC1 and UQCRC2 in these processes. To mimic the altered/decreased function induced by oxidative damage to these proteins, we down-regulated them at RNA level using antisense oligonucleotides (ASO) (both UQCRC1 and UQCRC2 are encoded by nuclear genes). The efficiency of down-regulation at RNA levels were determined by quantitative RT-PCR. Results corrected by transfection efficiency of cell cultures showed that ASO down-regulated expression by more than 80% (Fig. 5A). Due to varying percentage of efficiently transfected cells (determined by Texas Red-labeled ASO) we used in situ microscopic analysis to assess changes in cellular ROS levels. Microscopic images indicated that only cells with red fluorescence (Texas Red) showed increased DCF signal (green fluorescence) in UQCRC2 transfected cultures (Fig. 5B). The increased DCF fluorescence was seen at both 1 and 3 h after loading the cells with H2DCF-DA, which is consistent with sustained ROS generation shown in Figure 1. In similar experiments UQCRC1 transfected cells showed no increased DCF fluorescence (data not shown). Taken together, these results suggested that down-regulation of UQCRC2 increased mitochondrial ROS levels.
FIG. 5.
Down-regulation of UQCRC2 increases cellular ROS levels. A, ASO to UQCRC2 down-regulated its expression in LA-4 cells by more than 80% (Materials and Methods). B, Increased ROS levels in cells efficiently transfected with ASO to UQCRC2. Cells were transfected with Texas Red-labeled ASO and various times thereafter cellular ROS levels were assessed by H2DCF-DA using microscopic analysis. Only cells with red fluorescence (Texas Red) show increased DCF signal (green fluorescence) in transfected cell cultures. *P< 0.05 vs. mock-treated cells.
Oxidative damage to UQCRC2 in the airways increases allergic inflammation and bronchial hyperresponsiveness
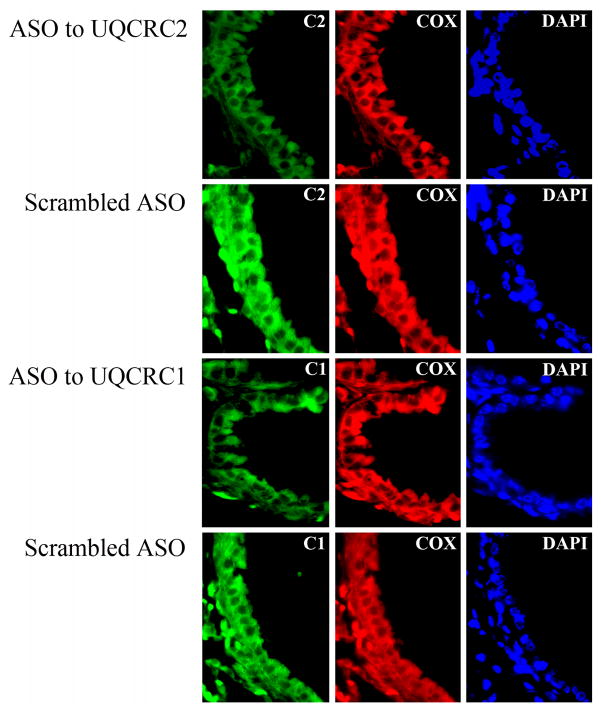
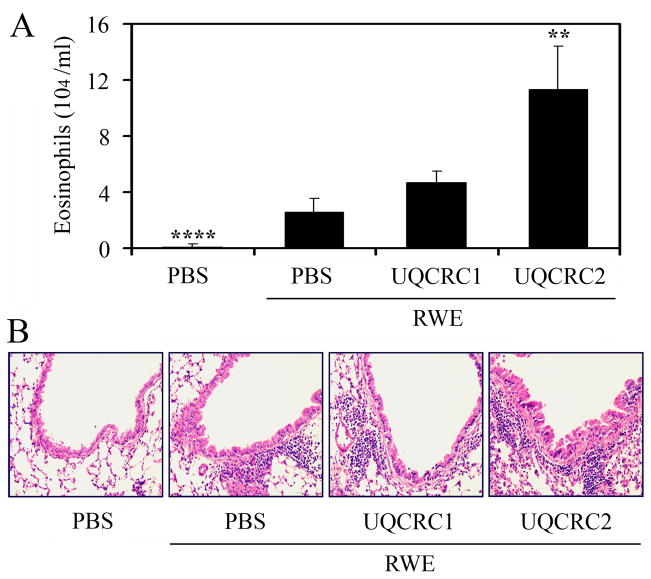
Next, we investigated whether the preexisting oxidative damage to UQCRC2 exacerbates allergic airway inflammation. Sensitized mice were repeatedly treated with the corresponding ASO (3-times, 10 μg in 60 μl saline) or mock-treated. Level of UQCRC2 in the airways was assessed immunohistochemically. We observed focal down-regulation of UQCRC2 (Fig. 6) in the bronchial epithelium; however, the expression of mitochondrially synthesized Cox IIb was not affected (Fig. 6). ASO-treated mice were intranasally challenged with RWE and the allergic inflammation was evaluated 72 h later (3). Differential cell counts from bronchoalveolar lavage fluid (BALF) showed that UQCRC2 antisense oligonucleotide treatment resulted in a 4.4-fold increase in the number of eosinophils compared to mock-treated, RWE-challenged mice (Fig. 7A). UQCRC2-specific ASO treatment also enhanced the accumulation of inflammatory cells in the peribronchial region of the airways (Fig. 7B). Although ASO treatment down-regulated UQCRC1 expression (Fig. 6), it did not increased significantly (P=0.08) the RWE-induced accumulation of eosinophils in the airways (Fig. 7A, B). ASO to UQCRC2 or UQCRC1 alone did not increase number of eosinophils in BALF or recruit inflammatory cells to the peribrochial area (data not shown).
FIG. 6.
Inhibition of the expression of mitochondrial respiratory complex III core proteins in the lungs by local ASO treatment. ASO were administered intranasally to RWE-sensitized mice and expression of UQCRC1 and UQCRC2 was analyzed in lung sections by fluorescent microscopy. In the bronchial epithelium focal down-regulation of both UQCRC1 and UQCRC2 was observed (left panel); however, the expression of mitochondrially synthesized cytochrome c oxidase subunit IIb was not affected (middle panel). Scrambled ASO treatment did not modified the expression of either core proteins or cytochrome c oxidase subunit IIb (left and middle panels). C1, UQCRC1; C2, UQCRC2; Cox, cytochrome c oxidase subunit IIb; DAPI, 4,6'-diamidino-2-phenylindole.
FIG. 7.
Preexisting mitochondrial dysfunction induced by UQCRC2 downregulation increases RWE-induced accumulation of inflammatory cells in the airways. Antisense oligonucleotide treatment, specific for UQCRC2 but not for UQCRC1, increases the number of eosinophils in the bronchoalveolar lavage fluids (A) and enhances accumulation of inflammatory cells in the peribronchial area (B) in RWE-challenged mice. **P< 0.01, ****P< 0.0001 vs. mock-treated, RWE-challenged mice.
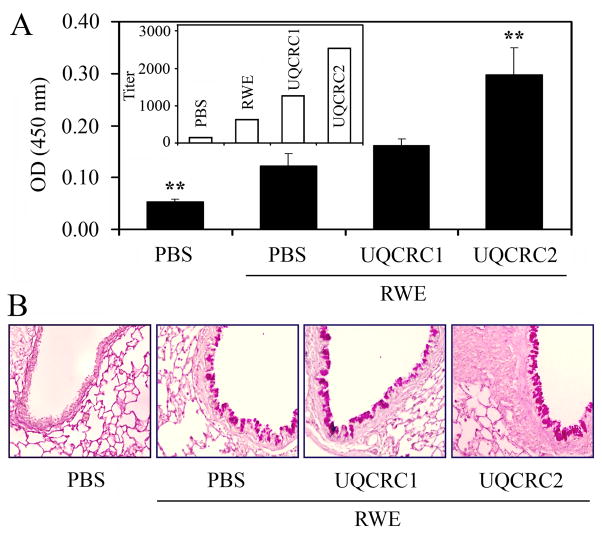
Mucous cell proliferation and hypersecretion of airway mucin are important pathological features of asthma and allergic airway inflammation (30). The levels of MUC5AC, which is the most abundant mucin produced in the airway epithelial cells during allergic inflammation (31), were determined in the BALF by ELISA. The levels of the MUC5AC were 2.4-fold higher in the BALF of RWE-challenged mice treated with ASO for UQCRC2 compared to mock-treated, RWE-challenged ones (Fig. 8A). As expected, altered expression of UQCRC2 also increased the metaplasia of mucuos cells in airway epithelium (Fig. 8B). Down-regulation of UQCRC1 did not increase significantly (P=0.09) either the MUC5AC levels in BALF or mucous cell metaplasia compared to mice RWE-challenged only (Fig. 8A, B). Antisense oligonucleotide treatment to UQCRC2 or UQCRC1 alone did not induce mucous cell proliferation and metaplasia.
FIG. 8.
Mitochondrial dysfunction induced by UQCRC2 downregulation enhances RWE-induced mucin production in the airways. Down-regulation of UQCRC2, but not UQCRC1, increases the levels of MUC5AC in the bronchoalveolar lavage fluids (A) and increases the metaplasia of mucuos cells in airway epithelium (B) of RWE-challenged mice. Inset: endpoint titers of MUC5AC in the samples. **P< 0.01 vs. mock-treated, RWE-challenged mice.
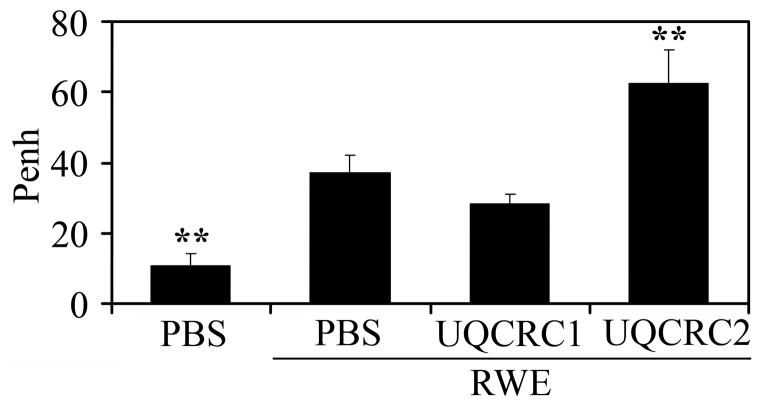
As expected, airway hyperresponsiveness was increased (as reflected by Penh values) in all RWE-challenged groups of mice compared to PBS-challenged ones (Fig. 9). However, mice treated with antisense for UQCRC2 (Penh = 62.50±9.53) but not those for UQCRC1 (Penh = 28.42±2.49), showed a significant increase (p<0.01) in airway hyperresponsiveness compared to mice challenged with RWE only (Penh = 10.85±3.17) (Fig. 9). Penh values, in mice treated with ASO to UQCRC1 or UQCRC2 alone, were similar to those in saline challenged control group (data not shown).
FIG. 9.
Preexisting mitochondrial dysfunction mediated by ASO to UQCRC2 increases RWE-induced airway hyperresponsiveness. Changes in pause of breathing (Penh) as an index of airway obstruction were measured by barometric whole-body plethysmography. **P< 0.01 vs. mock-treated, RWE-challenged mice.
DISCUSSION
Oxygen radical production is increased in airway inflammatory disorders, and exposure to exogenous oxidants such as cigarette smoke, diesel exhaust or ozone cause exacerbation of allergic inflammation. These exogenous oxidants also induce mitochondrial dysfunction, which is associated with the pathomechanism of inflammatory diseases. Here, we show that exposure of airway epithelial cells to RWE induces mitochondrial dysfunction via oxidative modifications of mitochondrial respiratory complex I and III proteins. Importantly, preexisting mitochondrial dysfunction induced in airway epithelium of sensitized Balb/c mice exacerbates RWE challenge-induced accumulation of eosinophils, the mucin levels and airway hyperresponsiveness. Based on these experiments we may conclude that preexisting mitochondrial dysfunction induced by oxidant environmental pollutants could be a risk factor for development of allergic disorders in atopic individuals.
In addition to mitochondrial complex subunit proteins, several accessory proteins were oxidatively damaged in the mitochondria from RWE-treated cells. The 75-kDa glucose-regulated protein (GRP75/HSP75/mortalin/TRAP-1), HSP60 and HSP70 are essential mitochondrial chaperones. Their synthesis is elevated under oxidative stress conditions suggesting a protective role against oxidative insults in mitochondria (32, 33). VDAC1 is a multifunctional protein (34) shown to interact with cytoskeletal elements (35, 36) and enzymes in the mitochondrial inner membrane (37, 38). Its damage by ROS correlates well with the observation that mitochondrial ROS are transported to the cytoplasm by voltage-dependent anion channels (39). Citrate synthase (CISY) was copurified with complex II and identified as oxidatively damaged protein in mitochondria from RWE-treated cells. Since HSP70 with its co-chaperones can bind nonnative states of proteins to prevent aggregation and assist to reach a functional conformation (40, 41), we suppose that HSP70 links carbonylated CISY and VDAC1 to complex II. Although the roles of these proteins are significant in maintaining mitochondrial integrity and function, we have focused on respiratory complex proteins, because of their direct involvement in mitochondrial ROS generation. After treatment of cultured epithelial cells with RWE, we have identified NDUFS1 and NDUFS2 from the catalytic core of the complex I, as well as UQCRC1 and UQCRC2 structural proteins from complex III, as oxidatively-damaged complex proteins. These findings were intriguing because complex I and complex III are the major sites of ROS generation in the mitochondria (42). Moreover, mitochondria isolated from RWE-treated cells showed increased release of H2O2 and suggest that oxidative damage to respiratory chain proteins are directly related to mitochondrial dysfunction. To identify the site of ROS generation in oxidatively damaged mitochondria, we used inhibitors of respiratory chain complexes. Our results show that the combined use of rotenone [inhibits the electron flow at complex I near the binding site for ubiquinol, the electron acceptor for complex I (42)] and 3-NPA [irreversibly binds to succinate dehydrogenase in the complex II (43)] blocked H2O2 generation in mitochondria from RWE-treated cells, indicating that the electron transport chain, but not alpha-ketoglutarate dehydrogenase in Krebs cycle (44), is the major source of ROS. Stigmatellin [blocks complex III at the Qo site; at sub micromolar concentrations (28)] also abolished the mitochondrial ROS generation. In contrast, antimycin A, which binds to matrix side of complex III and inhibits the Qi site of cytochrome c oxidoreductase, in the cytochrome b subunit (12), further increased the RWE-treatment induced mitochondrial ROS production. These studies together suggest that complex III is the main site for ROS generation in mitochondria of RWE-exposed cells.
Both UQCRC1 and UQCRC2 are localized to the matrix side of the complex III, in proximity to the predicted site of ROS generation at Qi center. These proteins provide structural stability to complex III. Furthermore, they have mitochondrial processing peptidase (MPP) activity, by which they process and allow proper protein folding in mitochondrial inner membrane (45). UQCRC1 and UQCRC2 have been identified among the oxidatively damaged proteins in mitochondria from kidney (46), skeletal muscle (47) and heart (47) in aging mice. Moreover, UQCRC2 was found to be involved in the natural senescence of mouse brain (48). Oxidative stress that occurs in response to pathogens also induces oxidative modification (e.g., carbonylation) to these core proteins (49). Taken together, our results suggest that core proteins in complex III are the primary acceptors of reactive radicals, and oxidative damage-induced alterations in their structure and/or function may lead to increased mitochondrial ROS production.
Protein degradation and increased replacement of modified proteins have been recognized as important factors for the maintenance of cellular homeostasis and survival after oxidative insults (50, 51). Failure or defect in the maintenance systems results in sub-physiological levels of functional proteins (accumulation of oxidatively modified and dysfunctional proteins) (29). In order to mimic the transient decrease in levels and/or functions of the oxidatively damaged UQCRC1 and UQCRC2, we down-regulated their expression by antisense oligonucleotides prior to RWE challenge. We found that down-regulation of UQCRC2, but not UQCRC1 enhanced cellular ROS levels. Although UQCRC1 and UQCRC2 share many characteristics, it seems that they have different roles in maintenance ubiquinol-cytochrome c reductase activity of complex III. Partial processing of UQCRC2 is shown to be associated with impairment of proton pumping suggesting that UQCRC2 has important role in the maintenance of inner membrane potential thereby in mitochondrial ROS generation (52). UQCRC2 is required for the assembly of complex III possessing two ubiquinone-reactive centers through which electrons are forwarded to cytochrome c oxidase. The Qo center, where ubiquinol is oxidized by redox active centers cytochrome c1 and the ‘Rieske’ [2Fe-2S] protein, is oriented toward the intermembrane space; while the Qi center, where ubiquinone is reduced by the redox center cytochrome b, is facing the matrix (53). Antimycin A inhibits Qi center thus increases H2O2 release from mitochondria. Taking this analogy, RWE-mediated oxidative damage to UQCRC2 might perturb electron flow at Qi center and thus directs electrons to intermembrane space to reduce molecular oxygen inducing elevated mitochondrial ROS production.
Mitochondrial dysfunction represents an important early step in the chain of events leading to the initiation and progression of inflammatory diseases such as diabetes, cardiovascular diseases, Parkinson's disease, Alzheimer's disease and others (54, 55). Several observations also suggest the involvement of mitochondria in allergic asthma. There is an epidemiological link between maternal history of atopy and susceptibility to atopic disorders of the descendent (56, 57). Since mitochondria are inherited through the maternal line, it raises the possibility that sequence variation in the mitochondrial genome contributes to the pathogenesis of asthma. Indeed, a mitochondrial haplogroup has been shown to be associated with total serum IgE levels in asthmatics (58). In contrast, mitochondrial haplogroups were not associated with altered lung functions or airway responsiveness (58). Mitochondrial dysfunction and ultrastructural changes (loss of cristae and swelling) have also been observed as consequences of airway inflammation in an experimental allergic asthma model (59). In the bronchial epithelium of inflamed lungs, the expression of 17-kDa protein of respiratory complex I [nuclear encoded (60)], and subunit III of cytochrome c oxidase [encoded by mitochondria (61)] was reduced (59). Our finding that in RWE-treated cells all of the carbonylated mitochondrial proteins are nuclear encoded is not a surprise, because the entire protein coding capacity of mitochondrial DNA is devoted to the synthesis of only 13 essential subunits of the respiratory complexes. Thus the majority of respiratory proteins and all of the other gene products necessary for the myriad mitochondrial functions are derived from nuclear genes (62). Based on our observations, the nuclear encoded mitochondrial proteins are more susceptible to oxidative damage than mitochondrial encoded ones; however, the presence of proteins encoded by the mitochondrial genome is also essential for elevated mitochondrial ROS production. In support, mitochondrial DNA-depleted ρ0 cells (63) did not sustain increased ROS levels after RWE exposure. Taken together, these data suggest that mitochondrial genes preferentially affect atopic diathesis (58), while defect or polymorphism of mitochondria protein encoding nuclear genes could be related to severe allergic symptoms. Further studies are needed to investigate genetic polymorphisms and distinct susceptibilities to oxidative damage of potential mitochondrial target proteins in atopic and nonatopic subjects.
In our work we show that besides the well-characterized oxidant environmental pollutants, exposure to pollen grains also trigger mitochondrial dysfunction in airway epithelial cells. Previous studies on human subjects have reported that nasal exposure to ozone (64) or particulate matter air pollution (65) followed by challenge with allergen significantly enhanced the allergic responses. Similarly, repeated pollen exposure amplified and sustained allergic symptoms (66). Whether repeated antigenic stimuli alone or together with existing mitochondrial dysfunction are responsible for this phenomenon should be investigated.
In conclusion, we have provided evidence that preexisting oxidative damage to mitochondria, prior the recruitment of inflammatory cells to the airways, intensified airway eosinophilia, increased mucin production, as well as enhanced bronchial hyperresponsiveness. Our findings further emphasize the role of mitochondria in the pathogenesis of allergic airway inflammation and asthma. Furthermore, they also imply that prevention or reduction of oxidative mitochondrial damage in the airways may have a beneficial role in therapy of these diseases.
FIG. 10.
Footnotes
This work was supported by NIAID, P01 AI062885-01 (I.B., S.S.), NIH HL071163 (S.S., I.B), NIH NHLBI Proteomics Initiative, NO1HV-28184 (AK) and NIEHS Center Grant, EOS 006677 (IB, AK).
Abbreviations used in this paper: ASO, antisense oligonucleotides; BALF, bronchoalveolar lavage fluid; Cox IIb, cytochrome c oxidase subunit IIb; DAPI, 4,6'-diamidino-2-phenylindole; DCF, dichlorofluorescein; DNPH, 4-dinitrophenylhydrazine; DPI, diphenylene iodinium; H2DCF-DA, 2′-7′-dihydro-dichlorofluorescein diacetate; NDUFS1, NADH dehydrogenase (ubiquinone) Fe-S protein 1; NDUFS2, NADH dehydrogenase (ubiquinone) Fe-S protein 2; NAC, N-acetyl-L-cysteine; 3-NPA, 3-nitropropionic acid; MRC, mitochondrial respiratory complex; ROS, reactive oxygen species; RWE, ragweed pollen extract; UQCRC1, ubiquinol-cytochrome c reductase core protein I; UQCRC2, ubiquinol-cytochrome c reductase core protein II.
References
- 1.Bacsi A, Dharajiya N, Choudhury BK, Sur S, Boldogh I. Effect of pollen-mediated oxidative stress on immediate hypersensitivity reactions and late-phase inflammation in allergic conjunctivitis. J Allergy Clin Immunol. 2005;116:836–843. doi: 10.1016/j.jaci.2005.06.002. [DOI] [PMC free article] [PubMed] [Google Scholar]
- 2.Bacsi A, Choudhury BK, Dharajiya N, Sur S, Boldogh I. Subpollen particles: carriers of allergenic proteins and oxidases. J Allergy Clin Immunol. 2006;118:844–850. doi: 10.1016/j.jaci.2006.07.006. [DOI] [PMC free article] [PubMed] [Google Scholar]
- 3.Boldogh I, Bacsi A, Choudhury BK, Dharajiya N, Alam R, Hazra TK, Mitra S, Goldblum RM, Sur S. ROS generated by pollen NADPH oxidase provide a signal that augments antigen-induced allergic airway inflammation. J Clin Invest. 2005;115:2169–2179. doi: 10.1172/JCI24422. [DOI] [PMC free article] [PubMed] [Google Scholar]
- 4.Dharajiya N, Choudhury BK, Bacsi A, Boldogh I, Alam R, Sur S. Inhibiting pollen reduced nicotinamide adenine dinucleotide phosphate oxidase-induced signal by intrapulmonary administration of antioxidants blocks allergic airway inflammation. J Allergy Clin Immunol. 2007;119:646–653. doi: 10.1016/j.jaci.2006.11.634. [DOI] [PMC free article] [PubMed] [Google Scholar]
- 5.Bowler RP. Oxidative stress in the pathogenesis of asthma. Curr Allergy Asthma Rep. 2004;4:116–122. doi: 10.1007/s11882-004-0056-7. [DOI] [PubMed] [Google Scholar]
- 6.Riedl MA, Nel AE. Importance of oxidative stress in the pathogenesis and treatment of asthma. Curr Opin Allergy Clin Immunol. 2008;8:49–56. doi: 10.1097/ACI.0b013e3282f3d913. [DOI] [PubMed] [Google Scholar]
- 7.Ott M, Gogvadze V, Orrenius S, Zhivotovsky B. Mitochondria, oxidative stress and cell death. Apoptosis. 2007;12:913–922. doi: 10.1007/s10495-007-0756-2. [DOI] [PubMed] [Google Scholar]
- 8.Servais S, Boussouar A, Molnar A, Douki T, Pequignot JM, Favier R. Age-related sensitivity to lung oxidative stress during ozone exposure. Free Radic Res. 2005;39:305–316. doi: 10.1080/10715760400011098. [DOI] [PubMed] [Google Scholar]
- 9.Li N, Sioutas C, Cho A, Schmitz D, Misra C, Sempf J, Wang M, Oberley T, Froines J, Nel A. Ultrafine particulate pollutants induce oxidative stress and mitochondrial damage. Environ Health Perspect. 2003;111:455–460. doi: 10.1289/ehp.6000. [DOI] [PMC free article] [PubMed] [Google Scholar]
- 10.Fahn HJ, Wang LS, Kao SH, Chang SC, Huang MH, Wei YH. Smoking-associated mitochondrial DNA mutations and lipid peroxidation in human lung tissues. Am J Respir Cell Mol Biol. 1998;19:901–909. doi: 10.1165/ajrcmb.19.6.3130. [DOI] [PubMed] [Google Scholar]
- 11.Giles RE, Blanc H, Cann HM, Wallace DC. Maternal inheritance of human mitochondrial DNA. Proc Natl Acad Sci U S A. 1980;77:6715–6719. doi: 10.1073/pnas.77.11.6715. [DOI] [PMC free article] [PubMed] [Google Scholar]
- 12.Bacsi A, Woodberry M, Widger W, Papaconstantinou J, Mitra S, Peterson JW, Boldogh I. Localization of superoxide anion production to mitochondrial electron transport chain in 3-NPA-treated cells. Mitochondrion. 2006;6:235–244. doi: 10.1016/j.mito.2006.07.008. [DOI] [PMC free article] [PubMed] [Google Scholar]
- 13.King MP, Attardi G. Isolation of human cell lines lacking mitochondrial DNA. Methods Enzymol. 1996;264:304–313. doi: 10.1016/s0076-6879(96)64029-4. [DOI] [PubMed] [Google Scholar]
- 14.Dobson AW, Grishko V, LeDoux SP, Kelley MR, Wilson GL, Gillespie MN. Enhanced mtDNA repair capacity protects pulmonary artery endothelial cells from oxidant-mediated death. Am J Physiol Lung Cell Mol Physiol. 2002;283:L205–210. doi: 10.1152/ajplung.00443.2001. [DOI] [PubMed] [Google Scholar]
- 15.Aguilera-Aguirre L, Gonzalez-Hernandez JC, Perez-Vazquez V, Ramirez J, Clemente-Guerrero M, Villalobos-Molina R, Saavedra-Molina A. Role of intramitochondrial nitric oxide in rat heart and kidney during hypertension. Mitochondrion. 2002;1:413–423. doi: 10.1016/s1567-7249(02)00002-8. [DOI] [PubMed] [Google Scholar]
- 16.Saavedra-Molina A, Uribe S, Devlin TM. Control of mitochondrial matrix calcium: studies using fluo-3 as a fluorescent calcium indicator. Biochem Biophys Res Commun. 1990;167:148–153. doi: 10.1016/0006-291x(90)91743-c. [DOI] [PubMed] [Google Scholar]
- 17.Schagger H. Blue-native gels to isolate protein complexes from mitochondria. Methods Cell Biol. 2001;65:231–244. doi: 10.1016/s0091-679x(01)65014-3. [DOI] [PubMed] [Google Scholar]
- 18.Van Coster R, Smet J, George E, De Meirleir L, Seneca S, Van Hove J, Sebire G, Verhelst H, De Bleecker J, Van Vlem B, Verloo P, Leroy J. Blue native polyacrylamide gel electrophoresis: a powerful tool in diagnosis of oxidative phosphorylation defects. Pediatr Res. 2001;50:658–665. doi: 10.1203/00006450-200111000-00020. [DOI] [PubMed] [Google Scholar]
- 19.Forbus J, Spratt H, Wiktorowicz J, Wu Z, Boldogh I, Denner L, Kurosky A, Brasier RC, Luxon B, Brasier AR. Functional analysis of the nuclear proteome of human A549 alveolar epithelial cells by HPLC-high resolution 2-D gel electrophoresis. Proteomics. 2006;6:2656–2672. doi: 10.1002/pmic.200500652. [DOI] [PubMed] [Google Scholar]
- 20.Trinidad JC, Specht CG, Thalhammer A, Schoepfer R, Burlingame AL. Comprehensive identification of phosphorylation sites in postsynaptic density preparations. Mol Cell Proteomics. 2006;5:914–922. doi: 10.1074/mcp.T500041-MCP200. [DOI] [PubMed] [Google Scholar]
- 21.Estabrook RW, Ronald WEaMEP. Methods in Enzymology. Academic Press; 1967. Mitochondrial respiratory control and the polarographic measurement of ADP : O ratios; pp. 41–47. [Google Scholar]
- 22.Boldogh I, Aguilera-Aguirre L, Bacsi A, Choudhury BK, Saavedra-Molina A, Kruzel M. Colostrinin decreases hypersensitivity and allergic responses to common allergens. Int Arch Allergy Immunol. 2008;146:298–306. doi: 10.1159/000121464. [DOI] [PubMed] [Google Scholar]
- 23.Adler A, Cieslewicz G, Irvin CG. Unrestrained plethysmography is an unreliable measure of airway responsiveness in BALB/c and C57BL/6 mice. J Appl Physiol. 2004;97:286–292. doi: 10.1152/japplphysiol.00821.2003. [DOI] [PubMed] [Google Scholar]
- 24.Sur S, Wild JS, Choudhury BK, Sur N, Alam R, Klinman DM. Long term prevention of allergic lung inflammation in a mouse model of asthma by CpG oligodeoxynucleotides. J Immunol. 1999;162:6284–6293. [PubMed] [Google Scholar]
- 25.Van Gestelen P, Asard H, Caubergs RJ. Solubilization and Separation of a Plant Plasma Membrane NADPH-O2- Synthase from Other NAD(P)H Oxidoreductases. Plant Physiol. 1997;115:543–550. doi: 10.1104/pp.115.2.543. [DOI] [PMC free article] [PubMed] [Google Scholar]
- 26.Loschen G, Azzi A, Richter C, Flohe L. Superoxide radicals as precursors of mitochondrial hydrogen peroxide. FEBS Lett. 1974;42:68–72. doi: 10.1016/0014-5793(74)80281-4. [DOI] [PubMed] [Google Scholar]
- 27.Xia T, Kovochich M, Nel AE. Impairment of mitochondrial function by particulate matter (PM) and their toxic components: implications for PM-induced cardiovascular and lung disease. Front Biosci. 2007;12:1238–1246. doi: 10.2741/2142. [DOI] [PubMed] [Google Scholar]
- 28.Degli Esposti M, Ghelli A, Crimi M, Estornell E, Fato R, Lenaz G. Complex I and complex III of mitochondria have common inhibitors acting as ubiquinone antagonists. Biochem Biophys Res Commun. 1993;190:1090–1096. doi: 10.1006/bbrc.1993.1161. [DOI] [PubMed] [Google Scholar]
- 29.Bulteau AL, Szweda LI, Friguet B. Mitochondrial protein oxidation and degradation in response to oxidative stress and aging. Exp Gerontol. 2006;41:653–657. doi: 10.1016/j.exger.2006.03.013. [DOI] [PubMed] [Google Scholar]
- 30.Tanizaki Y, Kitani H, Okazaki M, Mifune T, Mitsunobu F, Kimura I. Mucus hypersecretion and eosinophils in bronchoalveolar lavage fluid in adult patients with bronchial asthma. J Asthma. 1993;30:257–262. doi: 10.3109/02770909309054525. [DOI] [PubMed] [Google Scholar]
- 31.Thornton DJ, Carlstedt I, Howard M, Devine PL, Price MR, Sheehan JK. Respiratory mucins: identification of core proteins and glycoforms. Biochem J. 1996;316(Pt 3):967–975. doi: 10.1042/bj3160967. [DOI] [PMC free article] [PubMed] [Google Scholar]
- 32.Mitsumoto A, Takeuchi A, Okawa K, Nakagawa Y. A subset of newly synthesized polypeptides in mitochondria from human endothelial cells exposed to hydroperoxide stress. Free Radic Biol Med. 2002;32:22–37. doi: 10.1016/s0891-5849(01)00755-9. [DOI] [PubMed] [Google Scholar]
- 33.Ghosh S, Janocha AJ, Aronica MA, Swaidani S, Comhair SA, Xu W, Zheng L, Kaveti S, Kinter M, Hazen SL, Erzurum SC. Nitrotyrosine proteome survey in asthma identifies oxidative mechanism of catalase inactivation. J Immunol. 2006;176:5587–5597. doi: 10.4049/jimmunol.176.9.5587. [DOI] [PubMed] [Google Scholar]
- 34.Lemasters JJ, Holmuhamedov E. Voltage-dependent anion channel (VDAC) as mitochondrial governator--thinking outside the box. Biochim Biophys Acta. 2006;1762:181–190. doi: 10.1016/j.bbadis.2005.10.006. [DOI] [PubMed] [Google Scholar]
- 35.Linden M, Karlsson G. Identification of porin as a binding site for MAP2. Biochem Biophys Res Commun. 1996;218:833–836. doi: 10.1006/bbrc.1996.0148. [DOI] [PubMed] [Google Scholar]
- 36.Kusano H, Shimizu S, Koya RC, Fujita H, Kamada S, Kuzumaki N, Tsujimoto Y. Human gelsolin prevents apoptosis by inhibiting apoptotic mitochondrial changes via closing VDAC. Oncogene. 2000;19:4807–4814. doi: 10.1038/sj.onc.1203868. [DOI] [PubMed] [Google Scholar]
- 37.Juhaszova M, Wang S, Zorov DB, Nuss HB, Gleichmann M, Mattson MP, Sollott SJ. The identity and regulation of the mitochondrial permeability transition pore: where the known meets the unknown. Ann N Y Acad Sci. 2008;1123:197–212. doi: 10.1196/annals.1420.023. [DOI] [PubMed] [Google Scholar]
- 38.Roman I, Figys J, Steurs G, Zizi M. In vitro interactions between the two mitochondrial membrane proteins VDAC and cytochrome c oxidase. Biochemistry. 2005;44:13192–13201. doi: 10.1021/bi050674s. [DOI] [PubMed] [Google Scholar]
- 39.Han D, Antunes F, Canali R, Rettori D, Cadenas E. Voltage-dependent anion channels control the release of the superoxide anion from mitochondria to cytosol. J Biol Chem. 2003;278:5557–5563. doi: 10.1074/jbc.M210269200. [DOI] [PubMed] [Google Scholar]
- 40.Bukau B, Horwich AL. The Hsp70 and Hsp60 chaperone machines. Cell. 1998;92:351–366. doi: 10.1016/s0092-8674(00)80928-9. [DOI] [PubMed] [Google Scholar]
- 41.Lee GJ, Vierling E. A small heat shock protein cooperates with heat shock protein 70 systems to reactivate a heat-denatured protein. Plant Physiol. 2000;122:189–198. doi: 10.1104/pp.122.1.189. [DOI] [PMC free article] [PubMed] [Google Scholar]
- 42.Chen Q, Vazquez EJ, Moghaddas S, Hoppel CL, Lesnefsky EJ. Production of reactive oxygen species by mitochondria: central role of complex III. J Biol Chem. 2003;278:36027–36031. doi: 10.1074/jbc.M304854200. [DOI] [PubMed] [Google Scholar]
- 43.Coles CJ, Edmondson DE, Singer TP. Inactivation of succinate dehydrogenase by 3-nitropropionate. J Biol Chem. 1979;254:5161–5167. [PubMed] [Google Scholar]
- 44.Adam-Vizi V. Production of reactive oxygen species in brain mitochondria: contribution by electron transport chain and non-electron transport chain sources. Antioxid Redox Signal. 2005;7:1140–1149. doi: 10.1089/ars.2005.7.1140. [DOI] [PubMed] [Google Scholar]
- 45.Deng K, Shenoy SK, Tso SC, Yu L, Yu CA. Reconstitution of mitochondrial processing peptidase from the core proteins (subunits I and II) of bovine heart mitochondrial cytochrome bc(1) complex. J Biol Chem. 2001;276:6499–6505. doi: 10.1074/jbc.M007128200. [DOI] [PubMed] [Google Scholar]
- 46.Choksi KB, Nuss JE, Boylston WH, Rabek JP, Papaconstantinou J. Age-related increases in oxidatively damaged proteins of mouse kidney mitochondrial electron transport chain complexes. Free Radic Biol Med. 2007;43:1423–1438. doi: 10.1016/j.freeradbiomed.2007.07.027. [DOI] [PMC free article] [PubMed] [Google Scholar]
- 47.Choksi KB, Nuss JE, Deford JH, Papaconstantinou J. Age-related alterations in oxidatively damaged proteins of mouse skeletal muscle mitochondrial electron transport chain complexes. Free Radic Biol Med. 2008;45:826–838. doi: 10.1016/j.freeradbiomed.2008.06.006. [DOI] [PMC free article] [PubMed] [Google Scholar]
- 48.Lad SP, Yang G, Scott DA, Chao TH, Correia Jda S, de la Torre JC, Li E. Identification of MAVS splicing variants that interfere with RIGI/MAVS pathway signaling. Mol Immunol. 2008;45:2277–2287. doi: 10.1016/j.molimm.2007.11.018. [DOI] [PubMed] [Google Scholar]
- 49.Wen JJ, Garg N. Oxidative modification of mitochondrial respiratory complexes in response to the stress of Trypanosoma cruzi infection. Free Radic Biol Med. 2004;37:2072–2081. doi: 10.1016/j.freeradbiomed.2004.09.011. [DOI] [PubMed] [Google Scholar]
- 50.Shringarpure R, Grune T, Davies KJ. Protein oxidation and 20S proteasome-dependent proteolysis in mammalian cells. Cell Mol Life Sci. 2001;58:1442–1450. doi: 10.1007/PL00000787. [DOI] [PMC free article] [PubMed] [Google Scholar]
- 51.Jung T, Grune T. The proteasome and its role in the degradation of oxidized proteins. IUBMB Life. 2008 doi: 10.1002/iub.114. [DOI] [PubMed] [Google Scholar]
- 52.Cocco T, Di Paola M, Papa S, Lorusso M. Chemical modification of the bovine mitochondrial bc1 complex reveals critical acidic residues involved in the proton pumping activity. Biochemistry. 1998;37:2037–2043. doi: 10.1021/bi9724164. [DOI] [PubMed] [Google Scholar]
- 53.Iwata S, Lee JW, Okada K, Lee JK, Iwata M, Rasmussen B, Link TA, Ramaswamy S, Jap BK. Complete structure of the 11-subunit bovine mitochondrial cytochrome bc1 complex. Science. 1998;281:64–71. doi: 10.1126/science.281.5373.64. [DOI] [PubMed] [Google Scholar]
- 54.Beal MF. Mitochondria take center stage in aging and neurodegeneration. Ann Neurol. 2005;58:495–505. doi: 10.1002/ana.20624. [DOI] [PubMed] [Google Scholar]
- 55.Mancuso C, Scapagini G, Curro D, Giuffrida Stella AM, De Marco C, Butterfield DA, Calabrese V. Mitochondrial dysfunction, free radical generation and cellular stress response in neurodegenerative disorders. Front Biosci. 2007;12:1107–1123. doi: 10.2741/2130. [DOI] [PubMed] [Google Scholar]
- 56.Soto-Quiros ME, Silverman EK, Hanson LA, Weiss ST, Celedon JC. Maternal history, sensitization to allergens, and current wheezing, rhinitis, and eczema among children in Costa Rica. Pediatr Pulmonol. 2002;33:237–243. doi: 10.1002/ppul.10070. [DOI] [PubMed] [Google Scholar]
- 57.Litonjua AA, V, Carey J, Burge HA, Weiss ST, Gold DR. Parental history and the risk for childhood asthma. Does mother confer more risk than father? Am J Respir Crit Care Med. 1998;158:176–181. doi: 10.1164/ajrccm.158.1.9710014. [DOI] [PubMed] [Google Scholar]
- 58.Raby BA, Klanderman B, Murphy A, Mazza S, Camargo CA, Jr, Silverman EK, Weiss ST. A common mitochondrial haplogroup is associated with elevated total serum IgE levels. J Allergy Clin Immunol. 2007;120:351–358. doi: 10.1016/j.jaci.2007.05.029. [DOI] [PubMed] [Google Scholar]
- 59.Mabalirajan U, Dinda AK, Kumar S, Roshan R, Gupta P, Sharma SK, Ghosh B. Mitochondrial structural changes and dysfunction are associated with experimental allergic asthma. J Immunol. 2008;181:3540–3548. doi: 10.4049/jimmunol.181.5.3540. [DOI] [PubMed] [Google Scholar]
- 60.Smeitink J, Loeffen J, Smeets R, Triepels R, Ruitenbeek W, Trijbels F, van den Heuvel L. Molecular characterization and mutational analysis of the human B17 subunit of the mitochondrial respiratory chain complex I. Hum Genet. 1998;103:245–250. doi: 10.1007/s004390050813. [DOI] [PubMed] [Google Scholar]
- 61.You KR, Wen J, Lee ST, Kim DG. Cytochrome c oxidase subunit III: a molecular marker for N-(4-hydroxyphenyl)retinamise-induced oxidative stress in hepatoma cells. J Biol Chem. 2002;277:3870–3877. doi: 10.1074/jbc.M109284200. [DOI] [PubMed] [Google Scholar]
- 62.Scarpulla RC. Transcriptional paradigms in mammalian mitochondrial biogenesis and function. Physiol Rev. 2008;88:611–638. doi: 10.1152/physrev.00025.2007. [DOI] [PubMed] [Google Scholar]
- 63.Chandel NS, Schumacker PT. Cells depleted of mitochondrial DNA (rho0) yield insight into physiological mechanisms. FEBS Lett. 1999;454:173–176. doi: 10.1016/s0014-5793(99)00783-8. [DOI] [PubMed] [Google Scholar]
- 64.Molfino NA, Wright SC, Katz I, Tarlo S, Silverman F, McClean PA, Szalai JP, Raizenne M, Slutsky AS, Zamel N. Effect of low concentrations of ozone on inhaled allergen responses in asthmatic subjects. Lancet. 1991;338:199–203. doi: 10.1016/0140-6736(91)90346-q. [DOI] [PubMed] [Google Scholar]
- 65.Hauser R, Rice TM, Krishna Murthy GG, Wand MP, Lewis D, Bledsoe T, Paulauskis J. The upper airway response to pollen is enhanced by exposure to combustion particulates: a pilot human experimental challenge study. Environ Health Perspect. 2003;111:472–477. doi: 10.1289/ehp.5862. [DOI] [PMC free article] [PubMed] [Google Scholar]
- 66.Ciprandi G, Ricca V, Landi M, Passalacqua G, Bagnasco M, Canonica GW. Allergen-specific nasal challenge: response kinetics of clinical and inflammatory events to rechallenge. Int Arch Allergy Immunol. 1998;115:157–161. doi: 10.1159/000023896. [DOI] [PubMed] [Google Scholar]


