Abstract
Expression of the Mycobacterium tuberculosis sigG sigma factor was induced by a variety of DNA-damaging agents, but inactivation of sigG did not affect induction of gene expression or bacterial survival under these conditions. Therefore, SigG does not control the DNA repair response of M. tuberculosis H37Rv.
Mycobacterium tuberculosis has at least two mechanisms regulating gene expression following DNA damage (6): the SOS response mediated by LexA and RecA (5, 9, 17) and an alternative mechanism independent of both RecA and LexA (6, 21). It is not known what controls the RecA-independent response, although a potential promoter motif common to a number of genes in this regulon that suggests the possible involvement of an alternative sigma factor has been identified (11). Of the 13 sigma factors in M. tuberculosis (2), SigG was the most highly induced following DNA damage and macrophage infection (1, 21). Moreover, a recent study suggested that SigG was responsible for transcription of lexA in a clinical isolate, CDC1551 (14).
Here, we addressed the role of SigG in M. tuberculosis H37Rv in response to DNA damage by comparing the global transcriptional profile of a sigG mutant strain with that of the wild type. Our results indicate that the absence of SigG does not affect the induction of known DNA damage response genes. In addition, we could find no evidence for the involvement of SigG in the transcription of lexA in vivo. Furthermore, the sigG mutant was no more susceptible to DNA damage than the parental strain. Therefore, we conclude that SigG does not control expression of either the RecA-dependent or the RecA-independent genes in response to DNA damage in M. tuberculosis H37Rv.
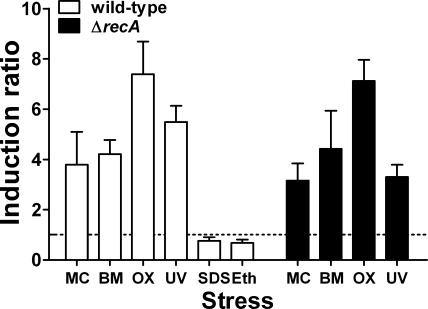
A potential role for SigG in regulating the response to DNA damage was initially proposed based on its induction following exposure to mitomycin C (21), which causes interstrand cross-links and alkylation damage. Basing our analysis on the pelleting properties of the bacteria, we suspect mitomycin C also affects the mycobacterial cell surface. Therefore, we measured the levels of sigG mRNA following other treatments predicted to damage DNA, namely, bleomycin exposure, ofloxacin exposure, and UV irradiation, resulting in breaks in DNA, inhibition of DNA gyrase, and induction of the formation of thymine dimers, respectively. The effect of cell surface stress on sigG expression was also assessed by treatment with ethambutol and exposure to sodium dodecyl sulfate (SDS). M. tuberculosis H37Rv cultures (See Table 1 for strains and plasmids used) were grown under Advisory Committee on Dangerous Pathogens (ACDP) containment level 3 conditions as described previously (6). Cultures were divided into aliquots at an optical density at 600 nm (OD600) of 0.3 to 0.4; samples were induced with mitomycin C (0.2 μg ml−1), ofloxacin (7.5 μg ml−1), or bleomycin (1.5 μg ml−1) for 5 h at 37°C, exposed to 23.5 J m−2 UV irradiation followed by 5 h of recovery at 37°C, or induced with SDS (0.05% for 5 h at 37°C) or ethambutol (15 μg ml−1 for 24 h at 37°C). Another sample was incubated in parallel without treatment to provide an uninduced control. RNA was extracted and purified as described previously (10), and cDNA synthesis was performed using Superscript II reverse transcriptase (RT) (Invitrogen). Quantitative PCR was carried out using Fast SYBR green master mix (Applied Biosystems) on an Applied Biosystems 7500 Fast instrument and analyzed with 7500 Fast SDS software version 1.4. Gene-specific primers (Table 2) were designed using Primer Express version 3.0 (Applied Biosystems). cDNA samples (and their RT-negative controls) were run alongside genomic DNA standards and relative expression levels calculated as described previously (10) except that normalization was based on the rrs gene encoding 16S rRNA. These values were divided by the corresponding values of the untreated sample to give induction ratios. Expression of sigG was induced by each DNA-damaging agent at a level similar to that seen with mitomycin C but was not increased by cell surface stress (Fig. 1). Induction resulting from DNA damage was also shown to occur in a ΔrecA strain, indicating that DNA-damage-specific induction of sigG was due to the alternative RecA-independent DNA damage response and not the SOS response.
TABLE 1.
Strains and plasmids used in the study
| Strain or plasmid | Description | Reference or source |
|---|---|---|
| Strains | ||
| DH5α | Escherichia coli strain used for general cloning | Invitrogen |
| XL1-Blue | E. coli strain used for site-directed mutagenesis (SDM) | Stratagene |
| H37Rv | M. tuberculosis wild-type strain | 18 |
| ΔsigG1 | H37Rv with mutation of sigG constructed by homologous recombination with targeting construct pLD1; contains secondary mutation of ppsE | This study |
| ΔsigG2 | H37Rv with mutation of sigG constructed by homologous recombination with targeting construct pLD1 | This study |
| Plasmids | ||
| pBackbone | Modified pBluescript KS(−) with 160-bp deletion in lacZ′, PacI site, and Kanr cassette | 12 |
| pUC-Hyg | Plasmid carrying Hygr cassette | 15 |
| pGoal17 | Plasmid carrying lacZ-sacB cassette | 20 |
| pLD1 | sigG targeting construct; made by cloning of a 4.3-kb DNA fragment containing sigG and surrounding sequence amplified with primers sigG1 and sigG2 into pBackbone, removal of 691 bp of the coding region of sigG by inverse PCR using primers i-SigGF and i-SigGR, and replacement with a 1.6-kb hygromycin cassette from pUC-Hyg; a sacB-lacZ cassette from pGOAL17 was introduced for counterselection and screening | This study |
| pEJ414 | Integrating mycobacterial lacZ transcriptional reporter vector | 19 |
| pEMD8 | 587-bp lexA upstream region in pEJ414 | 8 |
| pEJ554 | TAC-to-GCG mutation in SigA −10 motif of pEMD8, made by SDM with primers lexpr-10bf and lexpr-10br | This study |
TABLE 2.
Primers used in the study
| Primer | Sequence |
|---|---|
| sigG1 | AAAGATCTAAGCCCGCCAATAGCAGCAAGAGG |
| sigG2 | GGATGCATAGCGCAAGCACGTCGTCCACATAA |
| i-SigGF | TACCTAGGGCCATCGTCACCCTCATTCACCAA |
| i-SigGR | TACCTAGGTCGGTGTGGGCGGAGAAGT |
| lexpr-10bf | GGTGCGAATGCGACGCGATTCATTGCCATG |
| lexpr-10br | CATGGCAATGAATCGCGTCGCATTCGCACC |
| qRT-PCR primers | |
| rrs-qRTF | AAGAAGCACCGGCCAACTAC |
| rrs-qRTR | TCGCTCCTCAGCGTCAGTTA |
| sigG-qRTF | TGAACTGCTCGCACACTGCTA |
| sigG-qRTR | AGCGTCTCCTGAACAAGGTCTT |
| lexA-qRTF | GGAGCGCAAGGGCTACCT |
| lexA-qRTR | GCACCGCGCACATTGAC |
| recA-qRTF | ATCGAGAAGAGTTACGGCAAAGG |
| recA-qRTR | GCCCAGGGCCACGTCTA |
| ruvC-qRTF | CAACGGTTCCGCAGACAAG |
| ruvC-qRTR | GCCGGTGTCGGTTTAGCTT |
| radA-qRTF | GGACCGCGTTCGCTAGAG |
| radA-qRTR | TTGTCGTGCAGGAGGAAACA |
| uvrA-qRTF | CGCGAGCAGCGGTTCT |
| uvrA-qRTR | CGCCGTAGGGCGAGTTG |
| ung-qRTF | ACTTTCCCGTTCGACAACGT |
| ung-qRTR | AGCATGTCCTGGAGTCGGATA |
| Rv2191-qRTF | TTCGCCACCCTGGTAAACC |
| Rv2191-qRTR | CCACCATCGCCGTAGTGATA |
| Rv3202-qRTF | AGAGCAGGTCATGGTCCTTAGC |
| Rv3202-qRTR | GGCGATAACTACCAGATCCCATT |
FIG. 1.
Induction of sigG in response to different DNA-damaging agents. qRT-PCR was used to determine expression of sigG in response to exposure to the following DNA-damaging agents under the indicated conditions: mitomycin C (MC), 0.2 μg ml−1 for 5 h at 37°C; bleomycin (BM), 1.5 μg ml−1 for 5 h at 37°C; ofloxacin (OX), 7.5 μg ml−1 for 5 h at 37°C; and UV irradiation, 23.5 J m−2 followed by 5 h of recovery at 37°C. Each data set represents the means + standard deviations of the results determined with three biological replicates. Alternatively, the response to cell surface stress was determined by exposure to SDS (0.05% for 5 h at room temperature) or ethambutol (Eth) (15 μg ml−1 for 24 h at 37°C); for these determinations, each data set represents the means + standard deviations of the results determined with two biological replicates. Expression levels were determined and normalized to rrs expression, and induction ratios were calculated relative to untreated control results. The dotted line indicates an induction ratio of 1 (signifying lack of induction). sigG expression was induced under DNA-damaging conditions in both wild-type and ΔrecA strains of M. tuberculosis but was not induced by the cell surface stresses caused by the presence of SDS or ethambutol.
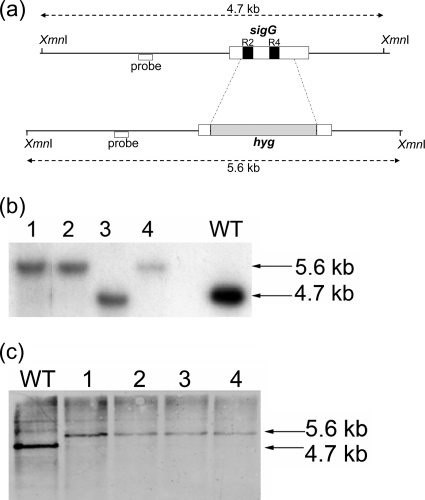
We constructed a strain in which sigG was inactivated by replacing region 2.4, which is responsible for interactions with the −10 promoter element, and region 4.2, which interacts with the −35 element, with a hygromycin cassette (Fig. 2). Potential mutants were screened by Southern blot analysis as described previously (10), and isolates confirmed to have the correct genotype were selected for further study. The mutation was shown by quantitative RT-PCR (qRT-PCR) to cause a partial polar effect, resulting in a decrease in expression of Rv0181c, the gene locus immediately downstream of sigG, but unchanged levels of expression of Rv0180c (data not shown). Isolate ΔsigG1 was used for microarray analysis, which revealed a defect in expression of the ppsE gene in the mutant strain which was not reversed on complementation (data not shown). PpsE is a polyketide synthase involved in the production of the cell wall lipid phthiocerol dimycocerosate (PDIM) (22); loss of PDIM has been shown to occur spontaneously in vitro (7). Expression of ppsE was shown not to have been affected in the independently isolated ΔsigG2 isolate, which was then used for all subsequent experiments.
FIG. 2.
Construction of sigG mutant strains. (a) A total of 691 bp internal to sigG was deleted by allelic recombination and replaced with a 1.6-kb hygromycin cassette. The schematic shows the locations of the regions replaced within sigG (dotted lines) and the DNA binding regions 2.4 (R2) and 4.2 (R4) (black boxes). The positions of the probes (white boxes below lines) and XmnI restriction sites used in Southern blot analysis are indicated, along with the expected fragment sizes detected in the wild-type and mutant strains (double-headed arrows). (b and c) Genomic DNA was extracted from potential ΔsigG mutant colonies (lanes 1 to 4) and Southern blot analysis of the genomic DNA performed alongside wild-type DNA analysis (lanes WT) after digestion was performed with XmnI and either a radiolabeled probe (b) or a horseradish peroxidase-labeled probe (c) used to detect potential double crossovers. (b) ΔsigG1 mutant construction; colonies 1, 2, and 4 showed the correct genotype. (c) ΔsigG2 mutant construction; all 4 colonies showed the correct genotype.
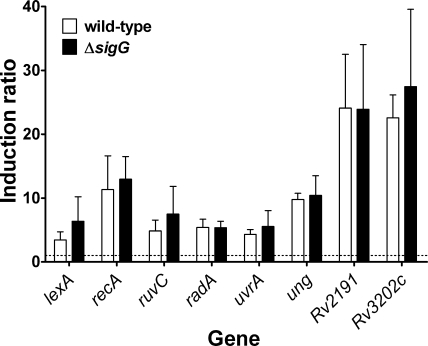
The global transcriptional response to DNA damage in the ΔsigG1 strain was investigated and compared with that of wild-type H37Rv by microarray analysis. Whole-genome M. tuberculosis microarray slides were obtained from the Bacterial Microarray Group at St. George's, London, United Kingdom. The array design is available at BμG@Sbase (accession no. A-BUGS-1; http://bugs.sgul.ac.uk/A-BUGS-1) and also at ArrayExpress (accession no. A-BUGS-1). Cy5-labeled RNA versus Cy3-labeled DNA hybridizations were performed, using control DNA obtained from Colorado State University, as described previously (10). As the sets of RNA samples were competitively hybridized against genomic DNA, rather than against each other, dye-swap studies were not necessary (24). The microarray slides were scanned using a GenePix Axon 4000A scanner (Axon Instruments), and image data were processed using Bluefuse for Microarrays 3.6 (BlueGnome). The data were normalized as described previously (10) but using GeneSpring GX 11 (Agilent Technologies) analysis software. Significant differences were determined using two-way analysis of variance (ANOVA) with the Benjamini and Hochberg False Discovery Rate correction. Fully annotated microarray data have been deposited in BμG@Sbase (accession number E-BUGS-111; http://bugs.sgul.ac.uk/E-BUGS-111) and ArrayExpress (accession number E-BUGS-111). The expression levels of 94 genes were increased at least 1.5-fold with statistical significance (P ≤ 0.05) in the wild-type or ΔsigG1 strains following exposure to 0.02 μg ml−1 mitomycin C for 24 h (see Table S1 in the supplemental material); this list of genes corresponded well to that reported previously from RNA-versus-RNA hybridizations and exposure to 0.2 μg ml−1 mitomycin C (21). When the expression levels of these 94 genes were compared between the two strains, none were found to differ significantly (P > 0.05). In fact, only five genes were found to differ significantly between the wild-type and ΔsigG1 strains under either set of conditions; further analysis found that these differences were most likely due to a secondary mutation and not to the absence of sigG (see above). We tested a subset of genes by quantitative RT-PCR using the ΔsigG2 mutant (Fig. 3). No differences in induction were observed between wild-type and ΔsigG2 strains for genes known to show RecA-dependent (lexA), partially RecA-dependent (recA, ruvC, radA), or RecA-independent (uvrA, ung, Rv2191, Rv3202c) DNA damage induction. Taken together, these data demonstrate that SigG does not regulate gene expression following DNA damage in M. tuberculosis H37Rv.
FIG. 3.
Expression of selected DNA repair genes in ΔsigG compared to wild-type M. tuberculosis strains in response to mitomycin C induction. Expression levels were determined by qRT-PCR after treatment with 0.2 μg ml−1 mitomycin C for 24 h and normalized to rrs expression, and induction ratios were calculated relative to untreated control results. The dotted line indicates an induction ratio of 1 (signifying no induction). Data represent means + standard deviations of the results obtained with three biological replicates. There were no significant differences in the levels of induction of any of these genes in the two strains.
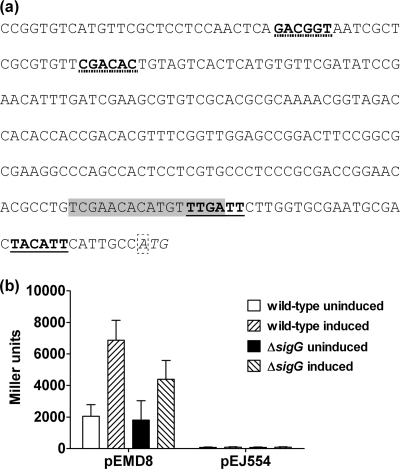
Transcription and translation start sites for lexA have previously been shown to coincide (17, 23), and appropriately located motifs resembling mycobacterial SigA promoter elements (25) have been identified, suggesting that lexA was transcribed by SigA in M. tuberculosis (Fig. 4A). A putative SigG promoter has also been identified upstream of lexA but is at too great a distance to correspond to transcription initiation at the mapped start site. A transcriptional fusion of the region upstream of lexA with the reporter gene lacZ was assayed for β-galactosidase activity as described previously (5). The wild-type lexA promoter sequence in pEMD8 directed high-level expression of β-galactosidase in the wild-type strain that increased approximately 4-fold upon mitomycin C induction, as shown previously (8). Changing the first three bases of the putative SigA −10 motif from TAC to GCG in pEJ554 dramatically reduced expression to 1 to 4% (depending on whether the samples were induced) of that observed with pEMD8 (Fig. 4b). Expression from pEMD8 did not differ significantly from wild-type expression in the ΔsigG2 strain; the apparent reduction in activity following induction by mitomycin C was not statistically significant (P > 0.05). Importantly, there was also no decrease in the residual expression seen with pEJ554 in the ΔsigG2 strain, showing that this expression was not due to a second SigG-dependent promoter. Thus, a promoter matching the consensus for SigA is responsible for at least 95% of the expression of lexA and the remaining 5% of expression is not due to SigG.
FIG. 4.
SigG does not effect expression of LexA. (a) The upstream region of lexA, showing the LexA start codon (italics), the transcriptional start site (dashed box), the SigA promoter motif (bold, solid underline), the SigG promoter motif (bold, dotted underline), and the SOS box (shaded). (b) β-Galactosidase activity of a lacZ transcriptional fusion to the wild-type lexA promoter region (pEMD8) or of that seen with a mutation in the sigA consensus promoter (pEJ554). Activity of the wild-type lexA promoter was increased 3- to 4-fold following induction by 0.02 μg ml−1 mitomycin C for 24 h in both the wild-type (WT) and ΔsigG strains of M. tuberculosis, with no significant difference between the two strains in induced expression levels (t test; P > 0.05). Mutation of the potential SigA promoter resulted in a dramatic reduction in activity of the lexA promoter and no induction by mitomycin C. Data represent means + standard deviations of the results determined with at least three different biological replicates.
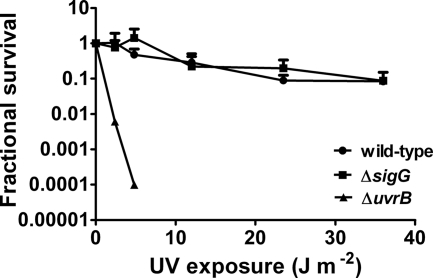
The sensitivity of the wild-type and ΔsigG2 strains to DNA damage caused by UV irradiation and different DNA-damaging drugs was assessed as described previously (3, 13). Survival rates after exposure to different doses of UV irradiation were similar for the ΔsigG and the wild-type strains; in contrast, enhanced susceptibility was seen with a uvrB mutant used as a control (Fig. 5), as shown previously (4). Viability in response to different concentrations of DNA-damaging drugs was examined by the use of a microplate Alamar blue assay, and again there was no difference between the wild-type and ΔsigG strains in the MIC or the 50% inhibitory concentration (IC50) for mitomycin C, bleomycin, or ofloxacin (Table 3). As we did not identify any phenotype caused by inactivation of sigG, complementation experiments were not necessary.
FIG. 5.
Susceptibility of the sigG mutant to UV irradiation. CFUs for wild-type and mutant strains were determined after exposure to different doses of UV and compared to untreated control results. The UV-sensitive ΔuvrB strain is shown as a control. Data represent means + standard deviations of the results obtained with three different biological replicates.
TABLE 3.
MIC and IC50 values for the wild-type and sigG2 mutant strains in response to DNA-damaging agents assessed by microplate Alamar blue assaya
| Result for indicated strain |
||||
|---|---|---|---|---|
| Drug | Wild type |
ΔsigG |
||
| MIC (μg ml−1) | IC50 (μg ml−1) | MIC (μg ml−1) | IC50 (μg ml−1) | |
| Mitomycin C | 0.036 ± 0.009 | 0.008 ± 0.001 | 0.036 ± 0.009 | 0.010 ± 0.001 |
| Bleomycin | 0.013 ± 0.004 | 0.004 ± 0.001 | 0.011 ± 0.006 | 0.003 ± 0.002 |
| Ofloxacin | 0.843 ± 0.178 | 0.405 ± 0.044 | 0.980 ± 0.264 | 0.432 ± 0.067 |
The MIC was defined as the lowest drug concentration to cause at least 90% inhibition. As the MIC value for each experiment represents an actual tested concentration, which differed between experiments and was not calculated from the dose response curve, the values can be identical. Values represent means ± standard deviations of the results of at least three separate experiments. The IC50 was defined as the midpoint of a dose response curve determined using GraphPad Prism 5.00 (GraphPad). Values represent means ± standard deviations of the results of at least three separate experiments.
The work presented here contradicts a recent report in which SigG was predicted to control the RecA-dependent DNA damage response (14). The differences between these two findings may reflect differences between M. tuberculosis strains H37Rv and CDC1551, although the nucleotide sequences for sigG and lexA and their surrounding genes are identical in the two strains. Alternatively, the differences may reflect the different growth phases studied. sigG was reported to exhibit the lowest expression level of all the sigma factors during exponential growth, and this expression level was shown to be reduced in the stationary phase (16). We also found that sigG expression declined with increasing OD (data not shown), and so we examined the effects of SigG under DNA-damaging conditions in which sigG is induced and likely to be active. Lee et al. (14) performed their gene expression analyses at ODs of 1 and 2, as they found the sigG expression level to be increased under those conditions. However, they normalized mRNA levels to that of sigA, expression of which is reduced in the stationary phase (16).
In conclusion, SigG, despite being induced by DNA-damaging agents, does not control either the RecA-independent or SOS responses of M. tuberculosis. Instead, SigG forms part of the RecA-independent regulon. The rest of the regulon contains many genes known to be involved in DNA repair and essential for survival. SigG possibly controls a second wave of gene expression that, although related to DNA damage, is not responsible for repair of the damaged DNA.
Supplementary Material
Acknowledgments
The research was supported by the United Kingdom Medical Research Council (program number U1175 32056).
We thank Krishna Gopaul for contributing to the construction of the sigG targeting plasmid, Kathryn Lougheed and Alison Gaudion for help with assay design, Joanna Dillury for the ΔuvrB UV susceptibility data, and Heran Darwin and Carl Nathan for kindly providing us with the M. tuberculosis uvrB mutant strain. We thank Colorado State University for providing control M. tuberculosis H37Rv DNA for use in microarray analysis and BμG@S for the supply of the M. tuberculosis microarrays and for help with uploading our microarray data into public databases.
Footnotes
Published ahead of print on 17 December 2010.
Supplemental material for this article may be found at http://jb.asm.org/.
REFERENCES
- 1.Cappelli, G., et al. 2006. Profiling of Mycobacterium tuberculosis gene expression during human macrophage infection: upregulation of the alternative sigma factor G, a group of transcriptional regulators, and proteins with unknown function. Res. Microbiol. 157:445-455. [DOI] [PubMed] [Google Scholar]
- 2.Cole, S. T., et al. 1998. Deciphering the biology of Mycobacterium tuberculosis from the complete genome sequence. Nature 393:537-544. [DOI] [PubMed] [Google Scholar]
- 3.Collins, L., and S. G. Franzblau. 1997. Microplate alamar blue assay versus BACTEC 460 system for high-throughput screening of compounds against Mycobacterium tuberculosis and Mycobacterium avium. Antimicrob. Agents Chemother. 41:1004-1009. [DOI] [PMC free article] [PubMed] [Google Scholar]
- 4.Darwin, K. H., and C. F. Nathan. 2005. Role for nucleotide excision repair in virulence of Mycobacterium tuberculosis. Infect. Immun. 73:4581-4587. [DOI] [PMC free article] [PubMed] [Google Scholar]
- 5.Davis, E. O., E. M. Dullaghan, and L. Rand. 2002. Definition of the mycobacterial SOS box and use to identify LexA-regulated genes in Mycobacterium tuberculosis. J. Bacteriol. 184:3287-3295. [DOI] [PMC free article] [PubMed] [Google Scholar]
- 6.Davis, E. O., et al. 2002. DNA damage induction of recA in Mycobacterium tuberculosis independently of RecA and LexA. Mol. Microbiol. 46:791-800. [DOI] [PubMed] [Google Scholar]
- 7.Domenech, P., and M. B. Reed. 2009. Rapid and spontaneous loss of phthiocerol dimycocerosate (PDIM) from Mycobacterium tuberculosis grown in vitro: implications for virulence studies. Microbiology 155:3532-3543. [DOI] [PMC free article] [PubMed] [Google Scholar]
- 8.Dullaghan, E. M., P. C. Brooks, and E. O. Davis. 2002. The role of multiple SOS boxes upstream of the Mycobacterium tuberculosis lexA gene—identification of a novel DNA-damage-inducible gene. Microbiology 148:3609-3615. [DOI] [PubMed] [Google Scholar]
- 9.Durbach, S. I., S. J. Andersen, and V. Mizrahi. 1997. SOS induction in mycobacteria: analysis of the DNA-binding activity of a LexA-like repressor and its role in DNA damage induction of the recA gene from Mycobacterium smegmatis. Mol. Microbiol. 26:643-653. [DOI] [PubMed] [Google Scholar]
- 10.Fivian-Hughes, A. S., and E. O. Davis. 2010. Analyzing the regulatory role of the HigA antitoxin within Mycobacterium tuberculosis. J. Bacteriol. 192:4348-4356. [DOI] [PMC free article] [PubMed] [Google Scholar]
- 11.Gamulin, V., H. Cetkovic, and I. Ahel. 2004. Identification of a promoter motif regulating the major DNA damage response mechanism of Mycobacterium tuberculosis. FEMS Microbiol. Lett. 238:57-63. [DOI] [PubMed] [Google Scholar]
- 12.Gopaul, K. K. 2002. Transcription of the Mycobacterium tuberculosis recA gene. University College London, London, United Kingdom.
- 13.Güthlein, C., et al. 2009. Characterization of the mycobacterial NER system reveals novel functions of the uvrD1 helicase. J. Bacteriol. 191:555-562. [DOI] [PMC free article] [PubMed] [Google Scholar]
- 14.Lee, J. H., D. E. Geiman, and W. R. Bishai. 2008. Role of stress response sigma factor SigG in Mycobacterium tuberculosis. J. Bacteriol. 190:1128-1133. [DOI] [PMC free article] [PubMed] [Google Scholar]
- 15.Mahenthiralingam, E., et al. 1998. Site-directed mutagenesis of the 19-kilodalton lipoprotein antigen reveals no essential role for the protein in the growth and virulence of Mycobacterium intracellulare. Infect. Immun. 66:3626-3634. [DOI] [PMC free article] [PubMed] [Google Scholar]
- 16.Manganelli, R., E. Dubnau, S. Tyagi, F. R. Kramer, and I. Smith. 1999. Differential expression of 10 sigma factor genes in Mycobacterium tuberculosis. Mol. Microbiol. 31:715-724. [DOI] [PubMed] [Google Scholar]
- 17.Movahedzadeh, F., M. J. Colston, and E. O. Davis. 1997. Characterization of Mycobacterium tuberculosis LexA: recognition of a Cheo (Bacillus-type SOS) box. Microbiology 143:929-936. [DOI] [PubMed] [Google Scholar]
- 18.Oatway, W. H. J., and W. J. Steenken. 1936. The pathogenesis and fate of tubercle produced by dissociated variants of tubercle bacilli. J. Infect. Dis. 59:306-325. [Google Scholar]
- 19.Papavinasasundaram, K. G., et al. 2001. Slow induction of RecA by DNA damage in Mycobacterium tuberculosis. Microbiology 147:3271-3279. [DOI] [PubMed] [Google Scholar]
- 20.Parish, T., and N. G. Stoker. 2000. Use of a flexible cassette method to generate a double unmarked Mycobacterium tuberculosis tlyA plcABC mutant by gene replacement. Microbiology 146:1969-1975. [DOI] [PubMed] [Google Scholar]
- 21.Rand, L., et al. 2003. The majority of inducible DNA repair genes in Mycobacterium tuberculosis are induced independently of RecA. Mol. Microbiol. 50:1031-1042. [DOI] [PubMed] [Google Scholar]
- 22.Rao, A., and A. Ranganathan. 2004. Interaction studies on proteins encoded by the phthiocerol dimycocerosate locus of Mycobacterium tuberculosis. Mol. Genet. Genomics 272:571-579. [DOI] [PubMed] [Google Scholar]
- 23.Smollett, K. L., et al. 2009. Experimental determination of translational start sites resolves uncertainties in genomic open reading frame predictions—application to Mycobacterium tuberculosis. Microbiology 155:186-197. [DOI] [PMC free article] [PubMed] [Google Scholar]
- 24.Talaat, A. M., S. T. Howard, W. Hale IV, R. Lyons, H. Garner, and S. A. Johnston. 2002. Genomic DNA standards for gene expression profiling in Mycobacterium tuberculosis. Nucleic Acids Res. 30:e104. [DOI] [PMC free article] [PubMed] [Google Scholar]
- 25.Unniraman, S., M. Chatterji, and V. Nagaraja. 2002. DNA gyrase genes in Mycobacterium tuberculosis: a single operon driven by multiple promoters. J. Bacteriol. 184:5449-5456. [DOI] [PMC free article] [PubMed] [Google Scholar]
Associated Data
This section collects any data citations, data availability statements, or supplementary materials included in this article.


