Abstract
A bioluminescence-based assimilable organic carbon (AOC) test was developed for determining the biological growth potential of seawater within the reverse osmosis desalination pretreatment process. The test uses Vibrio harveyi, a marine organism that exhibits constitutive luminescence and is nutritionally robust. AOC was measured in both a pilot plant and a full-scale desalination plant pretreatment.
In the desalination industry, reverse osmosis (RO) membrane fouling from biological growth, i.e., biofouling, causes loss of productivity and increases operating and maintenance costs. Given that RO has generally been used in warm water, because of geography or colocation with power plants, biological growth has been considered “the Achilles heel of membrane processes” (2). Heterotrophic biological growth can be reduced by limiting energy sources, i.e., organic carbon, through coagulation and/or biofiltration. Having a straightforward measurement tool available will enhance an operator's control of limiting substrate during treatment. This article presents a marine AOC test for determining the biological growth potential of water within the RO desalination pretreatment process.
The method has been adapted from a previously published freshwater AOC assay (5), except that the saltwater test uses the marine test organism Vibrio harveyi. The principle of the AOC test is based on the observed growth of a nutritionally diverse organism in the water sample. The amount of biomass produced can be directly related to the easily assimilable organic substrate. Because V. harveyi (ATCC 700106; American Type Culture Collection, Manassas, VA) exhibits constitutive luminescence, the amount of light produced can be directly related to biomass, which can be correlated to the AOC in the water.
Bacteria were recovered from stocks frozen at −80°C in marine broth and 10% glycerol by streaking onto marine agar containing (per liter) 10 g peptone, 5 g yeast extract, 15 g agar (BD and Co., Sparks, MD), and 20 g sodium chloride (EMD Chemicals, Gibbstown, NJ) and incubated (30°C) overnight. To prepare the refrigerated stock, a single colony was inoculated into a saline buffer (1× M9 salts [BD and Co., Sparks, MD] in 1,000 ml Milli-Q water with 2% sodium chloride, 0.1 mM CaCl2, and 1.0 mM MgSO4 and adjusted to pH 7.2) fortified with 2 mg of acetate-carbon/liter. The inoculated buffer was incubated for 7 days at 30°C, and then the stock was stored at 4°C for up to 30 days for the inoculation of water samples. The bacterial titer was monitored by performing serial dilutions onto marine agar and was generally close to 7 × 10⁶ CFU/ml.
AOC-free glassware preparation and sample collection have been described previously (5). A high-sensitivity, automated, and programmable photon-counting luminometer was used (SpectraMax L luminescence microplate reader; Molecular Devices Inc., Sunnyvale, CA) in conjunction with very-low- cross-talk 96-well white polystyrene microtiter plates (manufacturer catalog no. 7571; Thermo Scientific Corporation, Milford, MA). Luminescence measurements were made over 30-s intervals on duplicate 300-μl aliquots in the microplate with no time delay. Luminescence was reported in relative light units (RLU). RLU counts are derived by integrating the area under the photon count versus the time-reaction curve. Units were considered to be relative because the formula can be modified manually, which added to the ease of data monitoring and reporting. In contrast to the previous AOC method (5), samples can be incubated directly in the microtiter plate with a film covering to minimize evaporation.
The growth of V. harveyi was monitored during the exponential and stationary phases to measure and capture the maximum level of luminescence (Nmax) in the sample. Collecting numerous data points at user-defined intervals generated growth curves that were fit to the Monod model to determine the bacterial rate (μmax) of substrate utilization (5). The nutritional diversity of V. harveyi was tested using synthetic mixtures of various carbon sources. Saline buffer was fortified with 100-μg/liter carbon equivalents of either glucose, lactate, glycerol, cysteine, thiosulfate, oxalate, glycine, acetate, glutamate, citrate, decanal, pantothenate, or ascorbic acid, each prepared as an individual solution and added to a microtiter plate. V. harveyi was inoculated into the carbon-fortified solutions, and readings were made until maximum luminescence was reached. V. harveyi exhibited nutritional diversity: it was capable of utilizing amino acids, carboxylic acids, carbohydrates, aldehydes, and alcohols but not ascorbic acid. Glucose generated the greatest luminescence response (1.1 × 10⁸ RLU/ml), with the acetate response about 4-fold lower (2.6 × 10⁷ RLU/ml).
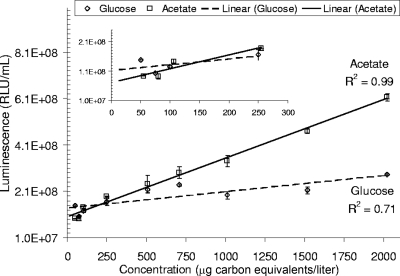
V. harveyi's luminescence response to the utilization of acetate showed a better linear fit than that to the utilization of glucose. Initial testing of an 11-point standard curve ranging from 25 to 2,000 μg carbon equivalents/liter had an r2 of 0.99, compared to 0.71 for glucose (Fig. 1). At the lower range of this standard curve (<300 μg/liter), the r2 was 0.88 for acetate and 0.41 for glucose (Fig. 1, inset). Therefore, acetate was chosen as the reference standard for the test, which was helpful, since acetate is traditionally used as the reference standard for the freshwater AOC test (1).
FIG. 1.
V. harveyi growth curve using acetate and glucose. Error bars indicate standard deviations of duplicate measurements. Inset provided for evidence of readings in the lower range of the standard curve.
Although measurement of the growth of V. harveyi using luminescence is extremely convenient, it is possible to perform the assay using a plate count method. The plate count assay was performed using serial dilutions of samples in 1× M9 buffer followed by spreading 0.1-ml aliquots onto marine agar plates in duplicate. Colonies were enumerated after 24 h of growth at 30°C. Enumeration of V. harveyi using plate counts and luminescence showed a good correlation and produced an r2 of 0.89 with a slope of 0.97 (n = 64). For samples grown in acetate-carbon, the cell yield for V. harveyi was 4.03 × 10⁶ CFU/liter per 1 μg acetate-carbon equivalents/liter.
Samples of raw and pretreatment water were collected from both pilot and full-scale desalination facilities. There were five sampling events at the full-scale Tampa Bay Seawater Desalination Facility (Gibsonton, FL). Sampling locations within the Tampa Bay facility included raw seawater, as well as raw water after the addition of chlorine dioxide, before the sand filters, after the sand filters, after the diatomaceous earth filters, and after the cartridge filters but before the RO membranes. These locations were selected to identify the effects of chlorine dioxide oxidation and the different types of filtration on the formation or removal of AOC. In November 2009, samples were collected over three consecutive days from the aforementioned locations (Table 1), in which daily variability of the source water quality was apparent. Total organic carbon (TOC) variability was greatest in the samples collected prior to sand filtration for both the raw-water and after-chlorine-dioxide locations. On average, TOC values decreased in samples throughout the treatment train by 0.5 mg/liter. TOC was measured as nonpurgeable organic carbon (1) with a high-temperature platinum catalyst using a Shimadzu TOC-5000 analyzer (Columbia, MD) with an ASI-5000A autosampler. AOC concentrations were the highest after chlorine dioxide oxidation, which was consistent with prior studies on the impact of oxidation on the formation of AOC (3). Nearly 80% of AOC was removed by biological activity in the sand filters, and up to 32% of AOC removal occurred within the diatomaceous earth filters, possibly as a result of biological activity within the filter cake. AOC increased at the cartridge filter, most likely due to the addition of antiscalant, which has been shown to promote biofouling (4).
TABLE 1.
Water quality comparison using saltwater AOC and TOCa
| Source and type of water | AOC (μg acetate-carbon/liter) (mean ± SD) | TOC (mg/liter) (mean ± SD) |
|---|---|---|
| Tampa Bay, FL | ||
| Tampa Bay raw | 360 ± 180 | 5.4 ± 0.3 |
| Chlorine dioxide | 440 ± 290 | 5.4 ± 0.3 |
| Pre-sand filtration | 150 ± 90 | 5.1 ± 0.2 |
| Post-sand filtration | 30 ± 10 | 4.9 ± 0.2 |
| Diatomaceous earth filters | 30 ± 10 | 4.9 ± 0.1 |
| Cartridge filters | 130 ± 90 | 4.9 ± 0.1 |
| Monterey Bay, CA | ||
| Raw inlet | 30 ± 20 | 1.4 ± 0.4 |
| Self-cleaning filter (100 μm) | 20 ± 20 | 1.5 ± 0.4 |
| Ultrafilter | ||
| 0.04-μm pore size | 10 ± 10 | 1.5 ± 0.6 |
| 0.01-μm pore size | 10 ± 15 | 1.5 ± 0.7 |
| Cartridge filters | <10 | 1.4 ± 0.5 |
Testing was performed on samples collected at the Tampa Bay Desalination Facility, Florida, and the Moss Landing, California, desalination pilot plant. Florida samples were collected over three consecutive days in November 2009, and California samples were collected in March, June, September, October, November, and December 2009.
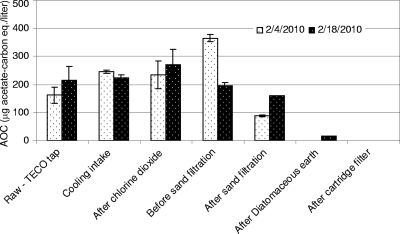
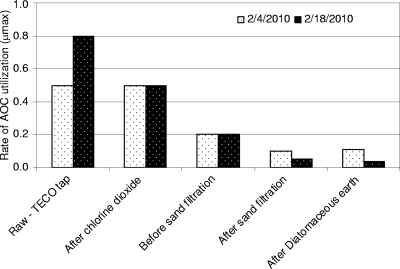
Similarly for samples collected on 4 and 18 February, the highest levels of AOC were after chlorine dioxide oxidation and most of the removal occurred in the sand and diatomaceous earth filters (Fig. 2). The rate of AOC utilization (μmax) was typically highest for the raw-water samples and progressively declined as the water moved through the treatment process (Fig. 3). These data imply that the most readily assimilable organic substrate was utilized first and the AOC that remained was progressively less readily biodegradable.
FIG. 2.
AOC removal during pretreatment in the Tampa Bay Desalination facility in February 2010. Error bars show the standard deviations between duplicate luminescence measurements.
FIG. 3.
Changes in the rate of AOC utilization (μmax) at different points in the treatment process. The most easily assimilated nutrients were used early in the pretreatment process.
Samples were also collected from a pilot plant in Moss Landing, CA, fed with water from Monterey Bay. The treatment configuration included a self-cleaning particle filter (100-μm pore size), followed by two ultrafilters in parallel (0.04- and 0.01-μm pore size) and then pre-RO cartridge filters. Samples were collected in March, June, September, October, November, and December 2009. Compared to AOC levels observed in Florida, concentrations were very low (n = 8; range, <10 to 60 μg/liter; average, 30 ± 20 μg/liter) (mean ± standard deviation [SD]) in all raw-water and pretreatment locations (Table 1). TOC was also very low in the Moss Landing samples (n = 24; range, 0.9 to 2.5 mg/liter; average, 1.4 ± 0.5 mg/liter), indicative of high-quality source water.
In summary, we have developed a luminescence-based, saltwater AOC assay using the nutritionally diverse and naturally bioluminescent marine organism V. harveyi. This assay is useful in understanding the impact of desalination pretreatment processes on the formation and removal of biodegradable organic matter, which could be important for minimizing membrane fouling.
Acknowledgments
This work is part of a tailored collaboration between American Water and the Water Research Foundation. We gratefully acknowledge the help and support of American Water—Acciona Agua LLC, Tampa Bay Water, and California American Water.
Footnotes
Published ahead of print on 10 December 2010.
REFERENCES
- 1.Eaton, A. D., L. S. Clesceri, E. W. Rice, A. E. Greenberg, and M. A. H. Franson (ed.). 2005. Standard methods for the examination of water and wastewater, 21st ed. American Public Health Association, Washington, DC.
- 2.Flemming, H.-C., G. Schaule, T. Griebe, J. Schmitt, and A. Tamachkiarowa. 1997. The Achilles heel of membrane processes. Desalination 113:215-225. [Google Scholar]
- 3.van der Kooij, D., W. A. M. Hijnen, and J. C. Kruithof. 1989. The effects of ozonation, biological filtration and distribution on the concentration of easily assimilable organic carbon (AOC) in drinking water. Ozone Sci. Engin. 11(3):297-311. [Google Scholar]
- 4.Vrouwenvelder, J. S., S. A. Manolarakis, H. R. Veenendaal, and D. Van der Kooij. 2000. Biofouling potential of chemicals used for scale control in RO and NF membranes. Desalination 132:1-10. [Google Scholar]
- 5.Weinrich, L. A., E. Giraldo, and M. W. LeChevallier. 2009. Development and application of a bioluminescence-based test for assimilable organic carbon in reclaimed waters. Appl. Environ. Microbiol. 75:7385-7390. [DOI] [PMC free article] [PubMed] [Google Scholar]


