

Abstract
The study on the evolutionary consequences of an RNA viral population's fluctuations can be approached by in vitro experiments. This work describes the fitness recovery of HIV-1 after 20 large-population passages in 10 debilitated clones. The serial passages promoted an increase in viral fitness. In addition, we detected a significant number of mutations fixed in the complete genome consensus sequence of the final viral populations. Among the mutations, events of convergent evolution with important phenotypic characteristics occurred in several independent clones. One common change, V35I, in the nuclear localization signal of the p17 protein appeared in four viruses of three different lineages. Other common alterations mapped in position E196K of the reverse transcriptase or in position S316K of the V3 loop of the gp120 residue that is associated with the X4/R5 phenotype. Together with this mutational analysis, we studied the quasispecies heterogeneity of the initial and final viruses, revealing that fitness increase correlated with an augmentation in the genetic heterogeneity of viral quasispecies. However, while heterogeneity was mostly composed of synonymous (dS) mutations in the first 10 passages performed, at passage 21 it switched to nonsynonymous (dN) substitutions, with significant differences in dN − dS values between passages 11 and 21. In summary, the HIV-1 in vitro fitness recovery depicts a multiphase process occurring first by generation of mutations followed by fixation of the beneficial ones, depicting a classical Darwinian process.
Viral population fluctuations are recurrent in HIV-1 natural infections, and they have important consequences for viral evolution. During HIV-1 transmission, only one or a few variants are transmitted (29), producing a population bottleneck. Subsequent to this bottleneck, a great expansion of the viral population occurs in the infected individual which results in the fitness recovery of the virus (36). This increase in viral size and the high levels of polymerase errors result in the generation of a swarm of mutants, known as viral quasispecies (8). These quasispecies are the target of evolution (10). The analyses of the dynamics of the fitness recovery, as well as the study of the genetic variability generated and the mutations fixed in the genomes, are important for the understanding of HIV-1 pathogenesis.
RNA viruses, because of their high generation of genetic heterogeneity, rapid replication time, and large population sizes, constitute an ideal model to study evolution (7, 9, 17). Several RNA viruses, mainly vesicular stomatitis virus (VSV), foot-and-mouth disease virus (FMDV), or Φ6, have been used in in vitro works to study viral evolution after serial passages (26, 27), plaque to plaque (Muller's ratchet) (3, 4, 25), in large or alternating population sizes (11). Moreover, quasispecies heterogeneity has been found to be implicated in viral pathogenesis in poliovirus (37), mumps (31), West Nile virus (19), and HIV (1).
To help in the understanding of the variation occurring in vivo, we have performed in vitro evolution experiments with HIV-1. In these experiments, biological clones obtained from a patient's viral isolate (30) were subjected to serial bottleneck passages which produced drastic fitness losses (42) with an unusual distribution of associated mutations (41). Subsequent large-population passages of these debilitated clones showed a rapid fitness increase in only 10 passages (1, 40). We disclosed that this recovery was found to be associated with an increase in viral quasispecies heterogeneity and occasionally with an invariable consensus sequence (1).
In the present work, we have extended, until passage 21, the large-population recovery passages in 10 HIV-1 clones, two of which were passaged in duplicate (1). At passage 21, there was an increase in the global fitness and in the genetic heterogeneity of the clones. We also obtained, as previously found in passage 11, a correlation between heterogeneity and fitness. In contrast with what occurred in passage 11, at passage 21 viral populations accumulated higher levels of nonsynonymous mutations in the quasispecies. We identified in the global sequences mutations with important phenotypic traits that arose in the absence of the selective pressure of the immune system. The overall process of the in vitro fitness recovery in HIV-1, which started by an initial phase of generation of variability and was followed by the selection of the beneficial changes in the populations, can be described as a Darwinian process.
MATERIALS AND METHODS
Cells, viruses, and biological cloning.
Isolate s61, obtained in 1989 by standard coculture procedures from a perinatally infected 4-year-old boy in Madrid, Spain (30), was the origin of the HIV-1 parental population. From this viral population, six biological clones (D, E, G, H, I, and K) were derived by plating on MT-4 cells (16). In previous works, these clones were subjected to up to 15 serial plaque-to-plaque transfers, and populations D15, I15, and K15 were obtained. Clones E11, G7, and H12 became extinct before the 15th passage (42) (Fig. 1). The effects observed and the appearance of mutations in these bottleneck passages were described in references 41 and 42. For further studies, from these final plaque populations two clones were obtained from lineages D, G, I, and K and one was obtained from lineages E and H.
FIG. 1.

Genealogy of the viral clones studied. Representation of the serial plaque-to-plaque transfers (circles in the left part of the figure) performed in previous works (41, 42). One or two clones were obtained from the final populations after the plaque-to-plaque transfers and were designated D1, D2, E1, G1, G2, H1, I1, I5, K1, and K2. Large-population passages (10 and 20) with these clones (rectangles, arrows, and dots; rectangles represent culture flasks) were performed in 2.5 × 10⁶ and 5 × 10⁶ MT-4 cells. The experimental procedures and the origin of the natural isolate s61 are described in references 30 and 42 and in Materials and Methods. Viral populations are indicated by letters that identify the clone used, followed by p1 for the initial population, p11 for passage 11, and p21 for passage 21. For clones D1, E1, G1, and H1, the number 5 after the period indicates that these clones were passaged in 5 × 10⁶ MT-4 cells. Clones D1 and G1 that are grouped by keys were passaged in parallel in 2.5 × 10⁶ cells (designated A) and in 5 × 10⁶ MT-4 cells (designated B).
Large-population passages of viruses.
The resulting 10 clones, D1, D2, E1, G1, G2, H1, I1, I5, K1, and K2, which are the initial populations of the present study, were subjected to 10 large-population passages by infecting 2.5 × 10⁶ or 5 × 10⁶ MT-4 cells (Fig. 1). The titers of the viruses were determined in MT-2 cells and expressed as the 50% tissue culture infective dose (TCID50) per milliliter. Infections were performed, to minimize potential recombination events, at a low multiplicity of infection (MOI) of about 0.01 TCID50/ml. Clones D1 and G1 were passaged in parallel in 2.5 × 10⁶ and 5 × 10⁶ MT-4 cells (designated A and B, respectively, in Fig. 1). The results and characterization of the first 10 passages are summarized in reference 1. In the present work, using the same method, we performed the cultures until passage 21 (Fig. 1). Viruses were recovered from the culture supernatant when cytopathology was complete (5 to 7 days postinfection) and used to initiate the following passage, using fresh MT-4 cells (30). Cells were cultured in closed bottles, and the possibility of cross-contamination was monitored with uninfected control cultures. Enzyme-linked immunosorbent assay (ELISA) protein p24 determination was carried out in the culture supernatant with an Elecsys 2010 analyzer using a p24 detection kit (Roche Diagnostics, HIV Ag.HIV [groups M and 0] p24 antigen).
DNA extraction and complete genome sequencing.
For the determination of the consensus complete genome sequence, viral DNA was extracted from the cellular pellets by a standard phenol-chloroform method. PCRs used consisted of external and internal amplifications, using the Expand high-fidelity enzyme (Roche) with six different pairs of oligonucleotide primers that cover the entire HIV-1 genome. The sequences of the primers used in the amplifications, spanning the 5′LTR-gag (where LTR stands for long terminal repeat) (1,880 bp), pol-vpr (3,450 bp), and vpr-3′LTR (3,923 bp) regions, are described in reference 1. Both external and internal amplifications involved 35 cycles with temperatures chosen according to primer sequence. For primer location and numbering of nucleotide changes, refer to isolate HIV-1 HXB2 in the Los Alamos database (20). Sequences were determined on the two DNA strands with an ABI 3700 automatic sequencer. Multiple sequence alignments were performed using the CLUSTAL W program (35).
Fitness assay.
Relative fitness values of the viruses obtained by large-population passages were determined by growth competition experiments as previously described (17). Briefly, 105 MT-4 cells were coinfected with 103 TCID50/ml of the virus to be tested mixed at a 1:1 ratio with the reference clone (J1). Coinfections were performed in triplicate for a maximum of 5 passages. The proportion of the two viruses in each passage was quantified by GeneScan analysis. J1 contains a deletion of 45 nucleotides in the V1/V2 loop of the env gene, which allows the differentiation of the two viruses in the GeneScan analysis. The fitness values per competitive transfer series were calculated from the slope of the exponential plot, as previously described (17). The statistical significance of fitness differences between populations in each passage was tested using a slope comparison test implemented in the GraphPad software. Although fitness estimations give relative fitness values, the use of the same reference strain allows the comparison of values between viruses.
GeneScan analysis.
For fitness determination, to avoid recombination during the reverse transcriptase reaction when analyzing viruses from the culture supernatant, quantification of the viruses was performed on proviral DNA. Prior to this decision, a comparison between estimations performed on proviral DNA or from viral RNA from the culture supernatant showed no statistical differences. The region encoding the V1/V2 loops of gp120 of the competing viruses, which were different in length, was amplified by PCR using one of the primers labeled with the fluorescent dye 6-carboxyfluorescein (6-FAM). The primers used for the V1/V2 amplification were 34 (5′-6FAM-GTCACAGTCTATTATGGGGTACCTGTGT-3′) and 31 (5′-ACCTCAGTCATTACACAGGCCTGCAGCGC-3′). The PCR products were diluted 2- to 10-fold in water to obtain peak intensities in the linear range, and 1 μl of these dilutions was mixed with 9 μl of 1000 ROX size standard (Applied Biosystems) previously diluted 10-fold with formamide. Samples were run on an ABI Prism 3700 machine, and data were analyzed using GeneMapper version 4.0. Peak areas were used to calculate the proportion of each virus versus the reference virus J1 and to derive fitness.
Quasispecies analysis.
For the analysis of the mutant spectra, we selected four genomic regions that were amplified by using three primer pairs. The first pair amplified DNA positions 672 to 1363 of HXB2 (692 nucleotides) that spanned the leader sequence and the p17 protein in the gag gene. The second pair amplified DNA positions 6045 to 6734 (690 nucleotides) encompassing vpu and the V1/V2 region of env. This fragment was divided into two regions, one corresponding to the vpu gene and the other to the V1/V2 env gene. The third pair amplified DNA positions 7039 to 7641 (603 nucleotides) that comprised the V3/V4 region of env. In total, the three amplifications covered 2,005 genomic residues, or approximately 20% of the HIV-1 genome. The PCR products were cloned using TA TOPO cloning (Invitrogen), following the manufacturer's instructions. At least 20 independent clones were used to represent the viral quasispecies of every population in each passage. Nucleotide sequences from these clones were used for quasispecies characterization and for the quantification of genetic heterogeneity.
Genetic distances within quasispecies calculation.
In each region, jModelTest (28) was used to estimate the best model that fit the evolution of the sequences and to obtain the model average estimates of each evolutive parameter. There was no difference between regions in the evolutionary model best adapted to the data, which was in all cases the general time-reversible model with gamma distribution of mutations (GTR+G). Afterwards, genetic distances within quasispecies were calculated using the maximum likelihood method with the model average estimates of the parameters given by jModelTest. This calculation was performed with the PAUP software (33). As no significant differences in genetic distances were observed between gene regions within each virus and passage (repeated-measures analysis of variance [ANOVA] P value of >0.05), mean values in the four regions were used for the global analysis per passage.
Analyses of synonymous and nonsynonymous mutations within quasispecies in each region compared with the initial passage were performed by applying the modified Nei-Gojobori method (24) in the MEGA version 4.0 program (34). Values of nonsynonymous substitutions per nonsynonymous site (dN) and synonymous substitutions per synonymous site (dS) in each virus were calculated using the Jukes-Cantor model, and mean dN and dS values for each passage were tested for statistical differences.
Statistical analyses.
Data were analyzed using GraphPad Prism and PasW Statistics 18 software. For comparisons of values between passages, one-way ANOVA with repeated measures and Bonferroni's correction for multiple comparisons were used. Spearman correlation analyses were performed to study the correlation between fitness and overall heterogeneity and within passages. In addition, linear mixed-effect models were tested using maximum likelihood, taking into account the passages and random effects within viruses.
SplitsTree quasispecies networks.
Clone sequences of the quasispecies were used to perform networks in the different viral lineages using SplitsTree4 software (18). The median network method was used in order to visualize the dynamics of the quasispecies in every region of each virus, using the S61 original virus as an outgroup. Distances were measured as the number of differences.
Nucleotide sequence accession numbers.
Sequences have been deposited in GenBank with the accession numbers HM 469972 to 469983.
RESULTS
This paper describes the process of HIV-1 fitness recovery of 10 previously debilitated viral clones after large-population passages. The results of the recovery of the same clones after the initial 10 passages have been presented previously (1). This work summarizes and compares the results after 10 additional passages, until passage 21.
HIV-1 fitness increases after 20 large-population passages.
We carried out the fitness recovery of viral clones after 20 serial passages in MT-4 cells. Fitness of the initial populations at passage 1 was 0.52 ± 0.05 (mean ± standard error) and 0.79 ± 0.04 at passage 11, and in passage 21, mean fitness had increased to 1.03 ± 0.09. Using a one-way ANOVA with a repeated-measures test, followed by a Bonferroni's correction for multiple comparisons, the difference between passages 1 and 11 was significant at P values of <0.05, while between passages 1 and 21 it was even more significant, with P values of <0.0001 (Fig. 2). The difference between passages 11 and 21 was marginally significant, with a P value of 0.056. In addition to the global fitness increase throughout the passages, we observed a wider dispersion of the fitness values. Overall, these results showed that in vitro serial recovery passages produced an increase in the global fitness of the viruses.
FIG. 2.

Fitness increases throughout serial passages of HIV-1 clones. Representation of fitness values of each virus at passage 1 (circles), passage 11 (squares), and passage 21 (triangles). Mean values per passage are shown with their standard errors. Means were compared using a one-way ANOVA with a repeated-measures test followed by a Bonferroni's correction for multiple comparisons. P values of each comparison appear above the groups compared.
Apart from the global fitness increase, we also examined individual viruses, and we detected, as shown in Fig. 3, a very heterogeneous behavior. Five viruses (D1.5, G1, G1.5, H1.5, and I1) that increased their fitness at passage 11 continued improving at passage 21. Four viruses (D1, D2, E1.5, and K1) with a previous increase became stable at passage 21, one virus without previous increase was now increasing (I5), and two viruses (G2 and K2) were still unable to recover their fitness at passage 21. In summary, 10 of the 12 viruses had increased their fitness throughout the passages; however, the different patterns of fitness recovery in each virus explained the dispersion of the global data through the passages and suggested different recovery processes.
FIG. 3.
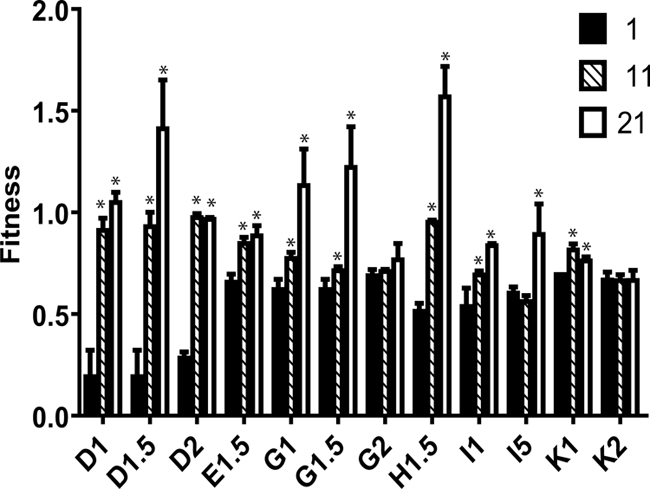
Fitness values per virus and passage. Biological fitness values obtained by competition assays as explained in Materials and Methods. Columns represent each virus value in every passage (the patterns association with each passage are shown in the legend). *, the difference with the initial passage is statistically significant (P < 0.1) using a slope comparison test.
Viral quantification during passages.
To explore the recovery process of viruses at passage 21, we estimated their infectivity by measuring the viral titers in TCID50 and viral production by p24 protein quantification. With the exception of clone I5, which showed a decay in viral titer (Fig. 4 A), viral infectivity had not increased significantly compared with that of passage 11.
FIG. 4.

Viral titers and p24 protein production during serial passages. (A) Viral titers of viruses at passages 1, 11, and 21. Titers were obtained by infecting MT-2 cells with the corresponding supernatants and expressed as TCID50 (see Materials and Methods). To compare the mean values, a one-way ANOVA with a repeated-measures test and a Bonferroni's correction for multiple comparisons were used, and the P value is given above the data points. ns, not significant. (B) p24 protein was quantified using an indirect ELISA, as described in Materials and Methods. Mean values of passages 1, 11, and 21 are shown in pg/ml and were used to compare passages. Comparisons between passages were not significantly different using the same statistical tests. Symbols are as described in the legend to Fig. 2.
Protein p24 viral production remained constant until passage 21. However, a homogenization in values at passage 21 was observed which is illustrated by the means of the standard error (SEM), which were 2.5 × 10⁵ pg/ml in passage 1, 2.1 × 10⁵ pg/ml in passage 11, and 0.8 × 10⁵ pg/ml in passage 21 (Fig. 4B). These results point to an optimization of the viral production indicated by the increase in p24 in the initial cultures and the stability in viral titers through the serial passages.
Emergence and fixation of mutations in the complete genome consensus sequences at passage 21.
To study the potential causes of the fitness increase in viral clones, an analysis of mutations emerging during passages was carried out in the complete genome at the consensus sequence level. Mutations emerging during passages increased very significantly, from 24 mutations in passage 11 (1) to 95 mutations in passage 21 (including 16 alterations in common with passage 11) (Fig. 5 and Table 1). More than 80% of the changes were nonsynonymous (Table 1). Of the 24 mutations fixed in passage 11, 16 (67%) remained fixed at passage 21. Interestingly, the mutations that were not fixed reverted to the initial nucleotide before passages, showing the reemergence of these preexisting variants (data not shown). Thus, this result indicated the importance of mutations fixed at the initial passages for fitness recovery. In addition, the fitness increase observed in passage 21 was associated with a very significant augmentation of the mutations fixed in the complete genome consensus sequences.
FIG. 5.

Mutations fixed in the consensus complete sequence from viral populations at passage 21. Schematic representation based on the highlighter tool (http://www.hiv.lanl.gov/content/sequence/HIGHLIGHT/highlighter.html) of the mutations fixed in the complete genome consensus sequence in each virus studied at passage 21. Vertical lines indicate changes compared with the initial virus. Rectangles with dashed borders specify events of convergence numbered as follows: 1, G593T (in LTR); 2, V35I (in p17); 3, E196K (in RT) (G2p21 virus acquired this amino acid change through two nucleotide changes); 4, S316K (in gp120) (G1p21 and G2p21 viruses acquired this amino acid change through two nucleotide changes); 5, L16F (in p7).
TABLE 1.
Synonymous and nonsynonymous mutations fixed at passage 21a
| Type of mutation | New mutations at passage 21 |
Mutations fixed from passage 11 |
Total | ||||
|---|---|---|---|---|---|---|---|
| No. | % with NC changes | % without NC changes | No. | % with NC changes | % without NC changes | ||
| All | 79 | 100 | 16 | 100 | 95 | ||
| Nonsynonymous | 64 | 81 | 83.1 | 11 | 68.8 | 84.6 | |
| Synonymous | 13 | 16.5 | 16.9 | 2 | 12.5 | 15.4 | |
| Noncoding (NC) | 2 | 2.5 | 3 | 18.8 | |||
Number and percentage of synonymous and nonsynonymous changes within the new mutations fixed at passage 21 and changes that remained fixed from passage 11. Mutations in noncoding regions are also indicated. Percentages are calculated both with these NC changes and without them.
Moreover, five events of convergence between viruses were observed (Fig. 5). Change 1 in Fig. 5 corresponds to one of the changes fixed in the LTR from a previous work (40). Another convergence event, change V35I in p17 protein (change 2 in Fig. 5), appeared in four viruses of three different lineages (G1.5, G2, I5, and K2 clones). It is important to highlight that these viruses had not accumulated common mutations during the bottleneck passages (41). Thus, no compensating effect to a previous mutation can be attributed to the V35I mutation, and probably it appeared because of its beneficial effect on fitness. This position has been associated with fitness recovery of protease inhibitor resistance mutants (15). This change is located in the C end of an α-helix corresponding to the nuclear localization signal (2). Another change in the reverse transcriptase (RT) in the pol gene product in position E196K (number 3 in Fig. 5) appearing in G clones could have important effects due to its proximity to part of the enzyme catalytic site in residues 185 and 186. The S316K change (number 4 in Fig. 5) that was fixed in the V3 loop in gp160 in two G clones occurred precisely in one of the positions associated with the X4/R5 phenotypic change and with the same amino acid change (Fig. 5). Change 5 in Fig. 5, corresponding to position L16F in p7, has not been found in the literature to be associated with significant effects. It is important to point out that all these changes appeared without any external selective force operating, such as immune system or antiviral treatment. The elevated number of mutations fixed and the convergence events observed suggested a strong positive selection operating in the fitness recovery at passage 21.
Detection of deletions in the V1/V2 loop in the env gene.
All viruses, except viruses E1.5 and H1.5, had an initial length identical to that of the primary isolate (41) of 218 nucleotides in the V1/V2 loop in the env gene. Along with the emergence and fixation of mutations described, a majority of viruses (9 out of the 12 viruses passaged) (Fig. 1) acquired deletions in this region during the passages. These deletions showed diverse sizes, from 54 nucleotides in clone D2 to 6 nucleotides in K2. Some viruses presented only one dominant deleted variant (E1.5, H1.5), while others had up to six variants (K2) (Fig. 6). Once they appeared in the population, all these deleted variants, except clone K2, became dominant in the quasispecies (Fig. 6). The appearance and dominance of these deleted forms in the quasispecies support their importance for the in vitro viral fitness improvement.
FIG. 6.

Deletions in the V1/V2 region of the env gene of viruses. Emergence of genomes with deletions in the (V1/V2) region of env is represented for passages 11 and 21, expressing their frequency in the quasispecies. Nondeleted genomes are represented by filled bars, while deleted genomes are shown with white bars with black dots. The length of the deletion is indicated above its corresponding bar.
Quasispecies heterogeneity increases throughout the recovery passages.
In addition to the complete genome sequence performed at the global level, a quasispecies analysis was carried out in four genomic regions. To study quasispecies genetic heterogeneity, mean distances within quasispecies obtained by maximum likelihood, as explained in Materials and Methods, were compared between passages. Mean genetic distances increased from 3.234 × 10⁻³ ± 0.202 × 10⁻³ substitutions per site in passage 1 to 3.725 × 10⁻³ ± 0.279 × 10⁻³ substitutions per site in passage 11 and 4.345 × 10⁻³ ± 0.343 × 10⁻³ substitutions per site in passage 21 (Fig. 7). These differences, however, were only statistically significant between initial and final passages when tested using one-way ANOVA with the repeated-measures test followed by a Bonferroni's correction for multiple comparisons (P value of <0.05). We also observed an increase in the dispersion of data at passage 21, as can be observed in the SEM values. In summary, quasispecies heterogeneity has been increasingly generated throughout the large-population passages.
FIG. 7.

Quasispecies heterogeneity throughout the passages. Heterogeneity was measured as the mean genetic distance (number of substitutions per site) as explained in Materials and Methods. Quasispecies heterogeneity was analyzed using mean values of each virus in the four regions examined. Comparison between passages was performed, and P values (Bonferroni corrected) are shown above each pair of columns. ns, nonstatistically significant difference. The values, means, and standard errors per passage for viruses are shown using symbols as described in the legend to Fig. 2.
Significant global correlation between heterogeneity and fitness.
Since in the initial passages of fitness recovery we found a significant correlation between quasispecies heterogeneity and fitness (1), we carried out the same analysis at passage 21 (Fig. 8 ). We performed a Spearman correlation test among all clones studied, and a global significant correlation between fitness and heterogeneity (P < 0.0309) was obtained (Fig. 8A). This result demonstrated the importance of the generation of variability for the HIV-1 in vitro fitness recovery.
FIG. 8.

Correlation analysis between heterogeneity and biological fitness. (A) Global correlation during the passages using all heterogeneity (measured in genetic distance) and fitness values of the viruses in the three passages. Spearman correlation (top P value) and linear mixed-effect models (bottom P value) were used in order to analyze statistical significance of this relation. (B) Correlation analysis within passages. Spearman correlation was again used, and P values corresponding with their passages are shown. In passage 11, P values with (top value) and without (bottom value) the G2p11 virus are shown.
However, when we performed the same statistical test within passages, we detected a multiphase process (Fig. 8B). In the initial populations, we observed low heterogeneity and fitness, while in passage 11 a tendency of increasing heterogeneity and fitness was attained that was not significant with all viruses but became very significant (P value of 0.0233) when not taking into account virus G2p11, an outlier, because of an accumulation of mutations in vpu (Fig. 8B). At passage 21, this correlation was not significant due to three viruses (D1.5p21, G1.5p21, H1.5p21) that showed higher fitness values but decreased heterogeneity (see Fig. 8A). In all the remaining viruses, however, there was a general pattern of augmentation of heterogeneity and fitness through passages. The existence of these differences between passages led us to confirm the overall correlation previously obtained, taking into account the influence of passages. For this purpose, we tested linear mixed-effect models considering the passages as repeated measures, obtaining a correlation between heterogeneity and fitness, with a P value of 0.067 in the best model obtained by Akaike Information Criterion. The selected model included an unstructured covariance matrix of repeated effects and considered random effects within viruses. This result lowers the overall relationship between heterogeneity and fitness due to the variability of these factors throughout the passages. The different phases observed in the fitness recovery depict a dynamic process and point to the operation of different selective pressures during HIV-1 in vitro fitness recovery.
Analysis of selective forces operating in the recovery process.
To confirm this hypothesis, we performed an analysis of synonymous and nonsynonymous changes within quasispecies at different passages. Mean synonymous substitutions per synonymous site (dS) and mean nonsynonymous substitutions per nonsynonymous site (dN) values in each virus (as explained in Materials and Methods) were grouped per passage and compared using a one-way ANOVA with a repeated-measures test, followed by a Bonferroni's correction for multiple comparisons. As observed in Fig. 9, heterogeneity of viruses changed its composition throughout the passages. While in the initial passages heterogeneity was contributed mainly by synonymous mutations, in the final viruses it switched to nonsynonymous substitutions. When dN − dS values were compared, we found significant differences between passages 11 (−6.5 × 10⁻⁴ ± 2.9 × 10⁻⁴) and 21 (4.6 × 10⁻⁴ ± 3.9 × 10⁻⁴) (P value < 0.05). This analysis supports that the initial steps of the fitness recovery were dominated by purifying selection, whereas positive selection drove the evolution in the subsequent passages.
FIG. 9.

dN − dS analysis of the recovery passages. Synonymous and nonsynonymous mutations were calculated according to the Nei-Gojobori method. dN and dS were expressed using Jukes-Cantor model and are given by the number of synonymous and nonsynonymous differences from the possible number of synonymous and nonsynonymous sites. Mean dN − dS values are shown as filled areas, and stripes represent negative values.
DISCUSSION
In vitro studies provide very useful information to understand natural viral infections. This work describes fitness recovery in debilitated HIV viral clones after 20 large-population passages. At this passage, viruses had improved viral fitness, associated with an increase of the genetic heterogeneity of the viral quasispecies and with the fixation in the global complete genome sequence of multiple mutations, some providing important phenotypic characteristics.
To identify the specific causes of the fitness increase, we analyzed the complete genomic sequence of the viruses before and after the passages. In contrast to what was observed at passage 11, in which only 24 mutations were fixed among the clones, in passage 21, 79 new mutations were observed. Of interest, 16 (67%) of the mutations fixed at passage 11 were maintained at passage 21, suggesting that these mutations constituted the basis from which viral recovery started (Table 1).
The difference in fitness among clones could also be attributed to the appearance of different deletions in the V1/V2 loop (Fig. 6). The V1/V2 region of viruses at passage 1, except in E and H clones, was 218 nucleotides in length. The original s61 virus, from which all these clones were derived, also had 218 nucleotides. This is a regular length for primary isolates since the average size of this region in the Los Alamos database is about 210 nucleotides. The importance of these deletions is given by their frequency and by their imposition in the viral populations after the passages. In fact, only three of the viruses maintained the full-length loop at passage 21, in contrast with five viruses at passage 11. The imposition of the deleted genomes is not associated with a single deleted form, which only occurred in viruses E and H, but rather to a set of different deleted variants with up to six forms (viruses D2 and K2). It has been shown that viruses of subtype C with shorter V1/V2 regions are better transmitted and easier to neutralize than average (6).
Looking at the dynamics of the fitness recovery, we can describe HIV-1 fitness recovery as a multiphase process. At the selective level, what was important was the change in the composition of the mutations appearing in viral quasispecies, measured as dN − dS and shown in Fig. 9. While at passage 11 there was a dominance of synonymous changes, this pattern shifted at passage 21 to a dominance of nonsynonymous alterations, pointing to the operation of selective pressures. We used the dN − dS relationship instead of the most commonly used dN/dS ratio, because we were dealing with quasispecies sequences that are very similar. In fact, in this set of sequences, 6% of them had a zero value for dS, and as the ratio tends to infinity, these data cannot be used. However, to confirm this result, we calculated the dN/dS ratio, and the same significant difference between passages 11 and 21 with a P value of <0.05 was obtained.
To further study the dynamics of this process, we analyzed the quasispecies nucleotide sequences in a network analysis. We used this method with the sequences of the clones in each region because it allowed an excellent visualization of the viral quasispecies and its dynamics through the passages. This analysis is shown in Fig. 10 for virus H1.5 in the LTR-gag region as a representative example of other viruses and regions. H1.5 virus generated variability in the initial passages (Fig. 10A), and when a beneficial mutation arose, the A95G change in p17 (Fig. 10B), the population moved to this new point, with only a minor representation of the previous mutants (Fig. 10C). From this new point, the virus continued to generate variability, and the majority of the variants at passage 21 were in the new position (Fig. 10C). We observed in every lineage, at least in one of the regions studied, a similar pattern of evolution. All these data support the notion, as previously described (13), that the HIV-1 in vitro fitness recovery follows a Darwinian model.
FIG. 10.

Network analysis of quasispecies in LTR-gag of clone H1.5. Quasispecies sequences in the LTR-gag fragment for H1.5 virus in each passage were added sequentially in order to observe their evolution with time. SplitsTree4 was used to perform this analysis using the median network method. Distances between nodes were measured in numbers of mutations. (A) Sequences from passage 1; (B) sequences from passage 1 plus passage 11; (C) sequences from passage 1 plus sequences from passage 11 and passage 21. As a reference, distance between the outgroup S61 original virus and the central node is indicated.
The observed variability in fitness values of individual clones (Fig. 3) indicated that each virus was pursuing a different evolutive pathway. This difference was also sustained by the different mutations that each virus was incorporating (Fig. 5). However, the events of convergence found in some viruses showed the existence of common pathways in the process of recovery (Fig. 5). Of special interest were the mutations identifying the convergent events, such as V35I in p17, mutation S136K in the V3 loop of gp120 (5), and mutation E196K in the RT. It is essential to highlight that these mutations that have also been associated with important phenotypic changes were fixed in the quasispecies under in vitro conditions without any external selective pressure. These findings make clear that some phenotypic alterations, like antiretroviral resistance mutations (22, 23) among other properties, can preexist in viral populations or can be naturally generated.
We previously demonstrated that among the causes of the fitness recovery is the generation of heterogeneity in the viral quasispecies (1). This is in agreement with studies performed in other viruses (27). The importance of quasispecies diversity in pathogenesis has been demonstrated in poliovirus, where high-fidelity viral strains produced less heterogeneous and less pathogenic viral populations (37); also, the pathogenesis of a mumps vaccine strain has been related to the quasispecies heterogeneity (31). In addition, a mutant polio strain which generates a limited heterogeneity is under study as a new poliovirus vaccine candidate (38).
The role heterogeneity plays in fitness recovery, apart from supporting the theoretical concept of quasispecies, also has connections to in vivo situations. Genetic analysis of a patient's viral population has been extensively used to gain information on the in vivo HIV-1 evolution but also has been related to HIV-1 pathogenesis (13, 32, 39). Primary isolates obtained sequentially along the infection time gained fitness at a significant rate that directly correlated with viral load and HIV-1 env C2V3 diversity (36). In addition, genetic variability contributed to an optimization of the virus and of the viral envelopes (21). The role that HIV-1 genetic heterogeneity has on in vivo pathogenesis can also be explained by the role of genetic heterogeneity in fitness increase as demonstrated in our in vitro experiments (1). In this study, we verified that the fitness recovery has a crucial initial step of variation generation. This situation has a clear parallel to in vivo situations where the control of genetic variation is considered one of the most important targets for antiviral treatment and vaccine studies (14), in which the inclusion of different combinations of immunogens is under investigation (12).
This in vitro study has provided insightful information to understand the fitness recovery in HIV-1 clones after serial passages. The viruses had improved viral fitness after increasing their genetic heterogeneity and the fixation of multiple mutations and deletions. We described different factors that have to be taken into account, and we highlighted the importance of the generation of variability to fuel selection after a transmission bottleneck. This study depicts a multiphase Darwinian process of in vitro fitness recovery of HIV-1.
Acknowledgments
The helpful comments and suggestions of two anonymous reviewers are greatly appreciated, as well as the critical reading of the manuscript by Concepción Casado and Monica Gutierrez-Rivas.
Work at CNM is supported by grant SAF 2007-61036 of the Ministerio de Ciencia e Innovación, by Fundacion para la Investigacion y Prevencion del SIDA en España (FIPSE) grants 36558/06, 36641/07, 36779/08, and 360766/09, and in part by the Red Temática Cooperativa de Investigación en SIDA (Red de grupos 173) of the Fondo de Investigaciones Sanitarias de la Seguridad Social (FISss).
Footnotes
Published ahead of print on 24 November 2010.
REFERENCES
- 1.Borderia, A. V., et al. 2010. Initial fitness recovery of HIV-1 is associated with quasispecies heterogeneity and can occur without modifications in the consensus sequence. PLoS One 5:e10319. [DOI] [PMC free article] [PubMed] [Google Scholar]
- 2.Bukrinsky, M. I., et al. 1993. A nuclear localization signal within HIV-1 matrix protein that governs infection of non-dividing cells. Nature 365:666-669. [DOI] [PMC free article] [PubMed] [Google Scholar]
- 3.Chao, L. 1990. Fitness of RNA virus decreased by Muller's ratchet. Nature 348:454-455. [DOI] [PubMed] [Google Scholar]
- 4.Clarke, D. K., et al. 1993. Genetic bottlenecks and population passages cause profound fitness differences in RNA viruses. J. Virol. 67:222-228. [DOI] [PMC free article] [PubMed] [Google Scholar]
- 5.Cornelissen, M., E. Hogervorst, F. Zorgdrager, S. Hartman, and J. Goudsmit. 1995. Maintenance of syncytium-inducing phenotype of HIV type 1 is associated with positively charged residues in the HIV type 1 gp120 V2 domain without fixed positions, elongation, or relocated N-linked glycosylation sites. AIDS Res. Hum. Retroviruses 11:1169-1175. [DOI] [PubMed] [Google Scholar]
- 6.Derdeyn, C. A., et al. 2004. Envelope-constrained neutralization-sensitive HIV-1 after heterosexual transmission. Science 303:2019-2022. [DOI] [PubMed] [Google Scholar]
- 7.Domingo, E., C. Escarmis, L. Menendez-Arias, and J. J. Holland. 1999. Viral quasispecies and fitness variations, p. 141-161. In E. Domingo, R. Webster, and J. Holland (ed.), Origin and evolution of viruses. Academic Press, San Diego, CA.
- 8.Domingo, E., et al. 1985. The quasispecies (extremely heterogeneous) nature of viral RNA genome populations: biological relevance—a review. Gene 40:1-8. [DOI] [PubMed] [Google Scholar]
- 9.Domingo, E., C. R. Parrish, and J. J. Holland (ed.). 2008. Origin and evolution of viruses, 2nd ed. Elsevier, London, United Kingdom.
- 10.Eigen, M. 1971. Self-organization of matter and the evolution of biological macromolecules. Naturwissenschaften 58:465-523. [DOI] [PubMed] [Google Scholar]
- 11.Elena, S. F., et al. 1996. Evolution of fitness in experimental populations of vesicular stomatitis virus. Genetics 142:673-679. [DOI] [PMC free article] [PubMed] [Google Scholar]
- 12.Fischer, W., et al. 2007. Polyvalent vaccines for optimal coverage of potential T-cell epitopes in global HIV-1 variants. Nat. Med. 13:100-106. [DOI] [PubMed] [Google Scholar]
- 13.Ganeshan, S., R. Dickover, B. T. M. Korber, Y. J. Bryson, and S. M. Wolinsky. 1997. Human immunodeficiency virus type 1 genetic evolution in children with different rates of development of disease. J. Virol. 71:663-677. [DOI] [PMC free article] [PubMed] [Google Scholar]
- 14.Gaschen, B., et al. 2002. Diversity considerations in HIV-1 vaccine selection. Science 296:2354-2360. [DOI] [PubMed] [Google Scholar]
- 15.Gatanaga, H., et al. 2002. Amino acid substitutions in Gag protein at non-cleavage sites are indispensable for the development of a high multitude of HIV-1 resistance against protease inhibitors. J. Biol. Chem. 277:5952-5961. [DOI] [PubMed] [Google Scholar]
- 16.Harada, S., Y. Koyanagi, and N. Yamamoto. 1985. Infection of HTLV-III/LAV in HTLV-I-carrying cells MT-2 and MT-4 and application in a plaque assay. Science 229:563-566. [DOI] [PubMed] [Google Scholar]
- 17.Holland, J. J., J. C. de la Torre, D. K. Clarke, and E. Duarte. 1991. Quantitation of relative fitness and great adaptability of clonal populations of RNA viruses. J. Virol. 65:2960-2967. [DOI] [PMC free article] [PubMed] [Google Scholar]
- 18.Huson, D. H., and D. Bryant. 2006. Application of phylogenetic networks in evolutionary studies. Mol. Biol. Evol. 23:254-267. [DOI] [PubMed] [Google Scholar]
- 19.Jerzak, G. V., K. Bernard, L. D. Kramer, P. Y. Shi, and G. D. Ebel. 2007. The West Nile virus mutant spectrum is host-dependant and a determinant of mortality in mice. Virology 360:469-476. [DOI] [PMC free article] [PubMed] [Google Scholar]
- 20.Kuiken, C., et al. 2009. HIV sequence compendium 2009. Theoretical Biology and Biophysics, Los Alamos National Laboratory, Los Alamos, NM.
- 21.Lassen, K. G., et al. 2009. Elite suppressor-derived HIV-1 envelope glycoproteins exhibit reduced entry efficiency and kinetics. PLoS Pathog. 5:e1000377. [DOI] [PMC free article] [PubMed] [Google Scholar]
- 22.Najera, I., et al. 1995. pol gene quasispecies of human immunodeficiency virus: mutations associated with drug resistance in virus from patients undergoing no drug therapy. J. Virol. 69:23-31. [DOI] [PMC free article] [PubMed] [Google Scholar]
- 23.Najera, I., et al. 1994. Natural occurrence of drug resistance mutations in the reverse transcriptase of human immunodeficiency virus type 1 isolates. AIDS Res. Hum. Retroviruses 10:1479-1488. [DOI] [PubMed] [Google Scholar]
- 24.Nei, M., and T. Gojobori. 1986. Simple methods for estimating the numbers of synonymous and nonsynonymous nucleotide substitutions. Mol. Biol. Evol. 3:418-426. [DOI] [PubMed] [Google Scholar]
- 25.Novella, I. S. 2003. Contributions of vesicular stomatitis virus to the understanding of RNA virus evolution. Curr. Opin. Microbiol. 6:399-405. [DOI] [PubMed] [Google Scholar]
- 26.Novella, I. S., et al. 1995. Extreme fitness differences in mammalian and insect hosts after continuous replication of vesicular stomatitis virus in sandfly cells. J. Virol. 69:6805-6809. [DOI] [PMC free article] [PubMed] [Google Scholar]
- 27.Novella, I. S., et al. 1995. Exponential increases of RNA virus fitness during large population transmissions. Proc. Nat. Acad. Sci. U. S. A. 92:5841-5844. [DOI] [PMC free article] [PubMed] [Google Scholar]
- 28.Posada, D. 2008. jModelTest: phylogenetic model averaging. Mol. Biol. Evol. 25:1253-1256. [DOI] [PubMed] [Google Scholar]
- 29.Salazar-Gonzalez, J. F., et al. 2009. Genetic identity, biological phenotype, and evolutionary pathways of transmitted/founder viruses in acute and early HIV-1 infection. J. Exp. Med. 206:1273-1289. [DOI] [PMC free article] [PubMed] [Google Scholar]
- 30.Sanchez-Palomino, S., et al. 1993. Dilute passage promotes expression of genetic and phenotypic variants of human immunodeficiency virus type 1 in cell culture. J. Virol. 67:2938-2943. [DOI] [PMC free article] [PubMed] [Google Scholar]
- 31.Sauder, C. J., et al. 2006. Changes in mumps virus neurovirulence phenotype associated with quasispecies heterogeneity. Virology 350:48-57. [DOI] [PubMed] [Google Scholar]
- 32.Shankarappa, R., et al. 1999. Consistent viral evolutionary changes associated with the progression of human immunodeficiency virus type 1 infection. J. Virol. 73:10489-10502. [DOI] [PMC free article] [PubMed] [Google Scholar]
- 33.Swofford, D. L. 1998. PAUP*: phylogenetic analysis using parsimony (* and other methods) version 4.0 beta. Sinauer, Sunderland, MA.
- 34.Tamura, K., J. Dudley, M. Nei, and S. Kumar. 2007. MEGA4: Molecular Evolutionary Genetics Analysis (MEGA) software version 4.0. Mol. Biol. Evol. 24:1596-1599. [DOI] [PubMed] [Google Scholar]
- 35.Thompson, J. D., D. G. Higgins, and T. J. Gibson. 1994. CLUSTAL W: improving the sensitivity of progressive multiple sequence alignment through sequence weighting, position-specific gap penalties and weight matrix choice. Nucleic Acids Res. 22:4673-4680. [DOI] [PMC free article] [PubMed] [Google Scholar]
- 36.Troyer, R. M., et al. 2005. Changes in human immunodeficiency virus type 1 fitness and genetic diversity during disease progression. J. Virol. 79:9006-9018. [DOI] [PMC free article] [PubMed] [Google Scholar]
- 37.Vignuzzi, M., J. K. Stone, J. J. Arnold, C. E. Cameron, and R. Andino. 2006. Quasispecies diversity determines pathogenesis through cooperative interactions in a viral population. Nature 439:344-348. [DOI] [PMC free article] [PubMed] [Google Scholar]
- 38.Vignuzzi, M., E. Wendt, and R. Andino. 2008. Engineering attenuated virus vaccines by controlling replication fidelity. Nat. Med. 14:154-161. [DOI] [PubMed] [Google Scholar]
- 39.Wolinsky, S. M., et al. 1996. Adaptive evolution of human immunodeficiency virus-type 1 during the natural course of infection. Science 272:537-542. [DOI] [PubMed] [Google Scholar]
- 40.Yuste, E., A. V. Borderia, E. Domingo, and C. Lopez-Galindez. 2005. Few mutations in the 5′ leader region mediate fitness recovery of debilitated human immunodeficiency type 1 viruses. J. Virol. 79:5421-5427. [DOI] [PMC free article] [PubMed] [Google Scholar]
- 41.Yuste, E., C. Lopez-Galindez, and E. Domingo. 2000. Unusual distribution of mutations associated with serial bottleneck passages of human immunodeficiency virus type 1. J. Virol. 74:9546-9552. [DOI] [PMC free article] [PubMed] [Google Scholar]
- 42.Yuste, E., S. Sanchez-Palomino, C. Casado, E. Domingo, and C. Lopez-Galindez. 1999. Drastic fitness loss in human immunodeficiency virus type 1 upon serial bottleneck events. J. Virol. 73:2745-2751. [DOI] [PMC free article] [PubMed] [Google Scholar]