Summary
Ratio imaging is playing an increasingly important role in modern cell biology. Combined with ratiometric dyes or fluorescence resonance energy transfer (FRET) biosensors, the approach allows the detection of conformational changes and molecular interactions in living cells. However, the approach is conducted increasingly under limited signal-to-noise ratio (SNR), where noise from multiple images can easily accumulate and lead to substantial uncertainty in ratio values. This study demonstrates that a far more serious concern is systematic errors that generate artificially high ratio values at low SNR. Thus, uneven SNR alone may lead to significant variations in ratios among different regions of a cell. Although correct average ratios may be obtained by applying conventional noise reduction filters, such as a Gaussian filter before calculating the ratio, these filters have a limited performance at low SNR and are prone to artefacts such as generating discrete domains not found in the correct ratio image. Much more reliable restoration may be achieved with multi-resolution denoising filters that take into account the actual noise characteristics of the detector. These filters are also capable of restoring structural details and photometric accuracy, and may serve as a general tool for retrieving reliable information from low-light live cell images.
Keywords: Image processing, microscopy, wavelet
Introduction
Ratio imaging is playing an increasingly important role in modern cell biology (Bright et al., 1989; Dunn & Maxfield, 2003). The approach is widely applied in conjunction with fluorescence imaging of live cells, for example, for comparing the distribution of different components and for normalizing the effect of accessible volume on the apparent intensity in different cellular regions (Bright et al., 1989). Applications of ratio imaging increased dramatically with the introduction of vital ratiometric dyes, which respond to changes in intracellular environment with changes in the ratio between intensities at different excitation and/or emission wavelengths (Tsien, 1989). The development of biosensors based on FRET (Jares-Erijman & Jovin, 2003), where changes in the distance between donor and acceptor fluorophores may be detected as changes in the ratio between sensitized fluorescence of the acceptor and donor emission (Adams et al., 1991), has further increased the application and importance of ratio imaging.
In a typical ratio imaging experiment, images are collected at two separate wavelength channels. The background intensity, from a combination of dark counts, autofluorescence, and stray light, is estimated pixel by pixel for each channel and subtracted from the images. The resulting images are then divided pixel-wise to obtain the ratio image. Under ideal conditions this scheme appears straightforward and robust. However, when applied to live cells, ratio imaging is affected by the general constraints of live cell imaging, the most serious among which is the limited signal-to-noise ratio (SNR). Imaging noise, defined as random fluctuations or uncertainties associated with a measurement, consists of photon Poisson noise, owing to the inherent quantum nature of photons, and instrumental noise, caused by thermal emissions as well as the readout and amplification processes (Aikens et al., 1989). Several factors contribute to the limit in overall SNR in fluorescence imaging. The intensity of fluorescence is limited by the finite rate of photon absorption and re-emission, and by the weak excitation to minimize photobleaching of the probe and radiation damage to live cells. Although SNR may be improved by prolonging the exposure, such a strategy becomes impractical when imaging dynamic processes. The SNR is further limited when imaging at a very high magnification as is often essential with molecular events, which spreads the photons over a large number of pixels on the detector.
Noise affects fluorescence imaging in several ways. Graininess of a noisy image interferes with the visualization of structures. In addition, noise introduces statistical uncertainties and reduces the resolution of point objects (Shahram & Milanfar, 2003), which relies on accurate comparisons of the intensity at peaks and valleys. For operations that involve image arithmetics such as ratio imaging, noise from multiple images can build up quickly, making the final SNR far worse than that of any of the component images. The present study was conducted with two aims. The first is to show that the actual impact of noise on ratio imaging is much more serious than increasing uncertainties, by introducing large systematic bias in the value of the ratio. The second is to test the efficacy of several mathematical approaches in restoring the image quality and the accuracy and precision of ratio images.
Materials and methods
Characterization of camera noise
The detector used in the present study was a cooled, back-illuminated, electron-multiplication charge-coupled device (EMCCD) camera (Andor Ixon DU-887, South Widsor, CT; Denvir & Conroy, 2003), which combines high quantum efficiency (>80% over most of the visible spectrum) with high gain driven by a cascade of electron multiplication shift registers. However, the conclusions should be largely independent of devices. Noise characteristics of the camera were obtained by analyzing a series of images of a thin uniform layer of fluorescein solution in 80% glycerol at different illumination intensities. The variance (σ2) of intensities showed a linear dependence on the average intensity I at a given exposure time (Aikens et al., 1989; Robbins & Hadwen, 2003), as expected for CCD detectors when the signal is below the full-well capacity of the detector but high enough for the photon Poisson statistics to approximate Gaussian statistics. σ2 may thus be expressed as
| (1) |
where is the variance of dark-count images at the same exposure, A represents the multiplication factor of the instrument A/D converter and is measured as the slope of the σ2-I plot. B is the instrument baseline and may be calculated as .
Computation
The SNR for an image or for a region within an image is defined as the average intensity of the ‘truth’ image divided by the root-mean-squared error of the noisy image. For experimental images, the truth image is obtained post priori after denoising with the multi-resolution BLS-GSM (Bayesian least square–Gaussian scale mixture) filter as described later, assuming that the denoised image represents the ‘truth’. This estimate when applied to simulated images was found to be within 5% of the correct value. The SNR of simulated grey-scale images was calculated along each iso-intensity line.
The generation of simulated images, the acquisition of experimental images, and the application of Gaussian, anisotropic diffusion, or median filters were all performed with custom programs written in C++ on a Windows platform. Simulated noise was generated using the GSL scientific computation subroutines (GNU Project). For the simulation of noise, at a given pixel with true intensity I, the noise added intensity In is calculated as
| (2) |
where Poisson(x) is the Poisson random distribution function with an expectation value of x, Gaussian(σ) is the Gaussian random distribution function with an average value of 0 and standard deviation of σ, and Ran() is a random number generator that generates a real number between 0 and 1 with uniform probability. Values of A, B, and σd for an EMCCD camera were obtained according to Eq. 1 as described earlier.
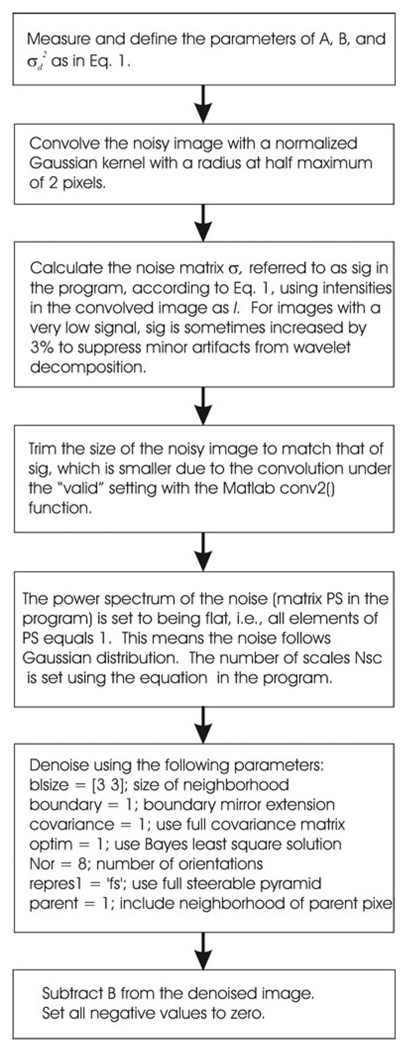
Multi-resolution BLS-GSM denoising was performed in Matlab (MathWorks, Natick, MA) according to Portilla et al. (2003), using programs downloaded from the author’s website, version 1.03. The program denoi_BLS_GSM.m was modified slightly to allow proper handling of pixel-dependent noise, by changing the noise variable sig from scalar into a matrix. All the line numbers below refer those before modification.
-
Replace line 179 “delta = sig∗delta;% Impose the desired variance to the noise”, with:
if prod(size(sig)) == 1,
delta = sig∗delta;% Impose the desired variance to the noise
else
delta = sqrt(mean2(sigˆ2))∗delta;
end
-
After line 166, “im = bound extension(im,By,Bx, ’mirror’);”, insert:
if exist(‘sig’) & prod(size(sig)) > 1,
sig = bound_extension(sig,By,Bx,’mirror’);
end
-
After line 114, “im = im(Bpy+1:end,Bpx+1:end); % add stripes only up and right”, insert:
if exist(‘sig’) & prod(size(sig)) > 1,
sig = bound_extension(sig,Bpy,Bpx,’mirror’);
sig = sig(Bpy+1:end,Bpx+1:end);
end
The main program for denoising is slightly modified from the demonstration program denoi_demo.m (see Fig. 1 for flow chart). To estimate the standard deviation at each pixel, the noisy image was first treated with a Gaussian filter with a radius of 2 pixels to obtain I in Eq. (1). After subtracting the instrument baseline B, negative values were set to zero before calculating the standard deviation σ. Output from the denoising program was again subtracted with B followed by truncation of negative values to obtain the final denoised image. Iterative deconvolution with an accelerated Lucy-Richard algorithm was performed with custom implementation and with 200 iterations.
Fig. 1.
Flow chart of the main program for BLS-GSM denoising.
Microscope samples and imaging
NIH3T3 cells were cultured in DME with 10% donor bovine serum (JRH Biological, Kansas City, MO). Cells were fixed with 4% paraformaldehyde (EM Sciences, Hatfield, PA) and stained with approximately 30 nM Alexa-488 phalloidin (Molecular Probes, Eugene, OR) in phosphate buffered saline. Polychromatic polystyrene beads were purchased from Polysciences (Warrington, PA), and were adhered to polylysine coated cover slips at 1:1000 dilution. Unattached beads were rinsed off with distilled water before filling the dish with water.
Fluorescence images were collected with a Zeiss Axiovert 200 M microscope (Carlzeiss, Thornwood, NY, USA) equipped with a 100 W quartz-halogen lamp for fluorescence excitation. Images were acquired with a 100×, N.A. 1.30, Fluar lens (Zeiss) and projected with a combination of microscope Optovar and a projection lens at the camera port (Zeiss), onto an EMCCD camera as described earlier. The intensity for fluorescence excitation was controlled by changing the lamp voltage from a stabilized DC power supply, in order to maximize the variability of intensities. The increase in intensity was however associated with an increase in lamp colour temperature. To minimize the problem of focus drift, pairs of images at different wavelengths were acquired in rapid succession with motorized fluorescence filter sets without readjusting the microscope focus.
Results
Noised-induced systematic errors in ratio imaging
Random noise in images causes not only fluctuations in the resulting ratio image but also serious systematic errors of the apparent ratio values. The effects may be readily understood and estimated using simple probability analyses. In the presence of noise and assuming the intensities at two channels x and y are independent of each other, the expected value of x/y may be expressed as
| (3) |
where P() is the probability density function and E() is the expected value. Since E(1/y) = ∫ P(y)(1/y) dy is not equal to the reciprocal of the expected value of y, 1/E(y) = 1/ ∫ P(y)yd y, E(x/y) is not equal to E(x)/E(y) as one might expect. Moreover, because of the very high values of 1/y as y is driven towards zero by the noise, ∫ P(y)(1/y) dy can be substantially larger than 1/ ∫ P(y)yd y, which in turn causes E(x/y) to be larger than E(x)/E(y) in a noise-dependent manner.
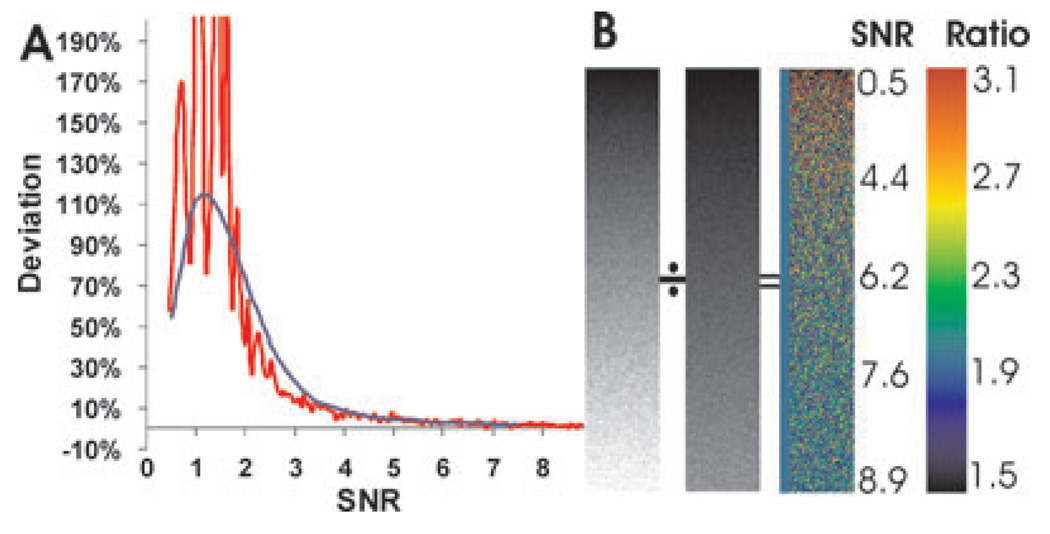
This systematic error may be calculated if the noise follows Gaussian distribution. The deviation of E(x/y) from E(x)/E(y) became a function of the SNR, and may be estimated either by Taylor series expansion as described by van Kempen & van Vliet (2000) or by direct numerical integration. The former is an approximation valid only for low-noise situations, and as a result shows only a limited deviation (<10%) of E(x/y) from E(x)/E(y) (van Kempen & van Vliet, 2000). For more realistic situations in live cell imaging, where the SNR often falls below 5, direct numerical integration yielded a better estimate, which showed a much higher systematic error (blue line in Fig. 2A) that rose sharply as SNR dropped below 3 and reached approximately 100% when SNR was near 1.
Fig. 2.
Estimation of noise-induced systematic error in ratio imaging. Systematic error relative to the correct value is calculated as a function of SNR, assuming a Gaussian noise profile (A, blue curve). A more realistic estimation was obtained by dividing two grey scale images with a constant ratio, with added noise that simulates what was measured from an EMCCD camera (B). SNR (B, numbers under ‘SNR’) increases with the intensity as expected. The corresponding intensity ratio increases with decreasing intensity or SNR (A, red curve, and B; colour-coding of the ratio indicated in the scale under ‘Ratio’), reaching a peak at SNR ~1. The correct ratio (=2) as rendered in pseudo-colour is indicated as the blue bar to the left of the pseudo-colour image.
Since noise at low SNR can deviate substantially from Gaussian distribution, a more reliable estimate was carried out with Monte Carlo simulation. Two grey-scale images were generated, one exactly twice the intensity of the other (Fig. 2B). Simulated random noise, consisting of a mixture of Poisson noise and Gaussian noise as measured from an EMCCD camera (Eq. (1)), was then added to the grey scales as a function of the intensity. This created an increasing gradient of SNR as the intensity increases, as indicated in Fig. 2B. In the absence of noise, the ratio remained constant at 2 throughout the grey scale (rendered as a blue bar to the left of the pseudo-colour ratio image, Fig. 2B). However, with noise, the ratio showed a striking increase as SNR <4 (higher ratio rendered as warmer colours, Fig. 2B). The average ratio (red line in Fig. 2A), calculated across horizontal iso-intensity lines of the grey scale, deviated from the true ratio, similar to what was predicted based on Gaussian noise distribution (blue line in Fig. 2A). The simulation also showed a dramatic increase in the standard deviation of the ratio as SNR decreased below 2.
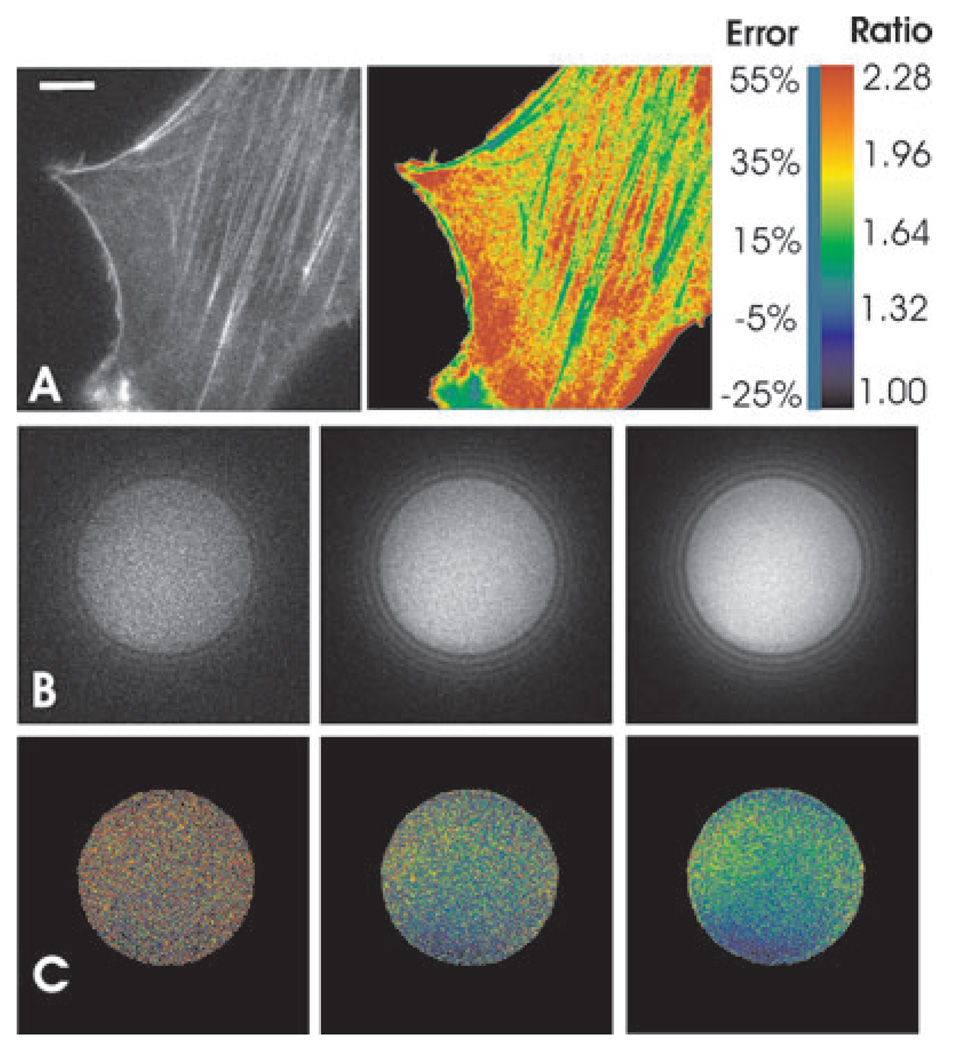
The estimated impact of noise on ratio imaging of cells is shown in Fig. 3(A), where a cell was stained with fluorescent phalloidin and imaged at a limited SNR as commonly encountered in live cell ratio imaging. Noise across the cell was estimated according to the measured intensity and the noise characteristics of the camera (Eq. (1)), and the systematic error, had this image been used as the denominator in ratio imaging, was estimated based on the theoretical curve in Fig. 2(A). Except for bright structures, most regions showed a systematic error in excess of 30%. This would lead to the erroneous conclusion that the ratio in faint regions is substantially higher than that in bright regions.
Fig. 3.
Noise-induced systematic error in fluorescence ratio imaging. Image of an NIH3T3 cell stained with Alexa-488 phalloidin is acquired at an overall SNR ~2.2 (A, left panel). Systematic error at each pixel, if this image were used as the denominator image in ratio imaging, is calculated according to the estimated local SNR and the theoretical curve shown in Fig. 2(A), and rendered in pseudo-colour (A, right panel). Colour-coding of the relative error is indicated in the colour scale (numbers under ‘Error’). The blue bar to the left of the scale indicates the colour for 0% error. Bar, 5 µm. The effect of noise in actual ratio imaging is demonstrated by taking the ratio between images of a 5.68-µm polychromatic bead acquired with a GFP (numerator image; not shown) or a YFP (denominator image; B) filter set. The YFP images have an SNR of 2.6 (left), 6.1 (middle), and 11 (right), respectively, in the bead area. Ratio image is rendered in pseudo-colour (C), as indicated in the colour scale (numbers under ‘Ratio’).
Experimental demonstration of such systematic error was carried out by imaging 6 µm polychromatic polystyrene beads at various SNR. The ratio between images acquired with GFP and YFP filter sets increased dramatically with decreasing lamp intensities (Figs 3B and C), consistent with the calculated and Monte Carlo predictions.
Restoration of ratio imaging with conventional noise reduction filters
From the sharp decrease in systematic error as SNR increases from 1 to 4 (Fig. 2A), one can expect dramatic improvements in the accuracy of ratio calculation upon even relatively modest reduction in noise. For example, by averaging intensities locally over a 3 × 3 region, which increases the SNR by a factor of , it should be possible to bring the error to an acceptable range if the initial SNR is larger than approximately 1.5.
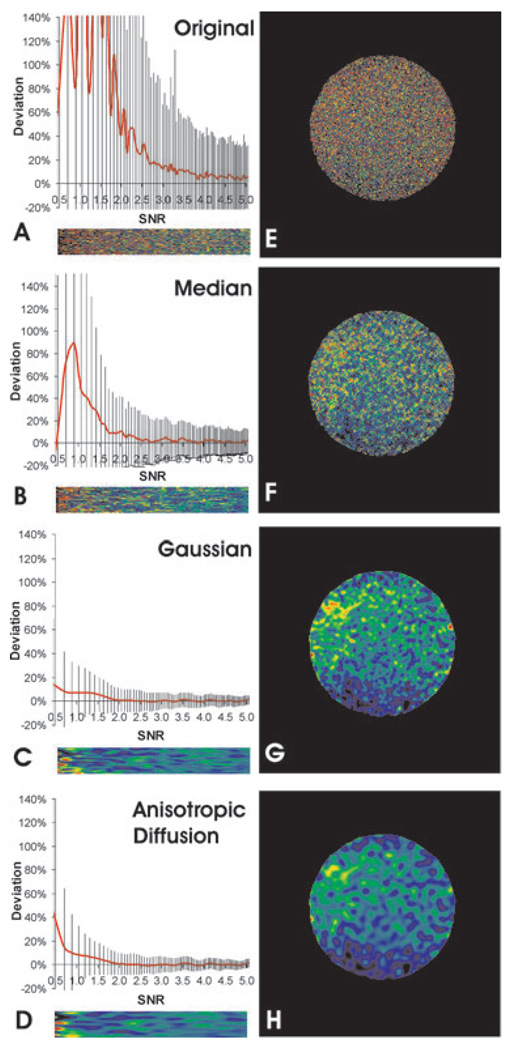
Several commonly used noise reduction filters were applied to the simulated and experimental images before calculating the ratio. As shown in Fig. 4, these filters indeed caused substantial restoration of intensity ratios towards the correct value (compare the ratios of filtered grey scales in (B)–(D) with the ratio of unfiltered grey scales in (A), and the ratios of filtered bead images in (F)–(H) with that of unfiltered images in (E)). The extent of restoration may be gauged by the SNR threshold, where the systematic error drops below 5%.Without denoising, the SNR must be at least 4.6 to obtain a correct ratio. After applying median filter with a radius of two pixels, the threshold decreased to about 2.3.With anisotropic diffusion filter or Gaussian filter, this threshold was about 1.5. Therefore, these readily available filters are capable of restoring the average ratio where SNR > 1.5.
Fig. 4.
Restoration of ratio images with conventional noise reduction filters. Noisy grey scale (A–D) or bead images (SNR of denominator image about 2.6 before noise reduction; E–H) are shown without denoising (A, E), or after noise reduction with a median filter (B, F), Gaussian filter (C, G), or anisotropic diffusion filter (D, H) before taking the ratio. Systematic error relative to the correct value is calculated for the grey-scale images as a function of initial SNR between 0.5 and 5.0 (A–D plots). Vertical lines indicate the standard deviation. The corresponding ratio image is rendered in pseudo-colour and enlarged horizontally to match the scale shown in the graph. Pseudo-colour rendering is performed according to the colour scale shown in Fig. 3. Note the dramatic restoration of average intensity ratios towards correct values, which should be blue–green in pseudo-colour for both types of images as shown in Fig. 3(A). However, although Gaussian and anisotropic diffusion filters show better restoration of ratio than the median filter, both create artefacts of discrete ratio domains.
However, as is well known in image processing (Russ, 1994), conventional noise reduction filters typically cause erosion of sharp edges and fine details. A more disturbing side effect was that despite the generation of correct average ratios in a given region, these filters tended to turn clusters of noisy pixels with stochastically similar intensities into discrete domains, which were then amplified during the calculation of ratios. Such patches were evident in the ratio images of both grey scales and bead images after filtering with Gaussian (Figs 4C and G) or anisotropic diffusion filter (Figs 4D and H), with the ratio differing by as much as 30–50% between neighbouring patches. This artefact is partially responsible for the persistently large standard deviation of the ratio even when the average ratio was very close to the correct value (vertical lines in Figs 4A–D).
Denoising with a statistically based multi-resolution filter
The limitation of conventional noise reduction filters was largely due to the lack of consideration of true noise characteristics and variable information content across the image. A class of denoising filters, referred to as multi-resolution filters, has been developed during the past decade to address the latter problem (Donoho, 1995), and some of them incorporated rigorous statistical criteria for the separation of noise from signals (Portilla et al., 2003; Puetter et al., 2005). However, although these filters have been shown to restore images with minimal degradative effects, their application in microscopy has been limited (Moss et al., 2005), and their utility in ratio imaging uncertain.
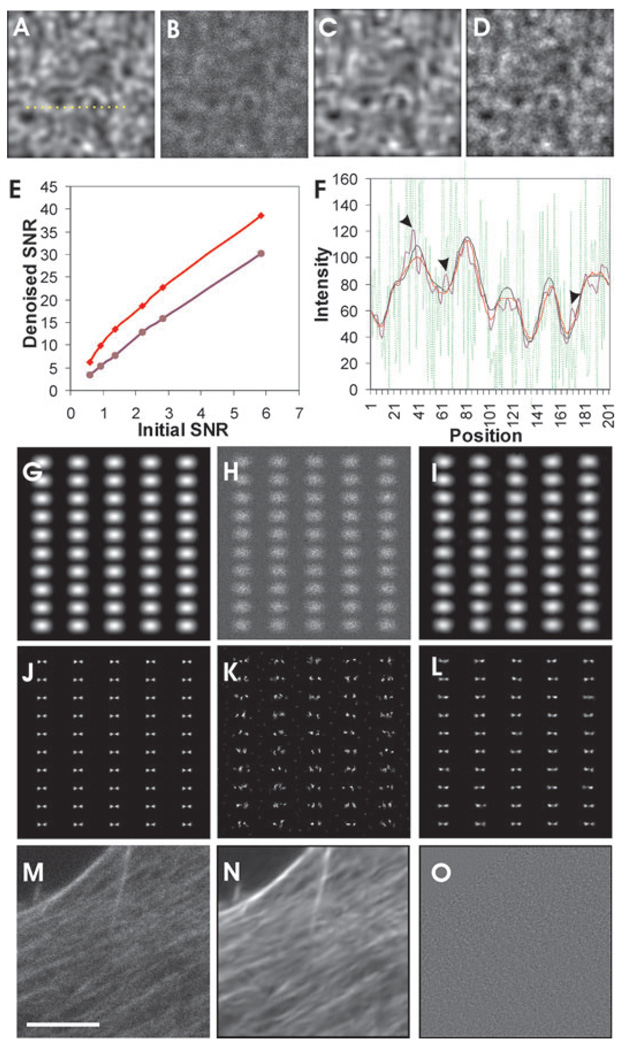
One such multi-resolution filter incorporating stringent statistical criteria, referred to as the BLS-GSM filter, was obtained in the public domain (Portilla et al., 2003; http://www.io.csic.es/PagsPers/JPortilla/denoise/software/index.htm), and modified for processing the pixel-dependent noise in the present study (see Materials and Methods). The algorithm decomposed images into sub-bands using a set of steerable wavelets, followed by denoising in each sub-band using a Bayesian least-square criterion taking into account measured noise characteristics. Its performance in restoring noisy images was first tested using simulated images consisting of 2000 zeroth-order Airy disks of 8-pixel radius (half-width at half maximal height), scattered randomly within a 300 × 300 pixel area. The overlapping Airy disks generated patterns of patches and bundle-like structures reminiscent of those encountered in fluorescent images of cells. The intensities were then scaled to different levels before a mixture of Gaussian and Poisson noise was added according to the measured characteristics of an EMCCD camera (Eq. (1)), to generate simulated images of different SNR. The ‘truth’ image and the corresponding noise-degraded image at an SNR of 1.36 are shown in Figs 5(A) and (B). Careful comparison between Figs 5(A) and (C), which shows the BLS-GSM–denoised image, indicates that the algorithm restored most if not all of the structures without introducing noticeable artefacts. In contrast, Gaussian filters generated numerous small granular structures not found in the truth image (Fig. 5D), which interfered with the detection of true intensity peaks and were responsible for the domain artefacts seen in ratio images (Figs 4C and G). Similar problem was observed with the anisotropic diffusion filter (not shown).
Fig. 5.
Denoising with a statistically based multi-resolution filter. The simulated image consists of 2000 zeroth-order Airy disks distributed randomly in an area of 300 × 300 pixels (A). Noise is added to the image according to the characteristics of an EMCCD camera, creating an image of overall SNR ~1.36 (B). The image is then denoised with either a multi-resolution BLS-GSM filter (C) or a Gaussian filter (D). Note the striking restoration of image with the BLS-GSM filter, whereas the Gaussian filter creates numerous granule-like artefacts. SNR increases by a factor of 6.6–10.3 with the BLS-GSM filter (E, red line), and by a factor of 5.2–5.8 with Gaussian filter (E, purple line). Measurement of intensity profile along a line (A, dotted line) shows large fluctuations before denoising (F, green line), relative to the true profile (F, black line). Although both filters suppress intensity fluctuations, the Gaussian filter (F, purple line) generates numerous small peaks not seen in the truth profile (F, arrowheads). The profile after processing with the BLS-GSM filter closely resembles the truth profile, with the intensities agreeing within 10% (F, red versus black lines).Application of the BLS-GSM filter to simulated noisy images of pairs of Airy disks, separated at approximately 0.6 Rayleigh resolution limit, allows the application of two-dimensional deconvolution to resolve the point sources. Noise is added to the original image (G) to generate an image of SNR <1.0 (H). Deconvolution of both the original and denoised image (I) generated similar pairs of point sources in a regular pattern. Deconvolution of the noisy image generates many extra points and poorly defined point sources (K). The same filter applied to a noisy image of an NIH3T3 cell stained with Alexa-488 phalloidin (M) dramatically restores the image, revealing many details that are originally masked by the noise (N). The difference between the original and denoised images (residual image; O) shows only random noise, indicating that little or no structures have been lost during denoising. Bar, 5 µm.
Quantitative analysis of restored images indicated that the SNR increased by a factor of 5–10 after BLS-GSM noise filtration (Fig. 5E). In addition, the restored intensities were generally within 10% of the correct value (Fig. 5F). Although Gaussian filters were able to increase the SNR by a factor of about 5, the intensity profile showed numerous small, artefactual peaks (Fig. 5F, arrowheads) that corresponded to the granular artefacts in the denoised image (Fig. 5D). To test if the denoised images were suitable for deconvolution, simulated pairs of Airy disks separated by 60% of the Rayleigh limit (Fig. 5G), were degraded with noise, mimicking that of an EMCCD camera at an overall SNR <1.0 (Fig. 5H). After denoising with the BLS-GSM algorithm (Fig. 5I), the images were deconvolved with a 2D Lucy–Richardson algorithm (Puetter et al., 2005), using the simulated Airy disk as the point spread function. As expected, deconvolution of noiseless image generated a pair of point sources (Fig. 5J). Despite the relatively high noise tolerance of the Lucy–Richardson algorithm, without prior denoising, the deconvolved image showed poorly defined point sources and artefacts (Fig. 5K). Only 60% of the pairs were resolved as doublets, and the average distance of these doublets was 125 ± 21(SD)% of the distance obtained from deconvolving noiseless images. Denoising with the BLS-GSM algorithm prior to deconvolution allowed the resolution of 98% of the pairs, with an average distance of 98 ± 11(SD)% of the correct distance (Fig. 5L). Therefore, the present approach allows potential super-resolution of noisy images although the actual precision and resolution limit is complicated by other factors such as the three-dimensionality of the point spread function, the image content and limitations of the deconvolution algorithm. A detailed investigation of denoising in deconvolution is beyond the current scope of ratio imaging.
The BLS-GSM algorithm was applied to an image of NIH3T3 cells stained with Alexa-488 phalloidin, at an overall SNR of about 2.0. Although the performance of denoising was more difficult to measure owing to the lack of reliable truth images, visual comparison showed a dramatic improvement in the image quality (Figs 5M and N). Effective separation of signals from noise was indicated by the lack of visible structures in the residual image after subtracting the denoised image from the original image (Fig. 5O).
Restoration of ratio images with multi-resolution denoising algorithm
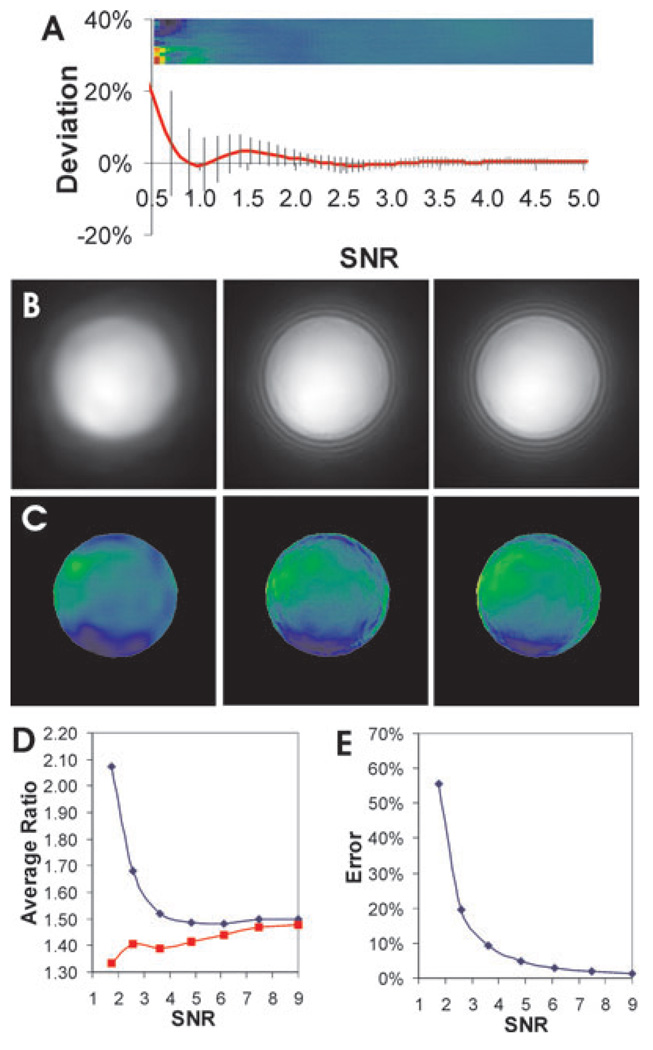
The above results suggest that multi-resolution denoising may represent an optimal solution for reliable ratio imaging at a limited SNR. The actual performance is assessed in Fig. 6. After denoising with the BLS-GSM algorithm, the ratio image of the noisy grey scales as shown in Figs 2(B) and 4(A) became essentially uniform down to SNR <1 (Fig. 6A). In addition, the image was free of artefacts until SNR dropped below 0.5. The 5% error threshold for the ratio was estimated to be at SNR ~0.7. The dramatic, artefact-free reduction in noise resulted in a much lower standard deviation of the ratio (Fig. 6A, vertical lines) compared to those denoised with conventional filters.
Fig. 6.
Restoration of ratio images with a statistically based multi-resolution filter. Noisy grey scale (A) or bead images (B–C) are processed with the BLS-GSM multi-resolution filter before taking the ratio. The relative systematic error, shown in Fig. 4(A) before denoising, is reduced dramatically to about 5% at SNR ~0.7, without introducing noticeable artefact (A). Vertical lines indicate the standard deviation, which remains <10% for SNR >1. Denoising of the denominator bead images, with an SNR of 2.6, 6.1 or 11, respectively, in the bead area before denoising (Fig. 3B), removes all the visible fine fluctuations in intensity across the surface (B). Although the ratio image is highly dependent on SNR before denoising (Fig. 3C and D, blue line), the ratio becomes nearly independent of initial SNR after denoising (D, red line). In addition, the ratio image shows no visible artefacts (C). Pseudo-colour rendering is performed according to the colour scale shown in Fig. 3. The slight non-uniformity in ratio across the bead surface is due to the shift in focal plane between the two wavelength channels. The slight increase in ratio with increasing SNR is due to the increase in lamp colour temperature. Noise-induced systematic error in image ratio may be estimated by dividing the ratio obtained with or without denoising (E). The dependence of error on SNR is similar to the predictions shown in Fig. 2.
The effect of denoising on ratio imaging of beads is shown in Figs 6(B)–(E). The ratio images of polychromatic beads, which showed a strong dependence on intensity and SNR before denoising (Fig. 2 and Fig. 6D, blue curve), became largely independent of the SNR (Figs 6C and D, red line), free of artefact as seen after applying conventional noise reduction filters (Figs 4G and H). The residual variations in ratio across the bead surface were due to a slight difference in the focal plane between the two wavelengths, which may be avoided by refocusing after changing the wavelength. By comparing the average ratio before and after denoising, noise-induced systematic error for bead images may be estimated as a function of initial SNR (Fig. 6E). This dependence proved to match closely what was obtained with Monte Carlo simulation (Fig. 2A, red curve).
Discussion
One may draw several conclusions from the present analyses. First, it is imperative to take into consideration the impact of noise when performing ratio imaging, not only for the precision of measurements but also for the accuracy, which may be affected by serious systematic errors. Striking differences in ratio may appear between regions of different intensities simply due to the differential effects of SNR. Since the systematic error came from noise in the denominator image, its SNR should be analyzed carefully according to the measured noise characteristics of the camera (Fig. 3A), to make sure that all the regions under study have an SNR >5. In addition, control experiments should be performed to rule out noise-induced systematic errors. This may involve taking multiple denominator images and calculating the ratio images among them. The ratio should be close to 1 throughout the cell. A second control may involve switching the numerator and denominator images. The ratios should be close to the reciprocal of that without switching. A third control may involve the use of probes that are expected to give a flat ratio, for example, after replacing the responsive domain to render the probe insensitive to the parameter under study. The ratio should remain flat across the cell.
When the ratio is suspected to be affected systemically by noise, the image may be collected at a lower projected magnification, which may be sufficient to increase the effective SNR to an acceptable range (>4.5) at the expense of pixel resolution, or at a longer exposure at the expense of temporal resolution and photobleaching. Alternatively, conventional noise reduction filters may be applied to control the error. If the SNR is larger than 2.5 throughout the denominator image, median filters may be used without introducing significant artefacts. If the SNR is smaller than 2.5 in any region, then more powerful filters such as Gaussian or anisotropic diffusion filter may be used to reduce the noise and restore the ratio image. However, these filters are likely to create discrete domains of ratios that are not found in the correct ratio image (Fig. 4).
To avoid artefacts and to process images with an SNR <1, which is becoming increasingly common when imaging molecular events in live cells, multi-resolution filters that incorporate rigorous statistical considerations represent the optimal solution. As the algorithm relies on accurate knowledge of the noise, the camera must be maintained under a stable condition and the noise characterized carefully, as described in the Materials and Methods section. In addition, the algorithm as implemented assumes that the noise has a uniform power spectrum. In most cases, Gaussian distribution, that is, ‘white noise’, represents a valid and verifiable assumption, although the error will increase in regions where the photon count is approximately <20 and the noise statistics can no longer be approximated with a Gaussian distribution. Otherwise, the approach appears robust for processing a wide range of microscope images, some of which are shown in the present study. A similar performance is likely with other multi-resolution algorithms (Puetter, 1995; Chang et al., 2000; Li & Orchard, 2000).
In addition to restoring ratio images, denoising should greatly facilitate low-light live cell imaging in general, by distinguishing statistically significant information from features that may arise from stochastic placements of noise pixels. Currently such distinction relies largely on the subjective judgments of the microscopist, and aspects such as the degree of structural continuity or the presence of small irregularly shaped structures can be particularly prone to confusion and controversy. Denoising should not only allow more objective interpretation of the images, but also improve the photometric precision of an image, which should in turn facilitate image deconvolution and other arithmetic operations in addition to ratio imaging.
Live cell imaging has been limited by the sensitivity of cells to radiation damage, the photobleaching of probes, and the rapid kinetics of some cellular events. Despite the advances in probe chemistry and detector technology, SNR is likely to remain a perpetual challenge as biologists push for weaker signals, faster imaging speeds, and higher magnifications. Mathematical denoising represents a powerful approach that works easily in conjunction with other technological advances, to maximize not only the amount but also the reliability of information extracted from microscope images.
Acknowledgement
The author would like to thank Dr. Rick Puetter, Pixon LLC, for stimulating discussions, and Dr. Weihui Guo for providing cultured cells. This project is supported by NIH/NIGMS grant GM32476.
References
- Adams SR, Harootunian AT, Buechler YJ, Taylor SS, Tsien RY. Fluorescence ratio imaging of cyclic AMP in single cells. Nature. 1991;349:694–697. doi: 10.1038/349694a0. [DOI] [PubMed] [Google Scholar]
- Aikens RS, Agard DG, Sedat JW. Solid state imagers for microscopy. Methods Cell Biol. 1989;29:291–313. doi: 10.1016/s0091-679x(08)60199-5. [DOI] [PubMed] [Google Scholar]
- Bright GR, Fisher GW, Rogowska J, Taylor DL. Fluorescence ratio imaging microscopy. Methods Cell Biol. 1989;30:157–192. doi: 10.1016/s0091-679x(08)60979-6. [DOI] [PubMed] [Google Scholar]
- Chang SG, Yu B, Vetterli M. Adaptive wavelet thresholding for image denoising and compression. IEEE Trans. Image Process. 2000;9:1522–1531. doi: 10.1109/83.862633. [DOI] [PubMed] [Google Scholar]
- Denvir DJ, Conroy E. Electron multiplying CCD: the new ICCD. Proc. SPIE. 2003;4796:164–174. [Google Scholar]
- Donoho DL. Denoising by soft-thresholding. IEEE Trans. Inf. Theory. 1995;41:613–627. [Google Scholar]
- Dunn K, Maxfield FR. Ratio imaging instrumentation. Methods Cell Biol. 2003;72:389–413. doi: 10.1016/s0091-679x(03)72019-6. [DOI] [PubMed] [Google Scholar]
- Jares-Erijman EA, Jovin TM. FRET imaging. Nat. Biotechnol. 2003;21:1387–1395. doi: 10.1038/nbt896. [DOI] [PubMed] [Google Scholar]
- van Kempen GMP, van Vliet LJ. Mean and variance of ratio estimators used in fluorescence ratio imaging. Cytometry. 2000;39:300–305. doi: 10.1002/(sici)1097-0320(20000401)39:4<300::aid-cyto8>3.0.co;2-o. [DOI] [PubMed] [Google Scholar]
- Li X, Orchard MT. Spatially adaptive image denoising under overcomplete expansion. Proc. IEEE Intl. Conf. Image Proc. 2000;3:300–303. [Google Scholar]
- Moss WC, Haase S, Lyle JM, Agard DA, Sedat JW. A novel 3D wavelet-based filter for visualizing features in noisy biological data. J. Microsc. 2005;219:43–49. doi: 10.1111/j.1365-2818.2005.01492.x. [DOI] [PubMed] [Google Scholar]
- Portilla J, Strela V, Wainwright MJ, Simoncelli EP. Image denoising using scale mixtures of Gaussians in the wavelet domain. IEEE Trans. Image Process. 2003;12:1338–1351. doi: 10.1109/TIP.2003.818640. [DOI] [PubMed] [Google Scholar]
- Puetter RC. Pixon-based multiresolution image reconstruction and the quantification of picture information content. Int. J. Image Sys. Tech. 1995;6:314–331. [Google Scholar]
- Puetter RC, Gosnell TR, Yahil A. Digital image reconstruction: deblurring and denoising. Annu. Rev. Astron. Astrophys. 2005;43:139–194. [Google Scholar]
- Robbins MS, Hadwen BJ. The noise performance of electron multiplying charge-coupled devices. IEEE Trans. Electron. Devices. 2003;50:1227–1232. [Google Scholar]
- Russ JC. The Image Processing Handbook. 2nd edn. Boca Raton: CRC Press; 1994. [Google Scholar]
- Shahram M, Milanfar P. Statistical analysis of achievable resolution in incoherent imaging. Proc. SPIE. 2003;5204:1–9. [Google Scholar]
- Tsien RY. Fluorescent indicators of ion concentrations. Methods Cell Biol. 1989;30:127–156. doi: 10.1016/s0091-679x(08)60978-4. [DOI] [PubMed] [Google Scholar]


