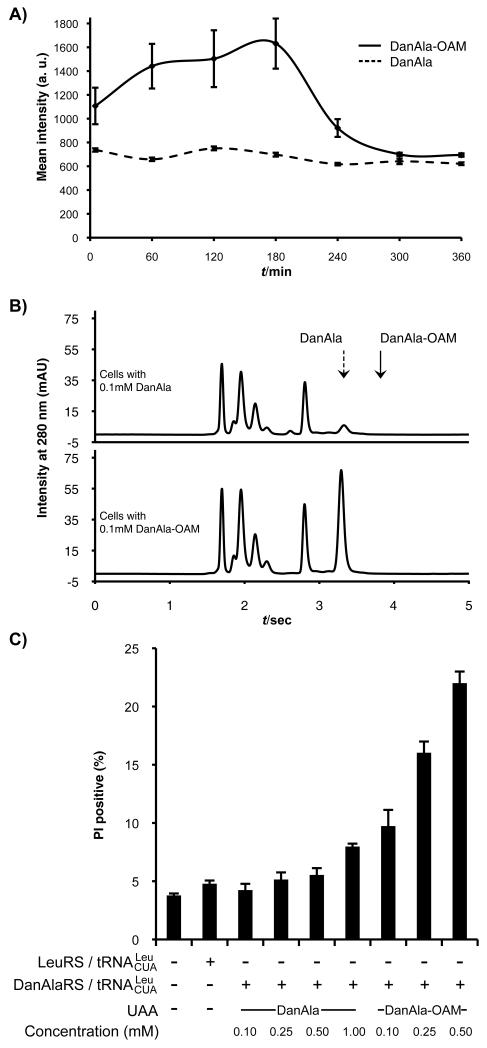
Figure 2.
(A) Cytosolic fluorescence intensity of cells incubated with 0.10 mM DanAla or DanAla-OAM. Error bars represent s.d. (B) HPLC analysis of cell extracts from cells incubated with 0.10 mM DanAla or DanAla-OAM. Arrows indicate the peak positions for DanAla and DanAla-OAM determined using pure compounds. (C) PI staining analysis of cell health at indicated conditions. Error bars represent s.e.m., n = 3.

