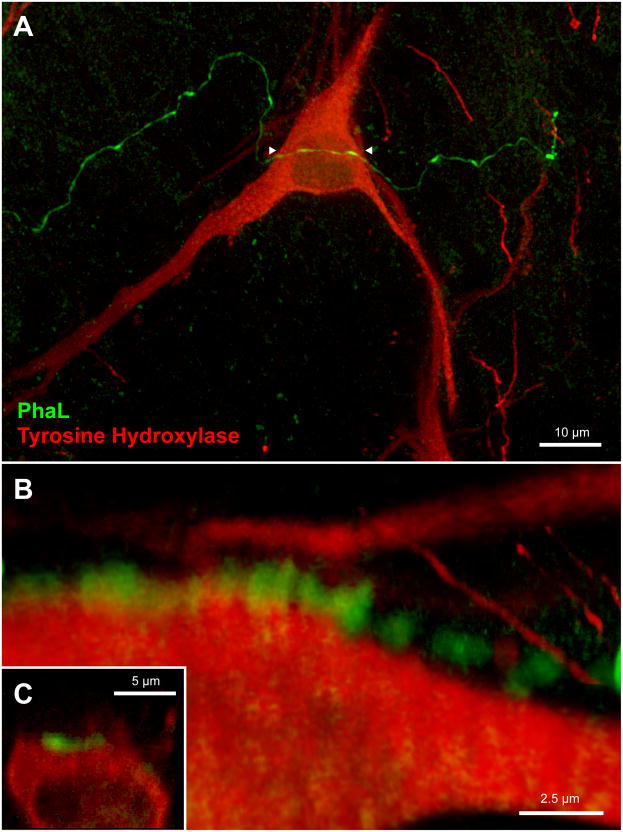
Figure 10.
Vestibular axon (green) in relation to a TH-IMF cell body in CVLM (approximately 13.3 mm caudal to Bregma). A: The varicose PhaL-filled axon courses over a TH-IMF cell body. Maximum intensity projection of a 63x confocal image stack acquired with a 2.4x zoom. B, C: multiple three-dimensional Volocity rendering rotations of the underside of the perikaryon, illustrating the series of apparent contacts (yellow patches) between the axon and the cell body. Panel B is a 3D Volocity rendering rotated 90 degrees around the x-axis; Panel C is an X–Z cut made in Volocity along the length of the PhaL axon/TH-IMF soma contact.

