

Abstract
Studies of the urothelium, the specialized epithelial lining of the urinary bladder, are critical for understanding diseases affecting the lower urinary tract, including interstitial cystitis, urinary tract infections and cancer. However, our understanding of urothelial pathophysiology has been hampered by a lack of appropriate model systems. Here, we describe the isolation and characterization of a non-transformed urothelial cell line (TRT-HU1), originally explanted from normal tissue and immortalized with hTERT, the catalytic subunit of telomerase. We demonstrate responsiveness of the cells to anti-proliferative factor (APF), a glycopeptide implicated in the pathogenesis of interstitial cystitis. TRT-HU1 carries a deletion on the short arm of chromosome 9, an early genetic lesion in development of bladder cancer. TRT-HU1 urothelial cells displayed growth and migration characteristics similar to the low-grade papilloma cell line RT4. In contrast, we observed marked differences in both phenotype and gene expression profiles between TRT-HU1 and the highly malignant T24 cell line. Together, these findings provide the first demonstration of a non-transformed, continuous urothelial cell line that responds to APF. This cell line will be valuable for studies of both benign and malignant urothelial cell biology.
Keywords: TRT-HU1, Bladder, Urothelium, APF
Introduction
Re-expression of the human telomerase reverse transcriptase (hTERT) has been employed as an effective strategy for immortalization of primary cultures of various different cell types. hTERT, which encodes the catalytic subunit of telomerase prevents age-induced shortening of telomeres, thereby preventing replicative senescence. Unlike approaches that use viral oncogenes, such as SV40 large T antigen or HPV 16 E6/E7 genes, to immortalize cells, the use of hTERT for cell immortalization results in cell lines with minimal genetic alterations and stable, non-transformed phenotypes (reviewed in Lee et al. 2004).
Several recent studies have described hTERT-immortalization of primary human urothelial cells and their subsequent characterization (Chapman et al. 2006; 2008; 2009). These studies demonstrated that forced expression of hTERT elicited efficient and highly reproducible immortalization of urothelial cells from donors of different age and gender (Chapman et al. 2006). The resulting cell lines were non-tumorigenic and did not display chromosomal abnormalities. Despite the absence of overt genomic changes, however, ectopic expression of hTERT induced marked changes in gene expression as assessed by microarray analysis (Chapman et al. 2008). In particular, Bmi1 and Sirt1, both of which are known to inhibit cellular senescence, were significantly upregulated in hTERT-immortalized cells.
In this study, we describe the isolation and characterization of a novel hTERT-immortalized, non-transformed human urothelial cell line (TRT-HU1). Features of this cell line include: (1) sensitivity to the anti-proliferative peptide (anti-proliferative factor, APF), which has been implicated in the pathogenesis of interstitial cystitis (IC) and (2) a chromosomal deletion at 9p, an early event in the development of urothelial carcinoma (UC; Fadl-Elmula et al. 2000). Based on functional evaluation in a series of assays, we conclude that these cells may serve as a valuable tool for studies of normal urothelial biology, as well as those aimed at investigating early events in development of bladder cancer and other diseases affecting the urothelium.
Materials and Methods
Tissue procurement and generation of primary urothelial cultures
Bladder tissue was obtained from five cadaveric kidney transplant donors, with no known history of bladder cancer but who were known to be smokers. Tissues were examined histologically to exclude the possibility of overt malignancy. The urothelium was separated from underlying stromal and smooth muscle components. Urothelial tissue fragments were cultured in keratinocyte medium supplemented with bovine pituitary extract and EGF according to the manufacturer's recommendation (Invitrogen, Carlsbad, CA). All tissues used for the generation of primary cultures were obtained and used with the oversight of the Cleveland Clinic Institutional Review Board committee and following informed consent of patient families or health care proxies.
Generation of hTERT-expressing urothelial cells
A self-inactivating lentiviral construct encoding the catalytic subunit of human telomerase (hTERT) was generated by the Viral Core Facility, Lerner Research Institute, Cleveland Clinic Foundation. Lentiviral supernatants from HEK293 were used to infect primary urothelial cultures from each of five individuals. Cells were then cultured in medium containing 2 μg/ml blasticidin to isolate those stably integrating the transgene. Immortalization was defined as propagation for more than 50 population doublings. The resulting cell lines were termed TRT-HU1 and TRT-HU2. Only TRT-HU1 is discussed in detail here.
Telomerase expression
Expression of telomerase following urothelial cell transduction was determined by qRT-PCR and immunoblotting. For PCR analysis, total RNA was isolated, reverse-transcribed to cDNA and amplified with gene-specific primers and the Taqman probe for telomerase using an ABI 7900HT Sequence Detection System (Applied Biosystems, Foster City, CA). Reactions were run in triplicate and standard curves were generated through a cDNA dilution series for every gene. For each sample, mean Ct values were calculated.
For immunoblot analysis, cell or tissue proteins were harvested in RIPA buffer (50 mM Tris HCl pH 8.0, 150 mM NaCl, 0.5% sodium deoxycholate, 0.1% NP-40, 0.1% SDS, 2 mM EDTA) supplemented with Protease Inhibitor Cocktail (Sigma-Aldrich, St. Louis, MO). Protein concentrations were determined using the BCA Protein Assay (Pierce Chemical Co., Rockford, IL) according to the manufacturer's protocol. Total cell extracts were resolved by SDS-PAGE and transferred to PVDF membranes. Membranes were blocked in 10% non-fat milk in phosphate-buffered saline containing 0.1% Tween 20, followed by incubation with anti-hTERT antibody (1:5000, clone Y182, Abcam, Cambridge, MA) or β-actin antibody (1:1,000, Santa Cruz Biotechnology, Santa Cruz, CA) as control for 1 h at RT. After washing and incubation with species-specific secondary antibody, signals were visualized by enhanced chemiluminescence (Immobilon Western Blotting Detection System, Millipore Corp., Billerica, MA) and exposure of membranes to X-ray film. One representative film exposure was scanned and used for densitometric analysis using the ChemiDoc EQ System and Quantity One software (BioRad Laboratories, Hercules, CA).
Cytogenetic analysis of TRT-HU1 and TRT-HU2
After 20 passages, metaphase spreads were prepared from cells for karyotyping. Briefly cells at 80–85% confluence were subjected to metaphase arrest by addition of 250 μg colcemid for 1 at 37°C. Cells were then trypsinized, rinsed with hypotonic sodium citrate/KCl solution and fixed with Carnoy's for 15 min. Fixed cells were added dropwise to slides, baked for 30 min at 90°C and stained for banding using conventional methods.
Cell culture
TRT-HU1 cells were initially propagated and maintained in keratinocyte medium supplemented with bovine pituitary extract, EGF (Invitrogen) and 2 μg/ml blasticidin. In subsequent analysis we observed more robust growth in high-glucose DMEM containing 2 mM l-glutamine and 110 mg/L sodium pyruvate supplemented with 15% fetal bovine serum, non-essential amino acids, and 1.15 mM 1-thioglycerol. T24, RT4 and TCCSUP urothelial carcinoma cells were obtained from American Type Culture Collection (Manassas, VA) and cultured in either McCoy's 5A (T24, RT4) or high-glucose DMEM (TCCSUP) supplemented with 10% FBS, 2 mM l-glutamine, and 1% antibiotic/antimycotic solution (all from Invitrogen, Carlsbad, CA). All cells were maintained in a humidified incubator at 37°C and 5% CO2.
Expression profiling of non-transformed and urothelial carcinoma cell lines
Expression profiles of TRT-HU1 and urothelial carcinoma cell lines were analyzed using Affymetrix GeneChip arrays. Briefly, RNA isolated from cells was reverse-transcribed and the resultant cDNA was used as a template for synthesis of biotin-labeled cRNA. Biotinylated cRNA was fragmented and hybridized to HG-U133A+ B Affymetrix arrays comprising more than 39,000 transcripts corresponding to >33,000 well-annotated genes (Affymetrix, Santa Clara, CA). Prior to analysis, array data were processed using Microarray Suite software to yield average difference values corresponding to signal intensity for each probe set.
Analysis of microarray data
To evaluate gene expression differences between TRT-HU1 and T24 cells, we first generated a primary gene list containing significantly different expression levels between two cell lines (TRT-HU1 vs. T24), based on p value. For these analyses we included a T24 microarray dataset generated by Theodorescu and colleagues (Havaleshko et al. 2007) and obtained from the NCBI Gene Expression Omnibus (GSE 5845). Genes with intensity values less than 100 were eliminated. Using these initial lists, the ratio of intensity values between TRT-HU1 and T24 cells was calculated, and the top 500 most differentially expressed genes were selected for subsequent analysis. The list containing genes whose expression was lower in TRT-HU1 cells than in T24 cells was used for pathway analysis. To identify pathways, networks and processes corresponding to differential gene expression between TRT-HU1 and T24 cells, we employed the MetaCore™ integrated software suite (GeneGo, St. Joseph, MI), as described previously (Di Vizio et al. 2009; Kim et al. 2009). This approach allows functional analysis of experimental data based on a proprietary manually curated database.
Phenotypic analysis of the TRT-HU1 cell line
1. Proliferation in monolayer culture
TRT-HU1, T24, and RT4 cell lines were seeded in 24-well plates at 1×10⁴/well in their respective growth media. Relative cell number was determined daily for up to 5 d using the CellTiter AQueous cell proliferation assay reagent, MTS (Promega, Inc., Madison, WI), according to the manufacturer's protocol. Briefly 0.2 ml MTS reagent was added to each well and incubated for 4 h at 37°C, 5% CO2. Absorbance was determined at 490 nm in a FLUOstar Omega microplate reader (BMG Labtech, Cary, NC).
2. Anchorage-independent growth assay
TRT-HU1 cells, RT4, TCCSUP or T24 cells were seeded at 1×10⁴ in 3 ml 0.35% agar in DMEM/FBS, overlaid on 2 ml of 0.7% agar in DMEM/FBS, in six-well plates. Plates were incubated for up to 14 d and cells were fed every 3–4 d. At the end of the assay, colonies were visualized by staining with MTT reagent and image capture using a Zeiss microscope. Colonies stained with MTT, and therefore metabolically active, comprising greater than ten cells were scored as positive by two investigators (JK and MJ). Experiments were run in triplicate for each cell line, and data are representative of two independent trials.
3. Real-time invasion assay
Invasion of TRT-HU1 cells or TCCSUP cells was monitored in real-time. Briefly, cells were stained with 1 μM FITC-dye in phenol red-free DMEM (Hyclone, Logan, UT) containing 10% FBS, for 1 h in a tissue culture incubator. Excess dye was removed by washing cells several times with serum-free medium, after which cells were trypsinized and counted. Cells (2.5×10⁵ in 400 μl serum-free medium) were seeded in trans-well inserts (8.0 μm pore size, fluorescence-blocking, PET track-etched membrane, HTS FluoroBlok™ insert, Falcon, BD Biosciences, Bedford, MA) that had been coated with Matrigel at least 1 h prior to cell seeding. Inserts were incubated in black 24-well plates in presence or absence of FBS. Fluorescence was measured every 30 min using a FLUOstar Omega microplate reader (excitation, 584 nm; emission, 620−10 nm; gain, 3,200) for 20 h at 37°C, 5% CO2.
4. Endpoint invasion assay
Matrigel-coated inserts (Millipore Corp., Billerica, MA) were rehydrated by incubation with serum-free medium at least for 1 h. 300 μl of cell suspension containing 3×10⁵ cells/ml of either TRT-HU1 cells or TCCSUP cells in serum-free media, were seeded on the upper surface of each insert, and incubated for the indicated times at 37°C, 5% CO2. Non-invasive cells were removed by gently swabbing the interior of the inserts. Cells that had invaded to the bottom surface of the inserts were stained with the cell staining solution provided by the manufacturer for 20 min. After washing the stained inserts several times with water, extraction solution containing 10% acetic acid was added. One hundred microliters of eluate was transferred to a 96-well microtiter plate and absorbance at 560 nm measured using a FLUOstar plate reader.
5. Re-differentiation assay
To determine whether TRT-HU1 cells retained the capacity for expression of epithelial markers, cells were seeded on collagen films and exposed to retinoic acid or control conditions for up to 9 d. At the end of the treatment, cells were harvested for isolation of RNA, and resulting cDNAs were amplified with gene-specific Taqman Assays-on-Demand for cytokeratin 18 and GAPDH (Applied Biosystems, Foster City, CA).
APF treatment
TRT-HU1 cells were serum-starved for 16 h and treated with 10 ng/ml native APF in serum-free medium. APF was HPLC-purified from the supernatant of bladder epithelial cells explanted from a patient diagnosed as IC (Keay et al. 2000). Mock APF was prepared using cells from an age-, race- and gender-matched normal control subjected to the same purification procedure. Medium containing fresh APF was replenished every day. Three days later, cell number was determined by crystal violet assay and p53 protein levels were assessed by immunofluorescence staining.
Indirect immunofluorescence microscopy
After treatment as indicated in figures, TRT-HU1 cells were fixed with 3% paraformaldehyde for 10 min and incubated with anti-p53 antibody in PBS/1% BSA, followed by Cy3-conjugated species-specific secondary antibody. Slides were mounted in Vectashield mounting medium containing DAPI (Vector Laboratories, Inc., Burlingame, CA) and analyzed with oil immersion objectives using a LSM 510 META NLO laser scanning confocal microscope (Carl Zeiss MicroImaging, Inc. Thornwood, NY).
Statistical analysis
Data were analyzed using a paired Student's t test. p values <0.05 were considered significant.
Results and Discussion
Infection of primary urothelial cultures with viral supernatants encoding hTERT resulted in successful isolation of antibiotic-resistant cells in two out of five cases. Cells were propagated for >50 passages without evidence of senescence, consistent with successful immortalization. In culture, the cells displayed a cobblestone morphology, characteristic of epithelial cells. We confirmed the expression of hTERT in transduced cells using immunoblot analysis (Fig. 1B). Cytogenetic analysis of 20 metaphase spreads revealed a number of chromosomal abnormalities, the most consistent of which was a deletion on the short arm of chromosome 9 (Fig. 1C). Trisomy 20 and a balanced translocation t(15;16)(q22;p13) were also observed in a subset of metaphase spreads. Furthermore 14 out of 20 cells showed terminal deletion of 8p and 5 of 20 displayed terminal deletion of 6p. The 9p chromosomal deletion has not been reported previously in other isolates of hTERT-immortalized urothelial cells. This abnormality may be highly relevant for studies related to tumor development, as loss of this chromosomal region is observed in a significant proportion of bladder cancers, particularly those of low stage and grade (Fadl-Elmula et al. 2000). This observation suggests that the TRT-HU1 and TRT-HU2 cell lines, while not tumorigenic, may be ‘pre-malignant’ in nature and therefore provide a valuable host into which genes harboring activating mutations could be introduced.
Figure 1.
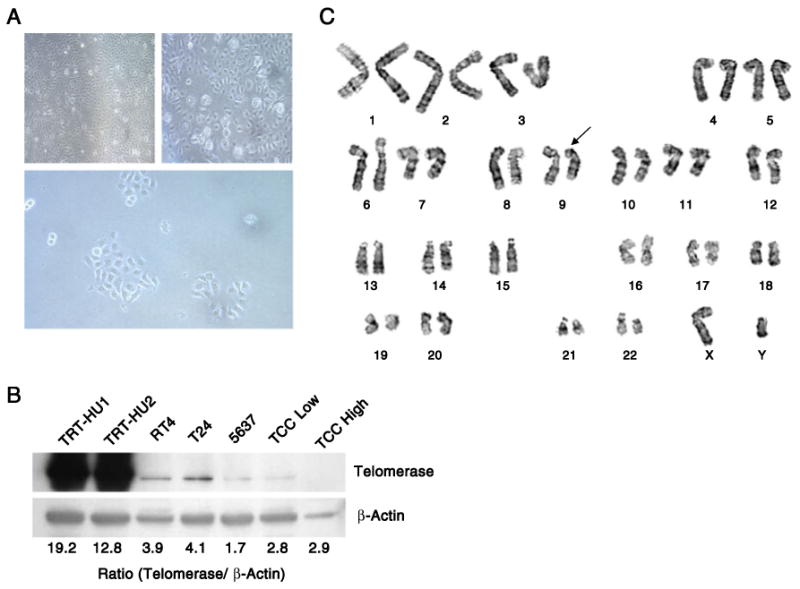
Validation of hTERT-mediated immortalization in primary urothelial cells. (A) Photomicrographs illustrating the morphology of the TRT-HU1 and TRT-HU2 cell lines (upper panels) and a subclone from one line (lower panel). (B) Immunoblot analysis for hTERT protein in the TRT-HU1 and TRT-HU2 cell lines, bladder cancer cell lines and tissue from low- and high-grade bladder cancer specimens. (C) Representative karyotype of TRT-HU1 cells. The arrow indicates a deletion on chromosome 9p.
Next we performed a series of in vitro assays to determine the utility of the TRT-HU1 cell line as a model system of normal urothelium. In anchorage-dependent and anchorage-independent growth assays, the behavior of TRT-HU1 cells was compared to that of a series of bladder cancer cell lines, ranging from the low-grade papilloma line RT4, to the more aggressive TCCSUP and T24 cell lines. The proliferation rate of TRT-HU1 cells in monolayer culture was slower than that of T24 cells and was comparable to that of RT4 cells (Fig. 2A). Also similar to RT4, TRT-HU1 cells did not form colonies in soft agar, whereas the high-grade T24 and TCCSUP cell lines showed robust colony formation (Fig. 2B). We also tested TRT-HU1 cells for their invasive capability using both kinetic and endpoint Matrigel invasion assays (Fig. 2C and D). In both formats, TRT-HU1 cells displayed a low propensity to invade even in the presence of 10% fetal bovine serum (FBS), a potent inducer of invasion. In contrast, the extent of invasion of the TCCSUP cell line, derived from a high-grade tumor, could be markedly stimulated by FBS. Together, these findings suggest that the TRT-HU1 cells behave similarly to the low-grade papillary tumor cell line RT4, and retain non-tumorigenic properties in vitro, in contrast to the aggressive urothelial carcinoma cell lines T24 and TCCSUP.
Figure 2.
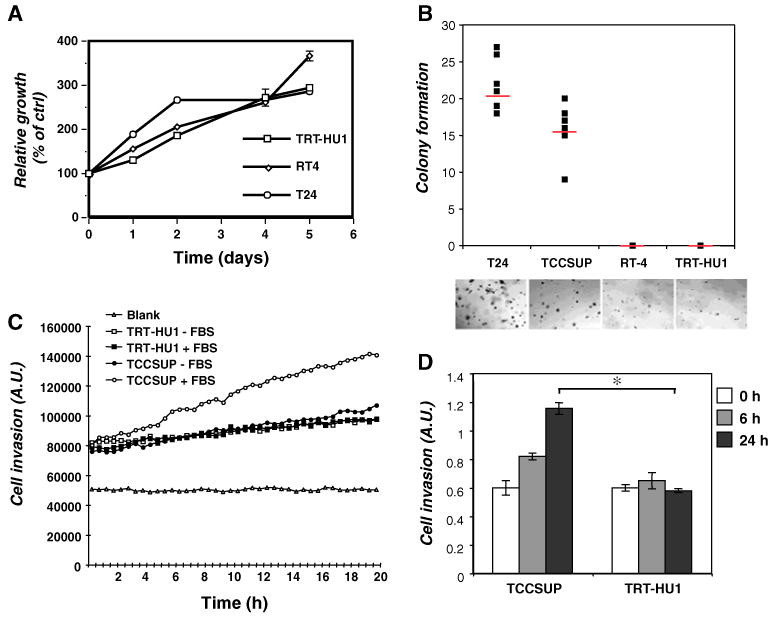
Biological characterization of TRT-HU1 cells. (A) Proliferation rates of three cell lines—TRT-HU1, RT4, and T24 cells—were compared at varying time points as indicated. (B) Anchorage-independent proliferation was determined by colony formation in soft agar. T24, TCCSUP, RT-4 and TRT-HU1 cells were used. (C) The invasive capacity of TRT-HU1 cells and TCCSUP cells was compared by kinetic analysis of cell movement through Matrigel in the absence or presence of serum stimulation. (D) In a separate assay, invasion through Matrigel in the presence of serum stimulation was measured at the indicated time points.
We also evaluated signaling in TRT-HU1 and T24 cells under log-phase growth conditions and in response to known regulators of urothelial cell growth. In growing cultures, several notable differences were evident between TRT-HU1 and T24 cells (Fig. 3A). Levels of the metabolic oncogene fatty acid synthase were markedly higher in T24 compared to TRT-HU1 cells, as were levels of phosphorylated Akt, Erk and p70 S6 kinase. TRT-HU1 cells were PTEN-positive, unlike T24, and both cell types expressed comparable levels of the epidermal growth factor receptor (EGFR). We determined the responsiveness of both cell types to two EGFR ligands, HB-EGF and EGF, both of which promote the growth of primary human urothelial cells in culture (Freeman et al. 1997). As shown in Fig. 3B, TRT-HU1 cells showed lower levels of phosphorylation of Akt and Erk in response to HB-EGF and EGF, compared to T24 cells. Interestingly, the two EGFR ligands elicited distinct patterns of pathway activation even within a given cell type, with responses to EGF sustained for a longer duration than those observed with HB-EGF. To confirm the epithelial nature of the cells we employed a re-differentiation protocol in which cells were exposed to retinoic acid (30 μM) for up to 9 d, and marker expression was assessed by qRT-PCR. As shown in Fig. 3C, TRT-HU1 cells showed a time-dependent increase in expression of cytokeratin 18 in response to retinoic acid. Expression of uroplakin 1B and 2 was also increased with retinoic acid (data not shown), consistent with the cells' urothelial origin. Next, we assessed the response of TRT-HU1 cells to APF, a small peptide isolated from the urine of patients with IC, which has been shown previously to inhibit primary urothelial cell growth (Keay et al. 2003). Exposure of TRT-HU1 cells to APF led to reduced cell proliferation by ∼45% compared to control (Fig. 3D). In addition, APF treatment of TRT-HU1 cells resulted in increased p53 expression (Fig. 3E), consistent with our previous demonstration of p53 upregulation as a key component in the anti-proliferative response of bladder epithelial cells to APF (Kim et al. 2007). This is the first demonstration that an hTERT-immortalized urothelial cell line responds to APF. We believe this may represent an important advance in studies aimed at understanding the molecular basis of IC. All of the in vitro analyses of IC conducted to date have relied on primary cultures isolated from patient biopsies, and have been limited by the finite lifespan of the cells, resulting from the inevitable replicative senescence that occurs in culture. As a result, such studies have been limited by the quantity of cells available. Development of an immortalized cell line that responds to APF will greatly facilitate larger scale analyses such as metabolomics approaches or those employing state-of-the-art quantitative proteomics that rely on isotopic labeling of cultures through many population doublings (ref SILAC paper). In future experiments, a comparison of gene expression patterns between primary non-immortalized explanted cells from IC patients and APF-treated TRT-HU1 cells will help to confirm the utility of these immortalized cells for delineating the molecular basis of this poorly understood disorder.
Figure 3.
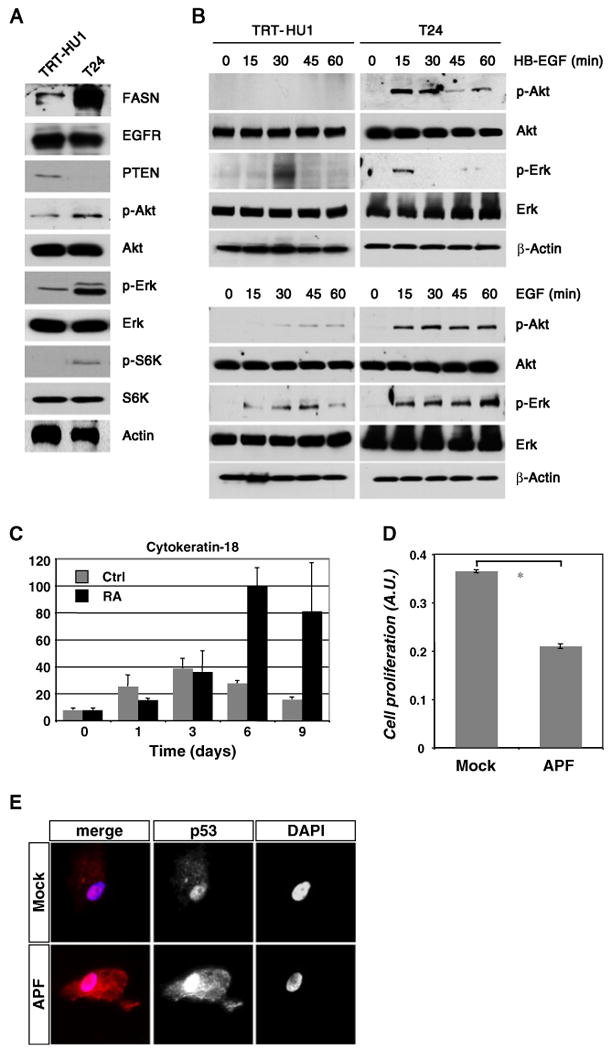
Signal transduction analysis in TRT-HU1 cells (A) Expression of well-known oncoproteins was compared in TRT-HU1 and T24 cells by immunoblot. (B) TRT-HU1 and T24 cells were serum-starved for 16 h and stimulated for the indicated times with HB-EGF (upper panels) or EGF (lower panels). Phosphorylation of Akt and Erk/MAPK were determined by immunoblot. The data reveal less potent activation of survival/proliferation signaling in TRT-HU1 cells compared to T24 cells. (C) Expression of urothelial-specific markers was assessed by qRT-PCR following treatment of TRT-HU1 cells with 30 μM retinoic acid for the indicated times. The graph shows cytokeratin 18 expression normalized to that of the housekeeping gene, GAPDH. Data represent the mean of quadruplicate determinations±standard deviation. (D) TRT-HU1 cells displayed decreased cell growth in the presence of APF compared to cells treated with mock control. (E) Immunofluorescence analysis showed greater p53 expression in TRT-HU1 cells exposed to APF compared to mock treatment (red, p53; blue, nuclei).
To obtain a more global assessment of the biology of the TRT-HU1 cell line, we compared its mRNA expression profile with that of T24 cells, which showed consistently higher activation of proliferation-related signaling pathways as well as enhanced growth in anchorage-dependent and -independent formats. The top 500 genes that were most differentially expressed between TRT-HU1 and T24 were used for pathway analysis using the MetaCore™ database as described in “Materials and methods”. Comparison of TRT-HU1 and T24 gene expression patterns revealed a marked over-representation of pathways and networks related to cell cycle transit in T24 cells relative to TRT-HU1 cells (Table 1). Similar findings were obtained with TRT-HU2 cells (data not shown). Thus, pathway analysis of microarray data yielded information in agreement with our experimental analysis of TRT-HU1 and T24 cells.
Table 1. Bioinformatics analysis of TRT-HU1 and T24 expression profiles.
| p value (−log) | ||
|---|---|---|
| GeneGo Pathway Maps | ||
| 1 | Cell cycle: chromosome condensation in prometaphase | 7.972 |
| 2 | Cell cycle: role of APC in cell cycle regulation | 7.576 |
| 3 | Cell cycle: transition and termination of DNA replication | 6.848 |
| 4 | Cell cycle: cell cycle (generic schema) | 6.568 |
| 5 | Cell cycle: nucleocytoplasmic transport of CDK/Cyclins | 6.452 |
| 6 | Cell cycle: role of Nek in cell cycle regulation | 6.353 |
| 7 | Cell cycle: start of DNA replication in early S phase | 6.353 |
| 8 | Cell cycle: spindle assembly and chromosome separation | 6.241 |
| 9 | Cell cycle: role of SCF complex in cell cycle regulation | 5.508 |
| 10 | dCTP/dUTP metabolism | 5.13 |
| GeneGo Process Networks | ||
| 1 | Cell cycle: mitosis | 15.222 |
| 2 | Cell cycle: core | 14.53 |
| 3 | Cell cycle: G2-M | 12.735 |
| 4 | Cell cycle: S phase | 10.81 |
| 5 | Cytoskeleton: spindle microtubules | 10.5 |
| 6 | Cell cycle: G1-S | 7.077 |
| 7 | DNA damage: checkpoint | 7.066 |
| 8 | Cell cycle: meiosis | 4.581 |
| 9 | DNA damage: MMR repair | 4.354 |
| 10 | DNA damage: BER-NER repair | 3.86 |
Expression profiles of TRT-HU1 cells were compared to profiles of T24 cells and analyzed using the MetaCore™ software suite. The table shows highly significant over-representation of genes involved in cell cycle regulation in T24 vs. TRT-HU1 cells, consistent with in vitro assays of cell behavior
In summary, we describe the isolation and characterization of an hTERT-immortalized urothelial cell line using a series of assays. Key findings of the study include the following: (1) the growth of TRT-HU1 cells in vitro parallels that of well-differentiated UC cells in culture in terms of growth rate and lack of colony formation in soft agar; (2) TRT-HU1 cells respond to known urothelial mitogens by activating canonical growth and survival signals, albeit to a lesser extent than aggressive UC cells; (3) deletion of the short arm of chromosome 9, an early event in urothelial carcinogenesis, suggests TRT-HU1 cells may be ‘pre-neoplastic’ and may represent an ideal host in which to test the effects of genes harboring activating mutations on bladder cancer development; (4) the IC-associated peptide APF inhibits TRT-HU1 cell growth and upregulates p53, consistent with effects seen using primary urothelial cells; (5) informatics analysis of mRNA expression profiles verifies the experimentally observed difference in cell cycle characteristics between TRT-HU1 cells and aggressive UC cells. Together, these observations suggest that the TRT-HU1 cell line described herein represents a novel model system for studies of normal urothelial cell biology, as well as studies of benign and malignant diseases of the urothelium.
Acknowledgments
This research was supported by NIH grants: R01 DK077195 (to R.M.A.); R37 DK47556, R01 DK57691, P50 DK65298 (to M.R.F.); R01 DK52596 (to S.K.K.); and research grants from the Fishbein Family IC Research Foundation/Interstitial Cystitis Association, New York Academy of Medicine, and Children's Hospital Boston Faculty Development (to J.K.).
Contributor Information
Jayoung Kim, Urological Diseases Research Center, Children's Hospital Boston, Boston, MA 02115, USA; Department of Surgery, Harvard Medical School, Boston, MA 02115, USA.
Mihee Ji, Urological Diseases Research Center, Children's Hospital Boston, Boston, MA 02115, USA; Department of Surgery, Harvard Medical School, Boston, MA 02115, USA.
Joseph A. DiDonato, Lerner Research Institute, Cleveland Clinic, 9500 Euclid Avenue, Cleveland, OH 44195, USA
Raymond R. Rackley, Lerner Research Institute, Cleveland Clinic, 9500 Euclid Avenue, Cleveland, OH 44195, USA
Mei Kuang, Lerner Research Institute, Cleveland Clinic, 9500 Euclid Avenue, Cleveland, OH 44195, USA.
Provash C. Sadhukhan, Lerner Research Institute, Cleveland Clinic, 9500 Euclid Avenue, Cleveland, OH 44195, USA
Joshua R. Mauney, Urological Diseases Research Center, Children's Hospital Boston, Boston, MA 02115, USA; Department of Surgery, Harvard Medical School, Boston, MA 02115, USA
Susan K. Keay, Department of Medicine, University of Maryland School of Medicine and VA Maryland Health Care System, Baltimore, MD 21201, USA
Michael R. Freeman, Urological Diseases Research Center, Children's Hospital Boston, Boston, MA 02115, USA; Department of Surgery, Harvard Medical School, Boston, MA 02115, USA; Department of Biological Chemistry and Pharmacology, Harvard Medical School, Boston, MA 02115, USA
Louis S. Liou, Email: Liougu@yahoo.com, Department of Pathology, Boston University School of Medicine, 670 Albany Street, Boston, MA 02118, USA.
Rosalyn M. Adam, Email: rosalyn.adam@childrens.harvard.edu, Urological Diseases Research Center, Children's Hospital Boston, Boston, MA 02115, USA; Department of Surgery, Harvard Medical School, Boston, MA 02115, USA.
References
- Chapman EJ, Hurst CD, Pitt E, Chambers P, Aveyard JS, Knowles MA. Expression of hTERT immortalises normal human urothelial cells without inactivation of the p16/Rb pathway. Oncogene. 2006;25(36):5037–5045. doi: 10.1038/sj.onc.1209513. [DOI] [PubMed] [Google Scholar]
- Chapman EJ, Kelly G, Knowles MA. Genes involved in differentiation, stem cell renewal, and tumorigenesis are modulated in telomerase-immortalized human urothelial cells. Mol Cancer Res. 2008;6(7):1154–1168. doi: 10.1158/1541-7786.MCR-07-2168. [DOI] [PMC free article] [PubMed] [Google Scholar]
- Chapman EJ, Williams SV, Platt FM, Hurst CD, Chambers P, Roberts P, Knowles MA. Integrated genomic and transcriptional analysis of the in vitro evolution of telomerase-immortalized urothelial cells (TERT-NHUC) Genes Chromosomes Cancer. 2009;48(8):694–710. doi: 10.1002/gcc.20672. [DOI] [PubMed] [Google Scholar]
- Di Vizio D, Kim J, Hager MH, Morello M, Yang W, Lafargue CJ, True LD, Rubin MA, Adam RM, Beroukhim R, Demichelis F, Freeman MR. Oncosome formation in prostate cancer: association with a region of frequent chromosomal deletion in metastatic disease. Cancer Res. 2009;69(13):5601–5609. doi: 10.1158/0008-5472.CAN-08-3860. [DOI] [PMC free article] [PubMed] [Google Scholar]
- Freeman MR, Yoo JJ, Raab G, Soker S, Adam RM, Schneck FX, Renshaw AA, Klagsbrun M, Atala A. Heparin-binding EGF-like growth factor is an autocrine growth factor for human urothelial cells and is synthesized by epithelial and smooth muscle cells in the human bladder. J Clin Invest. 1997;99(5):1028–1036. doi: 10.1172/JCI119230. [DOI] [PMC free article] [PubMed] [Google Scholar]
- Fadl-Elmula I, Gorunova L, Mandahl N, Elfving P, Lundgren R, Mitelman F, Heim S. Karyotypic characterization of urinary bladder transitional cell carcinomas. Genes Chromosomes Cancer. 2000;29(3):256–265. [PubMed] [Google Scholar]
- Havaleshko DM, Cho H, Conaway M, Owens CR, Hampton G, Lee JK, Theodorescu D. Prediction of drug combination chemosensitivity in human bladder cancer. Mol Cancer Ther. 2007;6(2):578–586. doi: 10.1158/1535-7163.MCT-06-0497. [DOI] [PubMed] [Google Scholar]
- Keay S, Kleinberg M, Zhang CO, Hise MK, Warren JW. Bladder epithelial cells from patients with interstitial cystitis produce an inhibitor of heparin-binding epidermal growth factor-like growth factor production. J Urol. 2000;164(6):2112–2118. [PubMed] [Google Scholar]
- Keay S, Zhang CO, Shoenfelt JL, Chai TC. Decreased in vitro proliferation of bladder epithelial cells from patients with interstitial cystitis. Urology. 2003;61(6):1278–1284. doi: 10.1016/s0090-4295(03)00005-0. [DOI] [PubMed] [Google Scholar]
- Kim J, Keay SK, Dimitrakov JD, Freeman MR. p53 mediates interstitial cystitis antiproliferative factor (APF)-induced growth inhibition of human urothelial cells. FEBS Lett. 2007;581(20):3795–3799. doi: 10.1016/j.febslet.2007.06.058. [DOI] [PMC free article] [PubMed] [Google Scholar]
- Kim J, Yanagihara Y, Kikugawa T, Ji M, Tanji N, Masayoshi Y, Freeman MR. A signaling network in phenylephrine-induced benign prostatic hyperplasia. Endocrinology. 2009;150(8):3576–3583. doi: 10.1210/en.2008-1782. [DOI] [PMC free article] [PubMed] [Google Scholar]
- Lee KM, Choi KH, Ouellette MM. Use of exogenous hTERT to immortalize primary human cells. Cytotechnology. 2004;45(1-2):33–38. doi: 10.1007/10.1007/s10616-004-5123-3. [DOI] [PMC free article] [PubMed] [Google Scholar]