Abstract
Biological processes often depend on protein–ligand binding events, yet accurate calculation of the associated energetics remains as a significant challenge of central importance to structure-based drug design. Recently, we have proposed that the displacement of unfavorable waters by the ligand, replacing them with groups complementary to the protein surface, is the principal driving force for protein–ligand binding, and we have introduced the WaterMap method to account this effect. However, in spite of the adage “nature abhors vacuum,” one can occasionally observe situations in which a portion of the receptor active site is so unfavorable for water molecules that a void is formed there. In this paper, we demonstrate that the presence of dry regions in the receptor has a nontrivial effect on ligand binding affinity, and suggest that such regions may represent a general motif for molecular recognition between the dry region in the receptor and the hydrophobic groups in the ligands. With the introduction of a term attributable to the occupation of the dry regions by ligand atoms, combined with the WaterMap calculation, we obtain excellent agreement with experiment for the prediction of relative binding affinities for a number of congeneric ligand series binding to the major urinary protein receptor. In addition, WaterMap when combined with the cavity contribution is more predictive than at least one specific implementation [Abel R, Young T, Farid R, Berne BJ, Friesner RA (2008) J Am Chem Soc 130:2817–2831] of the popular MM-GBSA approach to binding affinity calculation.
Keywords: dry region of cavity, protein–ligand binding affinity, hydrophobic interactions
The calculation of protein–ligand binding affinities is a central goal of computational structure-based drug design methodologies. Many different approaches, ranging from rapid empirical scoring functions to rigorous free energy perturbation methods, have been employed (1–3). At present, however, there is no method that is fully satisfactory from the point of view of both the expected accuracy and reliability, and the required computing resources.
Recently, we have introduced a unique approach to estimating relative free energies of binding of a series of congeneric ligands, based on their measured displacement of quasilocalized water molecules with unfavorable free energies in the receptor active site (4, 5). We refer to this approach as WaterMap. Molecular dynamics simulations are used to generate the positions of the relevant water sites, and inhomogeneous solvation theory is employed to estimate free energies of displacement of the various waters as compared to bulk solvent. Successful prediction of the relative binding free energies of a set of congeneric pairs of Factor Xa ligands, without the use of any adjustable parameters, was achieved, with a correlation coefficient considerably superior to an widely used alternative, the MM-GBSA approach that employed a continuum description of solvent (5, 6). A number of other applications have recently appeared, all of which yield encouraging results with regard to the efficacy of relative ligand binding affinity predictions (7–9).
Displacement of unfavorable waters by the ligand, replacing them with groups complementary to the protein surface, has been established as a principal driving force for protein–ligand binding in many systems, including a significant fraction of receptors of pharmaceutical interest (10). However, one can also occasionally observe situations in which a portion of the receptor active site is so unfavorable for water molecules that a void is formed; i.e., in the molecular dynamics runs that generated the WaterMap, regions could be identified where occupancy of water molecules was observed to be below a specified threshold. A number of proteins exhibiting a dry region in the binding pocket were discussed in ref. 11.
The presence of dry regions would be expected to have a nontrivial effect on ligand binding affinity, if the ligand places atoms in these regions (as would be highly favorable in terms of free energy if the ligand groups are complementary to the protein surface in the appropriate region). In the present paper, we investigate this issue quantitatively by obtaining from the literature a number of ligand series for ligands that bind to several proteins with dry regions, and developing a methodology to combine the WaterMap free energy difference with an additional term attributable to occupation by ligand atoms of the dry regions. Using a very simple model with essentially no adjustable parameters, excellent agreement with experiment is obtained, as compared to results derived from a WaterMap-only calculations, which fails to yield a plausible correlation of the theoretical predictions with experiment. The term for the dry region is straightforward to implement, and we expect to employ it routinely in future studies of binding affinity using this general type of approach.
In what follows, we describe the methodology, and compare results for a number of ligand series for the combined method and WaterMap alone. In Conclusion, we summarize our results and suggest future research directions.
Results and Discussion
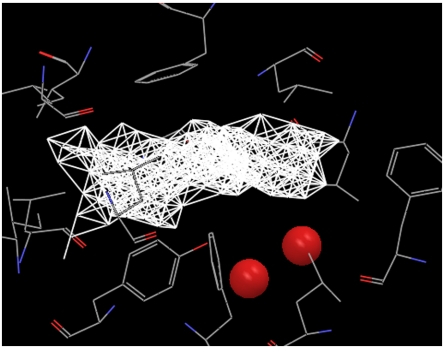
We analyzed the hydration properties of the unliganded binding pockets for several holoproteins, including the mouse major urinary protein (MUP, PDB ID 1znk) (12), the bovine apo-glycolipid transfer protein (GLTP, PDB ID 1wbe) (13), and the secretin pilot protein (PDB ID 1y9l) (14), and identified both the high occupancy hydration sites using the WaterMap program (4, 5) and the low occupancy cavity regions using the protocol described in the methods section. Fig. 1 displays the high occupancy hydration sites and the dry regions in the active site of MUP. As opposed to most proteins with well hydrated active sites, the active site of MUP is poorly hydrated, as indicated by a large dry region and only two active site water molecules, which is consistent with previous discussions (15–17).
Fig. 1.
The principal hydration sites and the dry region in the binding pocket of MUP. The two principal hydration site waters are displayed in red sphere, and the dry region is displayed by white dots connected with white lines. The side chains surrounding the binding pocket are also displayed. A large region of the binding pocket is dry.
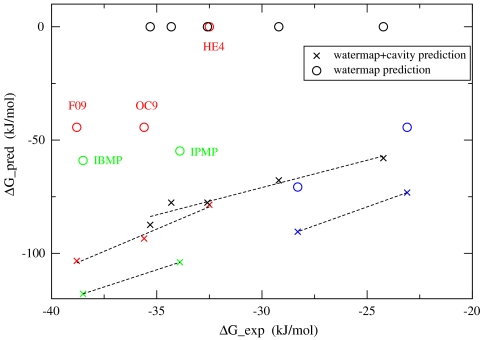
There are several ligands that bind to MUP (12, 18–20). As indicated by X-ray diffraction data, MUP is rather rigid, and the structure remains essentially unchanged upon binding to these different ligands (12). By superposition of each protein–ligand complex to the “apo” structure of the protein and accounting for the contribution to the binding affinity through displacing the active site solvent, which is the standard protocol of the WaterMap calculation, we get the WaterMap predicted binding affinity for each ligand. Fig. 2 plots the WaterMap predicted binding affinities versus the experimental results (circles in Fig. 2) for the ligands with experimental binding affinity data available from literature. The ligands are divided into four groups (indicated by four different colors in Fig. 2) based on their structure similarity and binding mode. The ligands in each group share the same scaffold and binding mode based on their PDB structures, and their experimental binding affinity data are from the same publication, and derived using the same method. [For the 2-sec-butyl-4,5-dihydrothiqazole (SBT) series of ligands, PDB structure is only available for SBT–MUP complex; all the other structures in that group were obtained by removing the appropriate carbon atoms from ligand SBT (20)]. We see from Fig. 2 that, whereas WaterMap can explain the binding affinity difference between ligand PE9 and ligand HE2 (blue circles in Fig. 2), it can not explain the binding affinity differences among the other groups of ligands (red, green, and black circles in Fig. 2). To be specific, WaterMap predicts ligand HE4 to have zero binding affinity (because the ligand displaces none of active site solvents), which is much lower than the other two ligands OC9 and F09 in that group, whereas experimentally their binding affinity difference is much smaller. In addition, WaterMap predicts that the binding affinities for ligands OC9 and F09 are the same, whereas experimentally ligand F09 is 3.2 kJ/mol more favorable than ligand OC9. Similar deficiencies are observed for ligands IBMP and IPMP, as well as for all the ligands in the SBT series.
Fig. 2.
The WaterMap and WaterMap+cavity predictions for the binding affinities of different ligands to the MUP receptor versus the experimental data. The WaterMap predictions are displayed as circles, and WaterMap+cavity predictions are displayed as crosses. The ligands belonging to different groups are indicated by different colors. Whereas the WaterMap predictions fail to rank-order most of the congeneric series of ligands, WaterMap+cavity predictions correctly rank-order all the congeneric ligands in each group.
Whereas the WaterMap calculation takes into consideration the binding affinity gain from ligand atoms displacing the energetically and entropically unfavorable hydration sites, the ligand atoms located in the dry region are not scored. It is well known that the solvation free energy of the ligand has two contributions: the free energy to create the cavity via displacement of solvent, and the free energy to turn on the interactions between the ligand and the rest of the system (21). Whereas it engenders a large free energy penalty to create a cavity in bulk water to solvate the ligand, the free energy to create the cavity in the active side of the protein is almost zero if it is dry there. So the ligand gains much binding affinity if it is located in the dry region of active site, which we call the cavity contribution. We use the scoring function described in the methods section to take this effect into consideration. The physical basis of the method is that the free energy difference of “growing” one ligand heavy atom inside the active site of the protein versus that in bulk water is the gain in binding affinity from that atom.
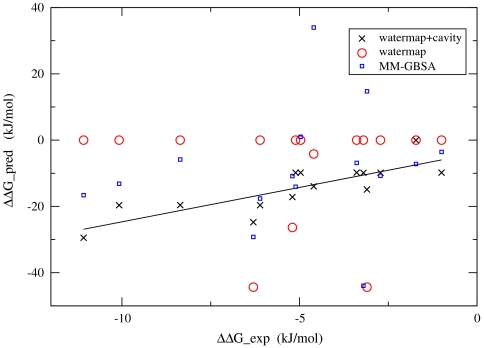
Adding together the WaterMap contribution and the cavity contribution described above for each ligand, the overall predicted binding affinities versus experimental results are displayed in Fig. 2 (crosses in Fig. 2). It is quite obvious that after taking the cavity contribution into consideration, the binding affinity differences among different ligands in each group (indicated with different colors) are correctly predicted. For comparison, the MM-GBSA predictions for the binding affinities of these ligands were also calculated, and the WaterMap combined with cavity predictions works much better than MM-GBSA predictions for all four congeneric groups (Fig. S1). If we fit the predicted results against the experimental data among each group with a line, the slopes of the lines for the four groups are of similar magnitude, but the intercepts are different. This behavior is expected. The different intercepts among the groups indicate the different strain and conformational energy and entropy changes upon protein–ligand complexation for different ligand scaffolds, which are not taken into account in this analysis and that is also part of the reason the predicted binding affinities much larger in magnitude than the experimental ones. The fact that we only take into account the favorable effects in binding either from water displacement or from favorable ligand–cavity interaction, but not the unfavorable effects such as loss of conformational entropy and part of the desolvation penalty also makes the predicted binding affinities much larger than experimental results. However, the ability of the current analysis method in rank-ordering a series of congeneric ligands makes it useful and important in lead optimization. This is clearly demonstrated in Fig. 3 where the predictions of the relative binding affinities among congeneric ligand pairs for the three methods versus experimental data are plotted, and the WaterMap combined with cavity predictions work much better than WaterMap alone and MM-GBSA method.
Fig. 3.
The WaterMap, WaterMap+cavity, and MM-GBSA predictions for the relative binding affinities among congeneric ligand pairs against experimental data. The WaterMap combined with cavity contribution predictions work much better than the other two methods, indicated by a much stronger correlation, and small intercept.
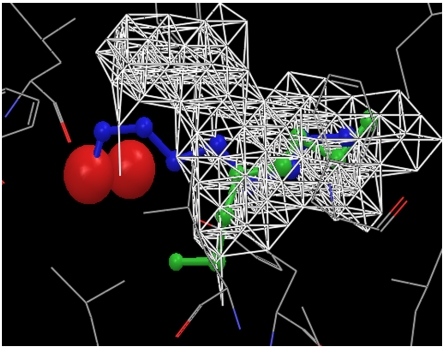
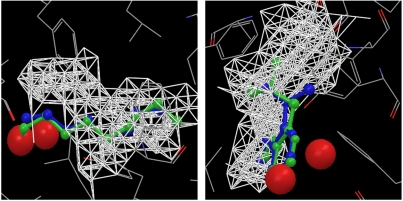
As an example of how the WaterMap and cavity contributions complement each other to rank-order a pair of congeneric ligands, Fig. 4 displays the structures of ligand HE4 (colored green) and ligand OC9 (colored blue) in the binding pocket of MUP. Whereas ligand OC9 displaces one of the two principal hydration waters (red spheres in Fig. 4), ligand HE4 does not have any overlap with the two hydration waters. This is consistent with experimental results that one more ordered water molecule is present within the binding pocket of HE4–MUP complex (12). And this is the reason why the WaterMap calculation predicts zero binding affinity for ligand HE4 and -44.3 KJ/mol for ligand OC9, whereas experimentally ligand OC9 is only 3.1 KJ/mol more favorable than ligand HE4. However, most of the atoms of ligand HE4 are located in the dry region (white networks in Fig. 4), which leads to a more favorable cavity contribution to the binding affinity for ligand HE4 than for ligand OC9 (-78.6 KJ/mol for HE4 versus -49.1 KJ/mol for OC9). So the overall binding affinity difference predicted agrees well with experimental data.
Fig. 4.
Ligands HE4 (green) and OC9 (blue) in the binding pocket of MUP. Ligand OC9 displaces one of the principal hydration water, whereas ligand HE4 does not. So the WaterMap predicted binding affinity for ligand OC9 is much more favorable than for ligand HE4, much larger than the experimentally measured binding affinity difference. However, a large portion of ligand HE4 is located in the dry region, so the cavity contribution is more favorable for ligand HE4. The experimentally measured binding affinity difference is easily explained using the combination of the WaterMap and cavity contributions.
Fig. 5A displays the structures of ligand OC9 (colored blue) and ligand F09 (colored green) in the binding pocket of MUP. Both ligands have similar structure in the hydration water part of the pocket, so the WaterMap calculation predicts their binding affinities to be the same. However, experimentally ligand F09 is 3.2 KJ/mol more favorable than ligand OC9 (12). Looking at their structures in the dry region, it is quite clear that ligand F09 has one more atom located in the dry region, which leads to the more favorable binding of ligand F09 than ligand OC9. Similar behavior is observed for ligand IBMP and ligand IPMP (Fig. 5B): One more atom of ligand IBMP in the dry region leads to the more favorable binding of ligand IBMP as compared to ligand IPMP. The binding affinity difference among the SBT series of ligands are all due to the cavity contributions.
Fig. 5.
(A) Ligands OC9 (blue) and F09 (green) in the binding pocket of MUP. They have similar structure in the principal hydration site, so the WaterMap predicts their binding affinities are the same. However, ligand F09 has one more atom located in the dry region, which leads to the stronger binding of ligand F09 than ligand OC9, verified by experimental data. (B) Ligand IBMP (green) and IPMP (blue) in the binding pocket of MUP. Ligand IBMP has one more atom located in the dry region of the pocket, leading to stronger binding of IBMP than IPMP.
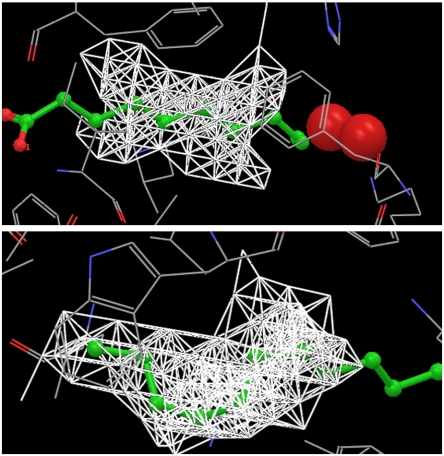
The molecular recognition between the dry region in the binding pocket and the hydrophobic groups in the ligands is not unique for MUP. (More examples of ligands with hydrophobic groups binding to the dry region of MUP receptor are given in supporting information. See Fig. S2.) In a previous work, Siebert and Hummer also observed a strong correlation between the location of conserved nonpolar groups of ligands and the low water occupancy regions in the binding surface of the IQN17 peptide, a soluble analogue of the N-peptide coiled coil (22). Fig. 6 displays the active sites of GLTP and the secretin pilot protein. In both cases, there is a large dry region in the binding pocket and a large portion of the hydrophobic groups of the ligand is located in that dry region, consistent with previous studies (11). So the dry region in the receptor and the hydrophobic groups in the ligands may represent a general motif for molecular recognition. For GLTP, the ligand is an alkane chain and the whole binding pocket is dry except the entrance. There are no principal hydration sites identified by the WaterMap calculation for this system. For secretin pilot protein, the tail of the ligand is a carboxylic group, and only the middle part of the binding pocket is dry. There are two principal hydration waters near the entrance of the pocket identified by the WaterMap calculation.
Fig. 6.
The binding pockets of the secretin pilot protein (Upper) and GLTP (Lower). In both cases, there is a large dry region in the binding pocket and a large portion of the hydrophobic groups of the ligands are located in that dry region. For GLTP, the ligand is an alkane chain and the whole binding pocket is dry except the entrance. For secretin pilot protein, the tail of the ligand is a carboxylic group, and only the middle part of the binding pocket is dry. There are two principal hydration waters near the entrance of the pocket identified by the WaterMap calculation.
Conclusion
We have augmented our WaterMap scoring function for computing free energy differences between congeneric ligands with a unique term that models the free energy gain from ligand atoms occupying dry regions of the receptor. The results of the scoring function are highly satisfactory for the data sets that we have examined, and require no adjustable parameters. Hence, our expectation is that this model will prove successful in other systems where dry regions exist.
This paper represents an initial effort to improve the core functionality embodied in the current WaterMap scoring function. There are clearly other augmentations that need to be made before the method can robustly handle a wide variety of test cases, most prominently an approach to treating protein–ligand interactions, particularly when these are not fully complementary, is required. Our objective is to systematically add new functionality, building on the success of the core approach, and render the method increasingly more accurate and reliable, while retaining the favorable computational properties that characterize the current methodology.
Methods
Our analytical effort focused on the hydration properties of the active sites of the apo proteins. The active site was defined as the region within 10 Å of where the ligand heavy atom would be but not closer than 2.8 Å to any heavy atom of the protein. We refer to this region in the following as the binding pocket.
Systems and Simulations
The starting structures for the mouse major urinary protein (MUP), the bovine apo-GLTP and the secretin pilot protein are taken from PDB with PDB IDs 1znk, 1wbe, 1y9l respectively (12–14). All the nonprotein molecules were then removed and protein preparation wizard (23) was used to modify the structures of the proteins for simulation. Protonation states were assigned assuming the systems are at pH 7.0. The proteins without the ligands, which we refer to the apo proteins, were inserted into water boxes using Maestro (24), and water molecules that sterically overlapped with the proteins were removed. The size of each system was chosen to accommodate a minimum of 10 Å of water between the protein surface and the box walls. Counter ions were added to maintain electric neutrality. The systems were then relaxed and equilibrated for a series of minimizations and short molecular dynamics simulations using the standard relaxation protocol in Desmond (25). To ensure equilibration between water in the binding pocket and bulk water, grand canonical Monte Carlo method is used to sample both the number of water molecules in the pocket and their positions using the solvate-pocket utility in Desmond during equilibration (25).
The production simulations were done in isothermal-isobaric (NPT) ensemble with a constant temperature of 300 K and 1 atmospheric pressure (26–28). The OPLS-AA force field was used for the protein, and the TIP4P water model (29) was used for the solvent, with a cut-off of 9 Å for Lennard–Jones interactions and a Particle–Mesh Ewald for electrostatic interactions (30). During the simulation the protein heavy atoms were harmonically restrained to their initial positions. Data were taken from 10 ns production simulations for MUP and 2 ns for GLTP and secretin pilot protein. Running the simulation for longer time does not change the results.
WaterMap Calculation.
The high occupancy principal hydration sites inside the binding pocket were identified and their associated enthalpy and entropy were calculated using the WaterMap program developed in our group (4, 5). To be specific, water molecules inside the binding pocket were clustered into high occupancy hydration sites each of which is a sphere of 1 Å radius, and the enthalpy and entropy for each principal hydration site water were calculated using the inhomogeneous solvation theory (31). Details of the implementation of the method are discussed in ref. 5.
Cavity Calculation.
The binding pocket is covered by a 3D grid with 1 Å spacing in each dimension. For each frame during the simulation, the positions of water oxygen atoms inside the binding pocket were recorded. If any water oxygen atom is closer than 3.3 Å to a grid point, that grid point is regarded as being occupied; otherwise the grid point is regarded as being unoccupied. In general one would have to have chosen different radii for different atom types, but here we constrained the heavy atoms of the protein so that only water molecules can enter into the cavities. Note here that, there may be more than one water molecule simultaneously occupying the same grid point, and that a given water molecule may simultaneously occupy several grid points. The probability, P0, for a grid point to be unoccupied is calculated and if it is ≥0.5 the cavity is considered to be dry. In fact, from the simulation, grid points that are identified as dry are found to be physically close to each other, and we draw a white line between neighboring dry grid and in this way identify the dry region displayed in the corresponding figures.
Note that, in bulk water there are on average 4.6 water molecules in a spherical volume of radius 3.3 Å, and the probability of this cavity being unoccupied by water is P0 ≈ 10-4. Here, 3.3 Å is the size of the united atom methane. Both the hydration free energy of a methane particle and the potential of mean force between two methane particles in neat water can be understood from information theory with a cavity of 3.3 Å radius (32). Thus grid points in the binding pocket of the protein with P0≥0.5 are clearly dry.
Protein–Ligand Binding Affinity Analysis.
The binding affinity of each ligand to the protein receptor is decomposed into the WaterMap contribution and the cavity contribution. We conducted a structure alignment between the holoprotein–ligand complex from the PDB structure and the apo protein simulated. The WaterMap contribution was calculated through the displaced solvent functional introduced in ref. 5. Ligand heavy atoms close to the principal hydration sites were assigned a score, depending on the distance from the heavy atom to the hydration site and free energy difference between water in that hydration site and bulk water. Details of the Functional are in ref. 5.
For the cavity contribution, the probability, P0, to observe an empty spherical region with radius 3.3 Å centered on each ligand heavy atom was calculated. If the probability of the cavity being unoccupied by water is greater than 0.5, the binding affinity gain for the ligand atom occupying that dry cavity is
| [1] |
Here P0 is the probability of the cavity being unoccupied, and -kT ln(P0) is the free energy to create a cavity of radius 3.3 Å inside the active site, and 2.36 kcal/mol is the solvation free energy of methane. As mentioned above, the free energy to “grow” a ligand heavy atom inside the binding pocket is the sum of the free energy to create a cavity and the free energy to turn on the interactions between that atom and the rest of the system. If the atom is in the dry region, and if the atom is nonpolar (from the simulation we found that all the ligand heavy atoms located in the dry region are nonpolar), then the free energy to turn on the interactions between that atom and the rest of the system is almost zero. (Lennard–Jones interactions are short ranged, and there are no surrounding water molecules if it is in the dry region.) So the two terms in Eq. 1 are approximately the free energy to grow a ligand heavy atom inside the binding pocket and that in bulk water, and their difference gives the contribution to the binding affinity from that atom. Here, we assume that the size of each ligand heavy atom is comparable to the size of a united atom methane. The total cavity contribution is a summation over all ligand heavy atoms located in the dry region. Note that some of the ligand heavy atoms may have partially overlapped cavities. We treat them as independent of each other, which is equivalent to assuming pairwise additivity (21). The error for this approximation is relatively small, because they overlap both in the active site and in bulk water, and there is a large cancellation for the effects. Even in the extreme case, where the cavity for a ligand heavy atom is fully overlapping with existing cavities, the free energy to create that additional cavity, which is 0 in this case, is not quite different from -kT ln(0.5) = 0.4 kcal/mol, the maximum free energy to create that cavity in the dry region, and the error in the real case is much smaller than this number.
Supplementary Material
Acknowledgments.
We thank Dr. Robert Abel for many helpful discussions. This work was supported by National Institutes of Health Grants GM 43340 (B.J.B.) and GM 52018 (R.A.F.). This work was also supported in part by the National Science Foundation through TeraGrid resources provided by the National Center for Supercomputing Applications and Abe (MCA08X002) (B.J.B. and R.A.F.).
Footnotes
The authors declare no conflict of interest.
This article contains supporting information online at www.pnas.org/lookup/suppl/doi:10.1073/pnas.1016793108/-/DCSupplemental.
References
- 1.Gilson MK, Zhou HX. Calculation of protein–ligand binding affinities. Annu Rev Biophys Biomol Struct. 2007;36:21–42. doi: 10.1146/annurev.biophys.36.040306.132550. [DOI] [PubMed] [Google Scholar]
- 2.Moble DL, Dill KA. Binding of small-molecule ligands to proteins: “What you see” is not always “what you get”. Structure. 2009;17:489–498. doi: 10.1016/j.str.2009.02.010. [DOI] [PMC free article] [PubMed] [Google Scholar]
- 3.Guvench O, MacKerell AD., Jr Computational evaluation of protein–small molecule binding. Curr Opin Struct Biol. 2009;19:56–61. doi: 10.1016/j.sbi.2008.11.009. [DOI] [PMC free article] [PubMed] [Google Scholar]
- 4.Young T, Abel R, Kim B, Berne BJ, Friesner RA. Motifs for molecular recognition exploiting hydrophobic enclosure in protein–ligand binding. Proc Nat Acad Sci USA. 2007;104:808–813. doi: 10.1073/pnas.0610202104. [DOI] [PMC free article] [PubMed] [Google Scholar]
- 5.Abel R, Young T, Farid R, Berne BJ, Friesner RA. Role of the active-site solvent in the thermodynamics of factor xa ligand binding. J Am Chem Soc. 2008;130:2817–2831. doi: 10.1021/ja0771033. [DOI] [PMC free article] [PubMed] [Google Scholar]
- 6.Massova I, Kollman P. Combined molecular mechanical and continuum solvent approach (mm-pbsa/gbsa) to predict ligand binding. Perspect Drug Discovery Des. 2000;18:113–135. [Google Scholar]
- 7.Beuming T, Farid R, Sherman W. High-energy water sites determine peptide binding affinity and specificity of pdz domains. Protein Sci. 2009;18:1609–1619. doi: 10.1002/pro.177. [DOI] [PMC free article] [PubMed] [Google Scholar]
- 8.Robinson D, Sherman W, Farid R. Understanding kinase selectivity through energetic analysis of binding site waters. ChemMedChem. 2010;5:618–627. doi: 10.1002/cmdc.200900501. [DOI] [PubMed] [Google Scholar]
- 9.Pearlstein RA, et al. New hypotheses about the structure-function of proprotein convertase subtilisin/kexin type 9: Analysis of the epidermal growth factor-like repeat a docking site using watermap. Proteins. 2010;78:2571–2586. doi: 10.1002/prot.22767. [DOI] [PubMed] [Google Scholar]
- 10.Friesner RA, et al. Extra precision glide: Docking and scoring incorporating a model of hydrophobic enclosure for protein ligand complexes. J Med Chem. 2006;49:6177–6196. doi: 10.1021/jm051256o. [DOI] [PubMed] [Google Scholar]
- 11.Young T, et al. Dewetting transitions in protein cavities. Proteins. 2010;78:1856–1869. doi: 10.1002/prot.22699. [DOI] [PMC free article] [PubMed] [Google Scholar]
- 12.Malham R, et al. Strong solute-solute dispersive interactions in a protein–ligand complex. J Am Chem Soc. 2005;127:17061–17067. doi: 10.1021/ja055454g. [DOI] [PubMed] [Google Scholar]
- 13.Airenne TT, et al. Structural evidence for adaptive ligand binding of glycolipid transfer protein. J Mol Bio. 2006;355:224–236. doi: 10.1016/j.jmb.2005.10.031. [DOI] [PubMed] [Google Scholar]
- 14.Lario PI, et al. Structure and biochemical analysis of a secretin pilot protein. EMBO J. 2005;24:1111–1121. doi: 10.1038/sj.emboj.7600610. [DOI] [PMC free article] [PubMed] [Google Scholar]
- 15.Barratt E, et al. Van der waals interactions dominate ligand–protein association in a protein binding site occluded from solvent water. J Am Chem Soc. 2005;127:11827–11834. doi: 10.1021/ja0527525. [DOI] [PubMed] [Google Scholar]
- 16.Homans SW. Water, water everywhere—except where it matters? Drug Discov Today. 2007;12:534–539. doi: 10.1016/j.drudis.2007.05.004. [DOI] [PubMed] [Google Scholar]
- 17.Michel J, Tirado-Rives J, Jorgensen WL. Prediction of the water content in protein binding sites. J Phys Chem B. 2009;113:13337–13346. doi: 10.1021/jp9047456. [DOI] [PMC free article] [PubMed] [Google Scholar]
- 18.Bingham RJ, et al. Thermodynamics of binding of 2-methoxy-3-isopropylpyrazine and 2-methoxy-3-isobutylpyrazine to the major urinary protein. J Am Chem Soc. 2004;126:1675–1681. doi: 10.1021/ja038461i. [DOI] [PubMed] [Google Scholar]
- 19.Timm DE, Baker L, Mueller H, Zidek L, Novotny MV. Structural basis of pheromone binding to mouse major urinary protein (mup-i) Protein Sci. 2001;10:997–1004. doi: 10.1110/ps.52201. [DOI] [PMC free article] [PubMed] [Google Scholar]
- 20.Sharrow SD, Novotny MV, Stone MJ. Thermodynamic analysis of binding between mouse major urinary protein-1 and the pheromone 2-sec-butyl-4,5-dihydrothiazole. Biochemistry. 2003;42:6302–6309. doi: 10.1021/bi026423q. [DOI] [PubMed] [Google Scholar]
- 21.Wang L, Friesner RA, Berne BJ. Hydrophobic interactions in model enclosures from small to large length scales: non-additivity in explicit and implicit solvent models. Faraday Discuss. 2010;146:246–262. doi: 10.1039/b925521b. [DOI] [PMC free article] [PubMed] [Google Scholar]
- 22.Siebert X, Hummer G. Hydrophobicity maps of the n-peptide coiled coil of hiv-1 gp41. Biochemistry. 2002;41:2956–2961. doi: 10.1021/bi0158526. [DOI] [PubMed] [Google Scholar]
- 23.Schrödinger Suite 2010 Protein Preparation Wizard. New York: Schrödinger; 2010. [Google Scholar]
- 24.Maestro v 8.5. New York: Schrödinger; 2008. [Google Scholar]
- 25.Bowers KJ, et al. Scalable Algorithms for Molecular Dynamics Simulations on Commodity Clusters. New York: ACM; 2006. p. 84. [Google Scholar]
- 26.Nose S. A unified formulation of the constant temperature molecular dynamics methods. J Chem Phys. 1984;81:511–519. [Google Scholar]
- 27.Hoover WG. Canonical dynamics: Equilibrium phase-space distributions. Phys Rev A. 1985;31:1695–1697. doi: 10.1103/physreva.31.1695. [DOI] [PubMed] [Google Scholar]
- 28.Martyna GJ, Tobias DJ, Klein ML. Constant pressure molecular dynamics algorithms. J Chem Phys. 1994;101:4177–4189. [Google Scholar]
- 29.Jorgensen WL, Chandrasekhar J, Madura JD, Impey RW, Klein ML. Comparison of simple potential functions for simulating liquid water. J Chem Phys. 1983;79:926–935. [Google Scholar]
- 30.Darden T, York D, Pedersen L. Particle mesh ewald: An nlog(n) method for ewald sums in large systems. J Chem Phys. 1993;98:10089–10092. [Google Scholar]
- 31.Lazaridis T. Inhomogeneous fluid approach to solvation thermodynamics. 1. theory. J Phys Chem B. 1998;102:3531–3541. [Google Scholar]
- 32.Hummer G, Garde S, Garcia AE, Pohorille A, Pratt LR. An information theory model of hydrophobic interactions. Proc Nat Acad Sci USA. 1996;93:8951–8955. doi: 10.1073/pnas.93.17.8951. [DOI] [PMC free article] [PubMed] [Google Scholar]
Associated Data
This section collects any data citations, data availability statements, or supplementary materials included in this article.


