Abstract
This study describes a unique function of taurocholate in bile canalicular formation involving signaling through a cAMP-Epac-MEK-Rap1-LKB1-AMPK pathway. In rat hepatocyte sandwich cultures, polarization was manifested by sequential progression of bile canaliculi from small structures to a fully branched network. Taurocholate accelerated canalicular network formation and concomitantly increased cAMP, which were prevented by adenyl cyclase inhibitor. The cAMP-dependent PKA inhibitor did not prevent the taurocholate effect. In contrast, activation of Epac, another cAMP downstream kinase, accelerated canalicular network formation similar to the effect of taurocholate. Inhibition of Epac downstream targets, Rap1 and MEK, blocked the taurocholate effect. Taurocholate rapidly activated MEK, LKB1, and AMPK, which were prevented by inhibition of adenyl cyclase or MEK. Our previous study showed that activated-LKB1 and AMPK participate in canalicular network formation. Linkage between bile acid synthesis, hepatocyte polarization, and regulation of energy metabolism is likely important in normal hepatocyte development and disease.
Keywords: primary hepatocytes, occludin, P-glycoprotein
Hepatocytes, the major epithelial cells in the liver, are polarized. Tight junction proteins, including occludin, claudin, and ZO-1, seal the canalicular lumen, thereby separating apical and basolateral membrane domains and forming the bile canaliculus (1). Polarization is essential for biliary secretion. The mechanisms of polarization are complex and include cytoskeletal, tight junctional, and intracellular trafficking components (2–5). Loss of polarity causes bile secretory failure (cholestasis) and liver damage (6).
Bile acids are synthesized from cholesterol in hepatocytes, secreted by ABCB11 (Bsep) into the bile canaliculus, and then mostly absorbed into the enterohepatic circulation (7). The major bile acids in mammals are tauro or glycine conjugates of cholic, deoxycholic, and chenodeoxycholic acids (8). In addition to their traditional function in emulsification of dietary fat (8), recent studies reveal that bile acids function as signaling molecules (9), which increase calcium mobilization (10) and cellular cAMP (9); translocate and activate protein kinase C (11), nuclear farnesoid X receptor (FXR), and pregnane X receptors (PXR) (7, 9); activate PI3K/AKT/glycogen synthase kinase 3 (GSK3) (12); and enhance liver regeneration (13).
During embryonic development, early fetal hepatocytes are not polarized (14–16). In fetal mice and rats, infrequent small canaliculi are present, but do not attain an adult appearance until several days postpartum (17). Bile acid synthesis, turnover, and secretion are sparse in fetal liver, and rapidly increase postnatally (18, 19), concomitant with hepatocyte polarization and development of a branched canalicular network. Based on these events, we postulated that bile acids may regulate hepatocyte polarization and canalicular formation. Using collagen sandwich cultures of rat primary hepatocytes, we confirmed this hypothesis by quantifying canalicular network formation after exposure to bile acids and identifying the signaling pathways involved.
Results
Canalicular Network Formation in Sandwich Culture of Rat Hepatocytes and the Effect of Bile Acid.
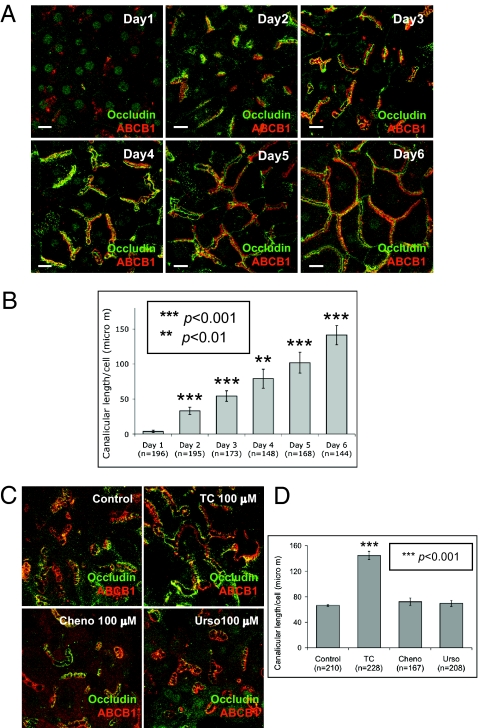
Using primary rat hepatocytes in collagen sandwich cultures (20), we analyzed the effect of bile acid treatment on canalicular network formation as identified by immunofluorescence of occludin, a tight junction marker, and ABCB1 (P-glycoprotein), an apical membrane marker. Canalicular shape, length, and network formation were recorded from days 1 through 6. In control cultures, the canalicular network sequentially grew (Fig. 1 A and B). In day 1 cultures, canaliculi were infrequent and small, indicating loss of polarity because of isolation of hepatocytes. In day 2 cultures, polarization was manifested by an increase in canalicular number and length per cell. From days 3 to 5, canaliculi progressively elongated and connected to form branched structures. Canalicular length per cell increased daily. In day 6 cultures, canaliculi formed an extensive branched network, which replicates the mature morphological form in vivo (15) (Fig. 1 A and B). After the fully branched network was formed, canalicular structure and length per cell remained unchanged up to 14 d, when cells began to deteriorate. The effect of bile acid on the sequential process of polarization/canalicular network formation was next studied. Day 2 cultures were treated with taurocholate, chenodeoxycholate, or ursodexocholate (25–200 μM, 24 h). Immunofluorescence results showed that taurocholate, but not cheno- or ursodexocholate, resulted in a dose-dependent increase in canalicular branching and length per cell (P < 0.001) (Fig. 1 C and D and Fig. S1 A and B). The response to taurocholate was maximal at 100 μM (Fig. S1 A and B). Taurocholate- (24 h, 100 μM) treated cells had canalicular network formation similar to day 6 cells. Maximal canalicular network formation was achieved in day 5 and 6 cultures, and retained up to 2 to 3 wk. Day 2 cultures treated with 100 μM taurocholate for 24 or 48 h had similar network formation, indicating that 24-h incubation produced maximal canalicular network formation. Because taurocholate is a conjugated bile acid and cheno- and ursodeoxycholate are unconjugated, we also tested the effect of two conjugated bile acids, taurochenodeoxycholate and tauoursodeoxycholate. Both moderately accelerated the canalicular network compared with the greater effect of similar concentrations of taurocholate (Fig. S1 C and D). Therefore, we focused on the mechanism of the taurocholate effect.
Fig. 1.
Effects of bile acids on canalicular network formation. Immunofluorecence of occludin and ABCB1 were performed. (A) Daily progress of canalicular network formation in sandwich culture. (Scale bars, 15 μm.) (B) Mean canalicular length per cell (± SD) from four individual experiments (n, cell number; **P < 0.01, ***P < 0.001). (C) Day 2 cells were treated with 100 μM taurocholate (TC), chenodeoxycholate (cheno), or ursodeoxycholate (urso) for 24 h. (D) Mean canalicular length per cell (± SD) from four individual experiments (n, cell number; ***P < 0.001).
Taurocholate-Accelerated Canalicular Network Formation Is Unaffected by Inhibitors of PI3K, FXR, and CaMKK.
Taurocholate activates many cellular signaling pathways in hepatocytes, including FXR, PI3K, and calcium-CaMKK (9). To determine the mechanism of taurocholate-accelerated canalicular network formation, the involvement of FXR, PI3K, and calcium-CaMKK was examined. In day 2 cultures, hepatocytes were treated with specific inhibitors of FXR (Z-Guggulsternone, 45 μM), PI3K (LY294002, 1 μM), or CaMKK (STO-609, 800 nM) for 24 h in the presence or absence of taurocholate. Canalicular structure and length in cells treated with taurocholate with or without the inhibitors was similar (Fig. S2), indicating that taurocholate-accelerated canalicular network formation may not be dependent on FXR, PI3K, and CaMKK pathways. Day 2 cultures were also treated with a specific nonsteroid FXR activator, GW4064 (50 nM, 24 h). Canalicular structure and length per cells were similar to that in untreated control cells, confirming that FXR is not involved in taurocholate-accelerated canalicular formation (Fig. S2 C and D). Different concentrations of the inhibitors and activator (LY29002: 0.1–100 μM; Z-Guggulsternone: 45–180 μM; STO-609: 200–800 nM; and GW4064: 50–2000 nM) had no effect on canalicular network formation.
Role of Adenylate Cyclase in Taurocholate-Accelerated Canalicular Network Formation.
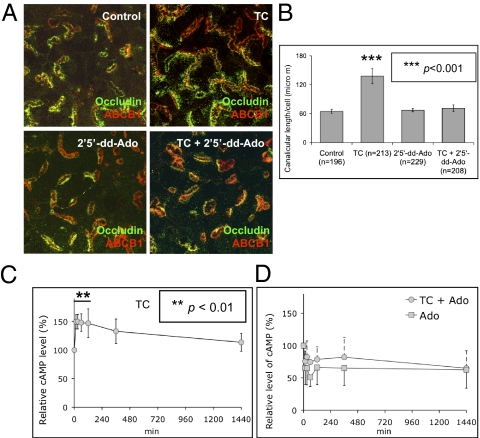
Because bile acids activate adenylate cyclase in different cells (7), the possible role of adenylate cyclase was tested using a specific inhibitor, 2′,5′-Dideoxyadenosine (2′5′-dd-Ado). Treatment with 2′5′-dd-Ado (200 μM, 24 h) in day 2 cultures completely blocked taurocholate-accelerated canalicular network formation. Cells treated with taurocholate plus 2′5′-dd-Ado had a typical day 3 bar-shape canalicular structure and length per cell (Fig. 2 A and B), but 2′5′-dd-Ado alone (50–250 μM) did not affect canalicular structure (Fig. 2 A and B). MDL-12 330A, another adenylate cyclase inhibitor, also completely inhibited taurocholate-accelerated canalicular network formation, confirming the role of adenylate cyclase in taurocholate-accelerated canalicular formation.
Fig. 2.
Adenylate cyclase inhibitor prevents taurocholate-accelerated canalicular network formation. (A) Day 2 cells were treated with adenylate cyclase inhibitor (2′5′-dd-Ado) in the presence or absence of taurocholate (100 μM, 24 h). (B) Mean canalicular length per cell (± SD) from three individual experiments (n, cell number; ***P < 0.001). (C) Day 2 cells were treated with 100 μM taurocholate. The relative cAMP levels were normalized to time 0 (from four individual experiments; **P < 0.01). (D) Relative cAMP level in cells treated with 2′2′-dd-Ado in the presence or absence of taurocholate (from three individual experiments).
Taurocholate Increases Cellular cAMP.
Activation of adenylate cyclase by bile acids increases cellular cAMP in many cells (21–23); however, whether this occurs in hepatocytes is unknown. Because taurocholate-accelerated canalicular network formation is adenylate cyclase-dependent (Fig. 2 A and B), the effect of taurocholate on cellular cAMP was examined. Day 2 cultures were treated with or without 100 μM of taurocholate for 15 to 1,440 min. After 15 min of taurocholate treatment, cAMP increased 50% (P < 0.01) and remained at 33 to 50% increments up to 6 h (P < 0.05) (Fig. 2C). An adenylate cyclase inhibitor, 2′5′-dd-Ado, reduced cAMP by 24% after incubation for 15 min with taurocholate, whereas 2′5′-dd-Ado alone caused an ∼34% decrease in cAMP (Fig. 2D). The inhibitory effect of 2′5′-dd-Ado on taurocholate-mediated cAMP corresponded to its effect on taurocholate-accelerated canalicular network formation, suggesting that cAMP mediates the effect of taurocholate on canalicular network formation.
Taurocholate-Accelerated Canalicular Network Formation Signals Through Epac.
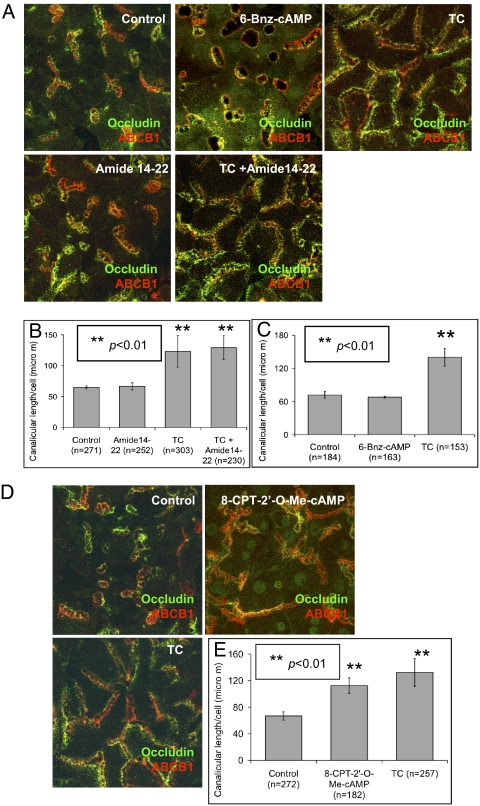
Both protein kinase A (PKA) and exchange protein directly activated by cAMP (Epac) are activated by cAMP (24). Therefore, their roles in taurocholate-accelerated canalicular network formation were investigated. Day 2 cultures were treated with the specific PKA inhibitor, amide14-22, in the presence or absence of taurocholate (100 μM, 24 h). Canalicular structure and length per cell in amide14-22 (50–1,000 nM) plus taurocholate-treated cells were similar in cells treated with taurocholate alone, revealing that inhibition of PKA did not block taurocholate effect on canalicular network formation (Fig. 3 A and B). Day 2 cultures were also treated with PKA specific activator, 6-Bnz-cAMP (50 μM, 24 h). Canalicular structure and length were similar to untreated control cells (Fig. 3 A and C), confirming that PKA does not participate in taurocholate-accelerated canalicular network formation.
Fig. 3.
Taurocholate-accelerated canalicular network formation is via Epac. (A) Day 2 cells were treated with PKA inhibitor (Amide 14–22) with or without taurocholate (100 μM, 24 h), or treated with PKA activator (6-Bnz-cAMP) for 24 h. (B) Mean canalicular length per cell (± SD) from five individual experiments (n, cell number; **P < 0.01). (C) Canalicular length per cell in the PKA activator treated cells from three individual experiments (n, cell number; **P < 0.01). (D) Day 2 cells were treated with specific Epac activator (8-CPT-2′-O-Me-cAMP) for 24 h. (E) Mean canalicular length per cell (± SD) from four individual experiments (n, cell number; **P < 0.01).
Because there is no available Epac inhibitor, the role of Epac was examined using a specific Epac activator, 8-CPT-2′-O-Me-cAMP. Day 2 hepatocytes were treated with 8-CPT-2′-O-Me-cAMP (3 μM, 24 h). Canalicular formation and length were accelerated and similar to day 5 and 6 morphology, and to results with taurocholate treatment (Fig. 3 D and E) (P < 0.01). In addition, the adenylate cyclase inhibitor did not prevent the Epac effect on canalicular network formation (Fig. S3 A and B). Epac activation resulted in a similar effect as taurocholate, suggesting a role for Epac in taurocholate-accelerated canalicular network formation.
Involvement of Epac Downstream GTPase, Rap1, and MEK in Taurocholate-Accelerated Canalicular Network Formation.
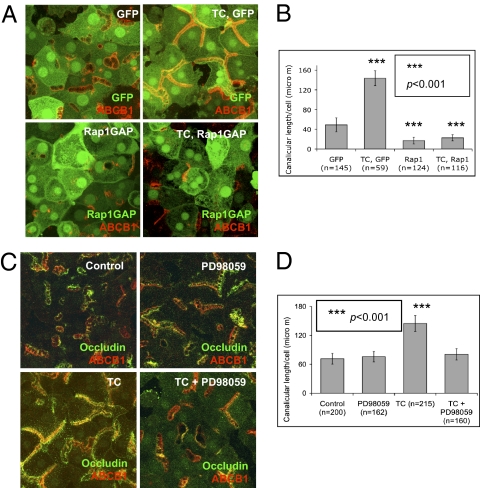
To confirm the role of Epac in taurocholate-accelerated canalicular formation, downstream, Rap1 was also examined. Rap1 is a Ras-like small GTPase that is involved in many cellular events, including proliferation, junction formation, and polarity, and can be activated by many stimuli, including Epac (25). Day 1 cultures were infected with Rap1Gap-GFP adenovirus (∼10–15% infection rate), which results in GDP-bound inactive Rap1 (26). GFP adenovirus was used as a control to ensure that infection per se did not affect canalicular structure (∼10–15% infection rate). One day after infection, cells were treated with taurocholate (100 μM, 24 h). Immunostaining showed that taurocholate-accelerated canalicular network formation was completely inhibited in cells overexpressing GFP-Rap1Gap, and was unaffected by infection with GFP-adenovirus, which did not prevent the effect of taurocholate (Fig. 4 A and B). These results indicate that inhibition of Rap1 prevented the effect of taurocholate.
Fig. 4.
Effect of Epac downstream GTPase, Rap1, and MEK, on taurocholate-accelerated canalicular network formation. (A) Day 1 cells were infected with GFP or GFP-Rap1GAP adenoviruses. Twenty-four hours postinfection, immunostaining was performed in control cells (occludin and ABCB1), GFP cells (ABCB1), and GFP-Rap1GAP cells (ABCB1) with or without taurocholate (100 μM). (B) Mean canalicular length per cell (± SD) from three individual experiments (n, cell number; ***P < 0.001). (C) Day 2 cells were treated with specific MEK inhibitor (PD98059) with or without taurocholate (100 μM, 24 h). (D) Mean canalicular length per cell (± SD) from three individual experiments (n, cell number, ***P < 0.001).
Downstream targets of Rap1 were then tested. Rap1 has several downstream effectors, including MEK, which are engaged in transcription, proliferation, differentiation, and cell polarity (25, 27, 28). Day 2 cultures were treated with PD98059 (100 μM), a specific MEK inhibitor, with or without taurocholate for 24 h. MEK inhibition completely blocked the taurocholate effect on canalicular network formation, but did not affect steady state canalicular structure (Fig. 4 C and D). Another MEK inhibitor, U1026, reproduced similar effects. In addition, MEK inhibitor PD98059 prevented Epac-mediated acceleration of canalicular formation (Fig. S3 A and B).
To determine whether taurocholate activates MEK, phosphorylated (serine 217 and 221) MEK was detected by Western blotting (28–30). Within 15 min, taurocholate activated MEK sixfold, as detected by the ratio of phos-MEK to total MEK (Fig. S4 A and B). Adenylate cyclase inhibitor (2′5′-dd-Ado) and MEK inhibitor (PD98059) prevented taurocholate-mediated MEK activation (Fig. S4 C–F), which correlated with the observed morphological effects (Figs. 2 A and B and 4 C and D). Similarly, Epac activator, 8-CPT-2′-O-Me-cAMP, which accelerated canalicular network formation, activated MEK fivefold within 15 min (Fig. S4 G and H). MEK inhibitor (PD98059) blocked 8-CPT-2′-Me-cAMP–mediated activation of MEK (Fig. S4 I and J). Collectively, the results indicate that the Epac-Rap1-MEK pathway mediates taurocholate-accelerated canalicular network formation.
Role of LKB1/AMPK in Taurocholate-Accelerated Canalicular Network Formation.
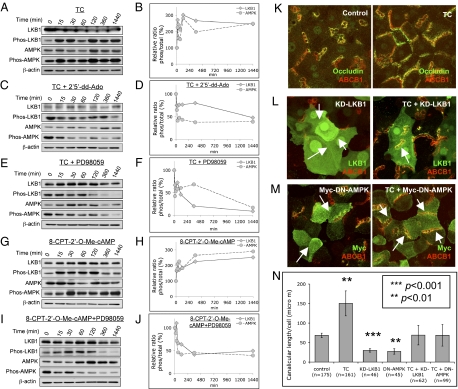
We then investigated how MEK activation is linked to taurocholate-accelerated canalicular network formation. Our previous study revealed that AMP-activated protein kinase (AMPK) and its upstream kinase, Liver Kinase B1 (LKB1), are required for canalicular network formation (20). Within 15 min, taurocholate activated LKB1 (phos-Ser-431) and AMPK (phos-Thr-172), and increased 2.7- and 2.2-fold the ratios of phos-LKB1 ser431/total LKB1 and phos-AMPK Thr-172/total AMPK, respectively (Fig. 5 A and B). These results associate involvement of LKB1 and AMPK with taurocholate effects on canalicular network formation. In addition, adenylate cyclase inhibitor (2′5′-dd-Ado) and MEK inhibitor (PD98059) prevented taurocholate-mediated activation of LKB1 and AMPK (Fig. 5 C–F), which parallels their inhibitory effect on taurocholate-accelerated canalicular network formation. Forskolin, which activates adenylate cyclase, also activated LKB1-AMPK and produced similar morphological changes, as did taurocholate (20). Within 15 min, Epac activator, 8-CPT-2′-O-Me-cAMP, also activated LKB1 and AMPK (1.6- and 1.7-fold, respectively) (Fig. 5 G and H), and MEK inhibitor (PD98059) blocked 8-CPT-2′-O-Me-cAMP–mediated activation of LKB1 and AMPK (Fig. 5 I and J). These results reveal that LKB1-AMPK participates in taurocholate-accelerated canalicular network formation through the cAMP-Epac-Rap1-MEK pathway.
Fig. 5.
Protein levels of total LKB1, phos-LKB1 (Ser-431), total AMPK, and phos-AMPK (Thr-172). Day 2 cells were treated with various treatments for 0, 15, 30, 60, 120, 360, and 1,440 min. Western blotting of LKB1, phos-LKB1 (Ser-431), AMPK, and phos-AMPK (Thr-172) were performed. Densitometric measurements were from three individual experiments. (A and B) Cells were treated with taurocholate (100 μM). Ratio of phos-LKB1/total LKB1 and phos-AMPK/total AMPK. (C and D) Cells were treated with taurocholate (100 μM) and adenylate cyclase inhibitor (2′5′-dd-Ado, 200 μM). Ratio of phos-LKB1/total LKB1 and phos-AMPK/total AMPK. (E and F) Cells were treated with taurocholate (100 μM) and MEK inhibitor (PD98059, 100 μM). Ratios of phos-LKB1/total LKB1 and phos-AMPK/total AMPK. (G and H) Cells were treated with Epac activator (8-CPT-2′-O-Me-cAMP, 3 μM). Ratios of phos-LKB1/total LKB1 and phos-AMPK/total AMPK. (I and J) Cells were treated with 8-CPT-2′-O-Me-cAMP and PD98059. Ratios of phos-LKB1/total LKB1 and phos-AMPK/total AMPK. (K) Day 2 cultures are treated with or without 100 μM taurocholate for 24 h. (immunostaining for occludin and ABCB1). (L) Day 1 cells were infected with either KD-LKB1 adenovirues. Twenty-four hours postinfection, cells were treated with or without taurocholate (100 μM, 24 h). (immunostaining of LKB1 and ABCB1). (M) Day 1 cells were infected with either Myc-DN-AMPK adenovirues. Twenty-four hours postinfection, cells were treated with or without taurocholate (100 μM, 24 h) (immunostaining of Myc and ABCB1). (N) Mean canalicular length per cell (±SD) from three individual experiments (n, cell number; ***P < 0.001, **P < 0.01).
In addition, day 1 cells were infected with either kinase-dead LKB1 mutant (KD-LKB1) or dominant-negative AMPK mutant (Myc-DN-AMPK) adenoviruses (5–10% infection rate). Twenty-four hours later, cells were treated with or without taurocholate (100 μM, 24 h). Both KD-LKB1 and Myc-DN-AMPK resulted in loss of canalicular network and reduced canalicular length (Fig. 5 K–N) (P < 0.01). When compared with control cultures, addition of taurocholate restored canalicular network formation in KD-LKB1– or DN-AMPK–infected cells. However, when compared with results in taurocholate-treated control cells, the responses was ∼45% of response to taurocholate alone (Fig. 5 K–N). These results confirm the role of LKB1-AMPK in canalicular network formation (20).
Discussion
In rodent fetal liver, hepatocytes are unpolarized and have infrequent small canaliculi, and bile acid synthesis is sparse (16, 18). Postpartum, hepatocytes rapidly polarize. Parallel to the morphological change, bile acid synthesis accelerates (16), suggesting that bile acids may influence hepatocyte polarization. Because of difficulties in conducting in vivo developmental studies in fetal liver, we took advantage of a novel in vitro collagen sandwich culture of rat primary hepatocytes, which mimics the in vivo system morphologically and functionally (31, 32). After perfusion of rat liver with collagenase, isolated hepatocytes are not polarized; however, in collagen sandwich culture, they sequentially develop into a fully polarized canalicular network, which is accelerated by taurocholate. Our study reveals a unique function of taurocholate and, to a lesser extent, taurodchenodeoxycholate and tauroursodeoxycholate, on hepatocyte polarity and canalicular network formation. The dihydroxy bile acids, cheono- and ursodeoxycholate, did not modulate canalicular network formation, possibly because hydrophilicity and chemical structure determine the effect of different bile acids on signaling pathways (9). In collaboration with Lee Hagey (University of California San Diego), initial mass spectroscopy study of hepatocyte cultures from days 1 to 6 revealed little endogenous bile acids. Bile acid accelerated canalicular network formation. Their role in normal development is under investigation.
In many types of cells, bile acids increase cellular cAMP by binding to TGR5, a G protein-coupled receptor that activates adenylate cyclase (7–9); however, hepatocytes may not express TGR5 at mRNA or protein levels. Although bile acids had no effect on cAMP production in suspension culture of hamster hepatocytes (33), taurocholate rapidly increased cAMP in sandwich cultures and adenylate cyclase inhibitor prevented taurocholate-mediated increased cAMP. In contrast to suspension cultures, collagen sandwich culture morphologically and functionally mimics events in vivo (31, 32). The culture medium contains insulin (0.02 mg/mL) and glucagon (0.0284 μg/mL), which increase cAMP (34, 35); however, taurocholate and forskolin significantly increased cAMP compared with control cells. The mechanism by which taurocholate increases cAMP in collagen sandwich cultures may involve an unknown G protein-coupled receptor (36).
Previous work showed that deoxycholic or chenodeoxycholic acid activated MEK-ERK in mouse hepatocytes (37). Our results reveal that taurocholate, a mammalian primary bile acid, activates MEK in association with accelerated canalicular network formation. Prior studies additionally suggested that deoxycholic acid activates MEK-ERK via EGFR in rat hepatocytes (38); however, we found that two EGFR-specific inhibitors did not prevent taurocholate-accelerated canalicular network formation in sandwich culture. Taurocholate and deoxycholic acid, therefore, may activate different signal molecules.
The mechanism by which taurocholate signaling through the cAMP-Epac-Rap1-MEK pathway activates LKB1-AMPK is uncertain. In mouse melanoma cells and rat embryonic fibroblasts, MEK activated LKB1 via ERK and p90 ribosomal S6 kinase (p90RSK) (39–41), and HGF-induced phosphorylation of p90RSK and LKB1 (Ser-431) was abolished by MEK-ERK inhibitor, U0126, suggesting that LKB1 phosphorylation is MEK-ERK– and p90RSK-dependent (41). In contrast, MEK activation in human cancer cell lines inhibited LKB1 phosphorylation by ERK-p90RSK (42). Whether phosphorylation of LKB1 by ERK and p90Rsk is activating or inhbitory is controversial (39–42). In hepatocyte sandwich cultures, MEK activation correlated directly with LKB1 and AMPK activation and canalicular network formation.
LKB1-AMPK activation is involved in intestinal and neuronal cells, and Drosophila polarity (43–45), and is essential for hepatocyte polarity (20). Overexpression of KD-LKB1 or DN-AMPK prevented canalicular network formation; however, these inhibitory effects were partially overcome by taurocholate (Fig. 5 K–N). These studies do not identify which kinase is primary because comparatively little residual LKB1 activates AMPK. Because endogenous bile acid synthesis is marginal at best, it is unlikely that KD-LKB1 or DN-AMPK work through inhibition of bile acid synthesis.
Precisely how LKB1-AMPK regulates canalicular formation remains unknown. Previous studies revealed that AMPK regulates tight junction assembly (46, 47), possibly by affecting the actin cytoskeleton through phosphorylation of myosin regulatory light chain (48). Polarity effects of LKB1 have also been associated with PAR proteins, AMPK-related kinases NUAK1/2, which are activated by LKB1, and control of cell adhesion by regulating myosin phosphatase complexes (49). In addition, AMPK may regulate canalicular network formation through the apical recycling pathway. Dominant-negative Rab11a or motorless myosin Vb inhibited the recycling pathway and prevented polarization, suggesting that the Rab11a recycling system provides polarization cues through essential components or by signaling to downstream targets (5).
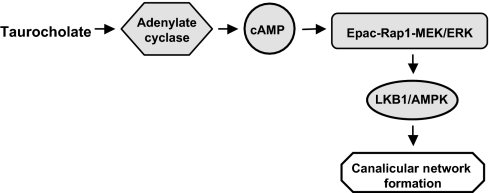
Our results suggest association between bile acid production and hepatocyte polarity, which may explain why rapid polarization parallels bile acid synthesis during postpartum liver development. Whether hepatocyte polarity and canalicular network formation are altered in inheritable disorders affecting either bile acid synthesis or ABCB11 has not been investigated. Because taurocholate affects hepatocyte polarity by activating the cAMP-Eapc-Rap1-MEK-LKB1-AMPK pathway (Fig. 6), targeting this pathway may provide a therapeutic approach for polarity-relevant liver diseases.
Fig. 6.
Signaling pathway model for taurocholate-accelerated canalicular network formation.
Materials and Methods
Reagents and Antibodies.
Amide 14–22 and 6-Bnz-cAMP were from Sigma-Aldrich. Taurocholate, chenodeoxycholate, ursodeoxycholate, LY294002, Z-Guggulsterone, 2′5′-Dideoxyadenosin, PD98058, and 8-CPT-2′-O-Me-cAMP were from Calbiochem. STO-609 and GW4064 were from Tocris Bioscience. Mouse anti ABCB1 C219 antibody was from Alexis Biochemicals. Rabbit anti-occludin antibody was from Invitrogen. Rabbit anti-LKB1, anti-AMPK, anti–phospho-AMPK (Thr-172), anti-MEK1/2, and anti–phospho-MEK1/2 (Ser217/221) antibody were from Cell Signaling Technology. Rabbit anti–phospho-Ser-431 LKB1 antibody was from Santa Cruz. Peroxidase-conjugated goat anti-rabbit and anti-mouse IgG were from Jackson ImmnoResearch.
Adenoviruses.
GFP-tagged Rap1GAP and GFP adenovirus were provided by Erika Wittchen (University of North Carolina, Chapel Hill, NC) (26). Myc-tagged dominant-negative AMPK-α1, -α2 (Myc-DN-AMPK), and kinase-dead mutant LKB1 (D194A, KD-LKB1) adenovirus were provided by Yasuo Ido (Boston University, Boston, MA).
Rat Liver Perfusion, Hepatocyte Isolation, and Collagen Sandwich Culture.
Briefly, using protocol (ASP 07-010) approved by Animal Care and Use Committee at National Institute of Child Health & Human Development/National Institutes of Health, Sprague–Dawley rats were anesthetized, the liver was perfused with buffer, followed with collagenase A buffer. After isolation, 2 × 10⁵ hepatocytes were seeded in the microwell of 35-mm glass-bottom dishes (MatTek) precoated with type-1 collagen. After overnight incubation, hepatocytes were overlaid with collagen. Cell density was 2.56 × 10⁵/cm2, which is similar to in vivo density (2–3 × 10⁵/cm2). Details were described previously (20).
Immunofluorescence.
Briefly, cultures were fixed, blocked, and permeabilized. After incubation with primary antibodies and washing, cells were incubated with secondary antibody, followed by washing. Confocal images were taken using a Zeiss 510 Meta confocal microscopy and LSM 510 program (Zeiss). All images were projections of z-stacks, and analyzed using Image J program (National Institutes of Health, Bethesda, MD). Details are described in SI Materials and Methods.
Western Blot Analysis.
Cultures were harvested and sonicated in lysis buffer. Fifty micrograms of total protein extracts were subjected to SDS/PAGE gel. Following transfer and blocking, PDVF membranes were incubated with primary antibody. After washing, membranes were incubated with secondary antibody. Proteins were detected using ECL-Plus chemiluminescence detection system (GE Healthcare). Densitometry was measured using the Image J program. Details are described in SI Materials and Methods.
Cellular cAMP Measurement.
Taurocholate was added to day 2 cultures with or without 2′5′-Dideoxyadenosin for different periods of time. Sample preparation and cAMP measurement were according to the cAMP EIA Kit protocol (Cayman Chemical).
Statistics.
Student's t test was used for densitometry and canalicular length analysis.
Supplementary Material
Acknowledgments
We thank Lewis Cantley (Harvard Medical School, Boston, MA) and Neil Ruderman (Boston University School of Medicine, Boston, MA) for their advice.
Footnotes
The authors declare no conflict of interest.
This article contains supporting information online at www.pnas.org/lookup/suppl/doi:10.1073/pnas.1018376108/-/DCSupplemental.
References
- 1.Vinken M, et al. Involvement of cell junctions in hepatocyte culture functionality. Crit Rev Toxicol. 2006;36:299–318. doi: 10.1080/10408440600599273. [DOI] [PubMed] [Google Scholar]
- 2.Rodriguez-Boulan E, Kreitzer G, Müsch A. Organization of vesicular trafficking in epithelia. Nat Rev Mol Cell Biol. 2005;6:233–247. doi: 10.1038/nrm1593. [DOI] [PubMed] [Google Scholar]
- 3.Bryant DM, Mostov KE. From cells to organs: Building polarized tissue. Nat Rev Mol Cell Biol. 2008;9:887–901. doi: 10.1038/nrm2523. [DOI] [PMC free article] [PubMed] [Google Scholar]
- 4.Hoekstra D, Tyteca D, van IJzendoorn SC. The subapical compartment: A traffic center in membrane polarity development. J Cell Sci. 2004;117:2183–2192. doi: 10.1242/jcs.01217. [DOI] [PubMed] [Google Scholar]
- 5.Wakabayashi Y, Dutt P, Lippincott-Schwartz J, Arias IM. Rab11a and myosin Vb are required for bile canalicular formation in WIF-B9 cells. Proc Natl Acad Sci USA. 2005;102:15087–15092. doi: 10.1073/pnas.0503702102. [DOI] [PMC free article] [PubMed] [Google Scholar]
- 6.Arias IM, et al. The biology of the bile canaliculus, 1993. Hepatology. 1993;17:318–329. [PubMed] [Google Scholar]
- 7.Thomas C, Pellicciari R, Pruzanski M, Auwerx J, Schoonjans K. Targeting bile-acid signalling for metabolic diseases. Nat Rev Drug Discov. 2008;7:678–693. doi: 10.1038/nrd2619. [DOI] [PubMed] [Google Scholar]
- 8.Hofmann AF, Hagey LR. Bile acids: Chemistry, pathochemistry, biology, pathobiology, and therapeutics. Cell Mol Life Sci. 2008;65:2461–2483. doi: 10.1007/s00018-008-7568-6. [DOI] [PMC free article] [PubMed] [Google Scholar]
- 9.Nguyen A, Bouscarel B. Bile acids and signal transduction: Role in glucose homeostasis. Cell Signal. 2008;20:2180–2197. doi: 10.1016/j.cellsig.2008.06.014. [DOI] [PubMed] [Google Scholar]
- 10.Bouscarel B, Kroll SD, Fromm H. Signal transduction and hepatocellular bile acid transport: Cross talk between bile acids and second messengers. Gastroenterology. 1999;117:433–452. doi: 10.1053/gast.1999.0029900433. [DOI] [PubMed] [Google Scholar]
- 11.Looby E, Long A, Kelleher D, Volkov Y. Bile acid deoxycholate induces differential subcellular localisation of the PKC isoenzymes beta 1, epsilon and delta in colonic epithelial cells in a sodium butyrate insensitive manner. Int J Cancer. 2005;114:887–895. doi: 10.1002/ijc.20803. [DOI] [PubMed] [Google Scholar]
- 12.Fang Y, et al. Conjugated bile acids regulate hepatocyte glycogen synthase activity in vitro and in vivo via Galphai signaling. Mol Pharmacol. 2007;71:1122–1128. doi: 10.1124/mol.106.032060. [DOI] [PubMed] [Google Scholar]
- 13.Huang W, et al. Nuclear receptor-dependent bile acid signaling is required for normal liver regeneration. Science. 2006;312:233–236. doi: 10.1126/science.1121435. [DOI] [PubMed] [Google Scholar]
- 14.Kingsbury JW, Alexanderson M, Kornstein ES. The development of the liver in the chick. Anat Rec. 1956;124:165–187. doi: 10.1002/ar.1091240204. [DOI] [PubMed] [Google Scholar]
- 15.Gallin WJ. Development and maintenance of bile canaliculi in vitro and in vivo. Microsc Res Tech. 1997;39:406–412. doi: 10.1002/(SICI)1097-0029(19971201)39:5<406::AID-JEMT3>3.0.CO;2-E. [DOI] [PubMed] [Google Scholar]
- 16.Feracci H, Connolly TP, Margolis RN, Hubbard AL. The establishment of hepatocyte cell surface polarity during fetal liver development. Dev Biol. 1987;123:73–84. doi: 10.1016/0012-1606(87)90429-5. [DOI] [PubMed] [Google Scholar]
- 17.Kanamura S, Kanai K, Watanabe J. Fine structure and function of hepatocytes during development. J Electron Microsc Tech. 1990;14:92–105. doi: 10.1002/jemt.1060140204. [DOI] [PubMed] [Google Scholar]
- 18.Little JM, Smallwood RA, Lester R, Piasecki GJ, Jackson BT. Bile-salt metabolism in the primate fetus. Gastroenterology. 1975;69:1315–1320. [PubMed] [Google Scholar]
- 19.Little JM, Richey JE, Van Thiel DH, Lester R. Taurocholate pool size and distribution in the fetal rat. J Clin Invest. 1979;63:1042–1049. doi: 10.1172/JCI109373. [DOI] [PMC free article] [PubMed] [Google Scholar]
- 20.Fu D, Wakabayashi Y, Ido Y, Lippincott-Schwartz J, Arias IM. Regulation of bile canalicular network formation and maintenance by AMP-activated protein kinase and LKB1. J Cell Sci. 2010;123:3294–3302. doi: 10.1242/jcs.068098. [DOI] [PMC free article] [PubMed] [Google Scholar]
- 21.Le M, et al. Bile acids stimulate PKCalpha autophosphorylation and activation: Role in the attenuation of prostaglandin E1-induced cAMP production in human dermal fibroblasts. Am J Physiol Gastrointest Liver Physiol. 2006;291:G275–G287. doi: 10.1152/ajpgi.00346.2005. [DOI] [PubMed] [Google Scholar]
- 22.Meng JP, et al. Biphasic regulation by bile acids of dermal fibroblast proliferation through regulation of cAMP production and COX-2 expression level. Am J Physiol Cell Physiol. 2006;291:C546–C554. doi: 10.1152/ajpcell.00011.2006. [DOI] [PubMed] [Google Scholar]
- 23.Chignard N, et al. Bile salts potentiate adenylyl cyclase activity and cAMP-regulated secretion in human gallbladder epithelium. Am J Physiol Gastrointest Liver Physiol. 2003;284:G205–G212. doi: 10.1152/ajpgi.00292.2002. [DOI] [PubMed] [Google Scholar]
- 24.Bos JL. Epac proteins: Multi-purpose cAMP targets. Trends Biochem Sci. 2006;31:680–686. doi: 10.1016/j.tibs.2006.10.002. [DOI] [PubMed] [Google Scholar]
- 25.Bos JL, de Rooij J, Reedquist KA. Rap1 signalling: Adhering to new models. Nat Rev Mol Cell Biol. 2001;2:369–377. doi: 10.1038/35073073. [DOI] [PubMed] [Google Scholar]
- 26.Wittchen ES, et al. Rap1 GTPase inhibits leukocyte transmigration by promoting endothelial barrier function. J Biol Chem. 2005;280:11675–11682. doi: 10.1074/jbc.M412595200. [DOI] [PubMed] [Google Scholar]
- 27.Ménard C, et al. An essential role for a MEK-C/EBP pathway during growth factor-regulated cortical neurogenesis. Neuron. 2002;36:597–610. doi: 10.1016/s0896-6273(02)01026-7. [DOI] [PubMed] [Google Scholar]
- 28.Seger R, Krebs EG. The MAPK signaling cascade. FASEB J. 1995;9:726–735. [PubMed] [Google Scholar]
- 29.Zheng CF, Guan KL. Activation of MEK family kinases requires phosphorylation of two conserved Ser/Thr residues. EMBO J. 1994;13:1123–1131. doi: 10.1002/j.1460-2075.1994.tb06361.x. [DOI] [PMC free article] [PubMed] [Google Scholar]
- 30.Alessi DR, et al. Identification of the sites in MAP kinase kinase-1 phosphorylated by p74raf-1. EMBO J. 1994;13:1610–1619. doi: 10.1002/j.1460-2075.1994.tb06424.x. [DOI] [PMC free article] [PubMed] [Google Scholar]
- 31.Dunn JC, Yarmush ML, Koebe HG, Tompkins RG. Hepatocyte function and extracellular matrix geometry: long-term culture in a sandwich configuration. FASEB J. 1989;3:174–177. doi: 10.1096/fasebj.3.2.2914628. [DOI] [PubMed] [Google Scholar]
- 32.LeCluyse EL, Audus KL, Hochman JH. Formation of extensive canalicular networks by rat hepatocytes cultured in collagen-sandwich configuration. Am J Physiol. 1994;266:C1764–C1774. doi: 10.1152/ajpcell.1994.266.6.C1764. [DOI] [PubMed] [Google Scholar]
- 33.Bouscarel B, Gettys TW, Fromm H, Dubner H. Ursodeoxycholic acid inhibits glucagon-induced cAMP formation in hamster hepatocytes: A role for PKC. Am J Physiol. 1995;268:G300–G310. doi: 10.1152/ajpgi.1995.268.2.G300. [DOI] [PubMed] [Google Scholar]
- 34.Avruch J. Insulin signal transduction through protein kinase cascades. Mol Cell Biochem. 1998;182:31–48. [PubMed] [Google Scholar]
- 35.Farah AE. Glucagon and the circulation. Pharmacol Rev. 1983;35:181–217. [PubMed] [Google Scholar]
- 36.Feldman RD, Gros R. New insights into the regulation of cAMP synthesis beyond GPCR/G protein activation: Implications in cardiovascular regulation. Life Sci. 2007;81:267–271. doi: 10.1016/j.lfs.2007.05.015. [DOI] [PubMed] [Google Scholar]
- 37.Allen K, Kim ND, Moon JO, Copple BL. Upregulation of early growth response factor-1 by bile acids requires mitogen-activated protein kinase signaling. Toxicol Appl Pharmacol. 2010;243:63–67. doi: 10.1016/j.taap.2009.11.013. [DOI] [PMC free article] [PubMed] [Google Scholar]
- 38.Rao YP, et al. Activation of the Raf-1/MEK/ERK cascade by bile acids occurs via the epidermal growth factor receptor in primary rat hepatocytes. Hepatology. 2002;35:307–314. doi: 10.1053/jhep.2002.31104. [DOI] [PubMed] [Google Scholar]
- 39.Sapkota GP, et al. Phosphorylation of the protein kinase mutated in Peutz-Jeghers cancer syndrome, LKB1/STK11, at Ser431 by p90(RSK) and cAMP-dependent protein kinase, but not its farnesylation at Cys(433), is essential for LKB1 to suppress cell vrowth. J Biol Chem. 2001;276:19469–19482. doi: 10.1074/jbc.M009953200. [DOI] [PubMed] [Google Scholar]
- 40.Fogarty S, Hardie DG. C-terminal phosphorylation of LKB1 is not required for regulation of AMP-activated protein kinase, BRSK1, BRSK2, or cell cycle arrest. J Biol Chem. 2009;284:77–84. doi: 10.1074/jbc.M806152200. [DOI] [PMC free article] [PubMed] [Google Scholar]
- 41.Esteve-Puig R, Canals F, Colomé N, Merlino G, Recio JA. Uncoupling of the LKB1-AMPKalpha energy sensor pathway by growth factors and oncogenic BRAF. PLoS ONE. 2009;4:e4771. doi: 10.1371/journal.pone.0004771. [DOI] [PMC free article] [PubMed] [Google Scholar]
- 42.Zheng B, et al. Oncogenic B-RAF negatively regulates the tumor suppressor LKB1 to promote melanoma cell proliferation. Mol Cell. 2009;33:237–247. doi: 10.1016/j.molcel.2008.12.026. [DOI] [PMC free article] [PubMed] [Google Scholar]
- 43.Baas AF, et al. Complete polarization of single intestinal epithelial cells upon activation of LKB1 by STRAD. Cell. 2004;116:457–466. doi: 10.1016/s0092-8674(04)00114-x. [DOI] [PubMed] [Google Scholar]
- 44.Shelly M, Cancedda L, Heilshorn S, Sumbre G, Poo MM. LKB1/STRAD promotes axon initiation during neuronal polarization. Cell. 2007;129:565–577. doi: 10.1016/j.cell.2007.04.012. [DOI] [PubMed] [Google Scholar]
- 45.Lee JH, et al. Energy-dependent regulation of cell structure by AMP-activated protein kinase. Nature. 2007;447:1017–1020. doi: 10.1038/nature05828. [DOI] [PubMed] [Google Scholar]
- 46.Zheng B, Cantley LC. Regulation of epithelial tight junction assembly and disassembly by AMP-activated protein kinase. Proc Natl Acad Sci USA. 2007;104:819–822. doi: 10.1073/pnas.0610157104. [DOI] [PMC free article] [PubMed] [Google Scholar]
- 47.Zhang L, Li J, Young LH, Caplan MJ. AMP-activated protein kinase regulates the assembly of epithelial tight junctions. Proc Natl Acad Sci USA. 2006;103:17272–17277. doi: 10.1073/pnas.0608531103. [DOI] [PMC free article] [PubMed] [Google Scholar]
- 48.Mitonaka T, Muramatsu Y, Sugiyama S, Mizuno T, Nishida Y. Essential roles of myosin phosphatase in the maintenance of epithelial cell integrity of Drosophila imaginal disc cells. Dev Biol. 2007;309:78–86. doi: 10.1016/j.ydbio.2007.06.021. [DOI] [PubMed] [Google Scholar]
- 49.Zagórska A, et al. New roles for the LKB1-NUAK pathway in controlling myosin phosphatase complexes and cell adhesion. Sci Signal. 2010;3:ra25. doi: 10.1126/scisignal.2000616. [DOI] [PubMed] [Google Scholar]
Associated Data
This section collects any data citations, data availability statements, or supplementary materials included in this article.


