

Abstract
Objective
Aggressive treatment style, as defined by the Dartmouth Atlas of Health Care, has been implicated as an important factor contributing to excessively high medical expenditures. We aimed to determine the association between aggressive treatment style and surgical outcomes.
Data Sources/Study Setting
Medicare admissions to 3,065 hospitals for general, orthopedic, and vascular surgery between 2000 and 2005 (N = 4,558,215 unique patients).
Study Design
A retrospective cohort analysis.
Results
For elderly surgical patients, aggressive treatment style was not associated with significantly increased complications, but it was associated with significantly reduced odds of mortality and failure-to-rescue. The odds ratio for complications in hospitals at the 75th percentile of aggressive treatment style compared with those at the 25th percentile (a U.S.$10,000 difference) was 1.01 (1.00–1.02), p <.066; whereas the odds of mortality was 0.94 (0.93–0.95), p <.0001; and for failure-to-rescue it was 0.93 (0.92–0.94), p <.0001. Analyses that used alternative measures of aggressiveness—hospital days and ICU days—yielded similar results, as did analyses using only low-variation procedures.
Conclusions
Attempting to reduce aggressive care that is not cost effective is a laudable goal, but policy makers should be aware that there may be improved outcomes associated with patients undergoing surgery in hospitals with a more aggressive treatment style.
Keywords: Dartmouth Atlas, aggressive treatment style, Medicare, mortality, complications, failure-to-rescue
The seminal works of John Wennberg (Wennberg and Gittelsohn 1973; Wennberg, Freeman, and Culp 1987;) documenting substantial geographic variation in use of health care services, more recently updated by Fisher et al. (2003a,b); concerning aggressive treatment style, have played an important role in understanding our health care system. The Dartmouth Atlas (Wennberg et al. 1998) now calculates several measures of the resources expended in the last 2 years of life for Medicare patients diagnosed with one of nine medical conditions to capture a hospital's style of aggressiveness. Some of the most widely referred to measures are average total spending, ICU days, and hospital inpatient days for these patients. Patients and policy makers are now able to evaluate a hospital on its aggressive style, that is, how many resources it uses to treat patients at the end of life. As aggressive treatment style is one of the most widely cited causes of waste in our health care system (Fisher et al. 2003a,b; Orszag and Ellis 2007; Fisher, Bynum, and Skinner 2009; Gawande 2009; Orszag 2009; The White House Office of the Press Secretary 2009;), we sought to better understand how this style of practice may influence surgical outcomes in the Medicare population.
We ask whether the level of intensity of treatment, or what we will refer to as “aggressive treatment style” as defined by the Dartmouth Atlas, has benefits or risks associated with mortality outcomes. We examine whether hospital-level measures of intensity or aggressiveness are predictors of outcomes among surgical patients. While it has been asserted that aggressiveness increases complications and worsens mortality rates (Fisher et al. 2003b; Skinner, Staiger, and Fisher 2006; Consumer Reports Health.org 2008; Gawande 2009;), we assess whether there is an increased rate of complications in surgical patients at more aggressive hospitals, and whether levels of aggressiveness are associated with differences in mortality. An advantage of studying surgical patients is that one can more easily define complications than in medical patients (Lawthers et al. 2000), and in surgical patients we can measure failure-to-rescue (the probability of surviving complications), which is an outcome less susceptible to confounding from unmeasured patient severity than complications and mortality (Silber, Rosenbaum, and Ross 1995a; Silber et al. 1992, 1995b, 2007). The analysis focuses on the association between aggressive treatment style and patient outcomes after surgery. We do not investigate whether “aggressiveness” is associated with the incidence of surgery, although we conduct some analyses that assess the issue of potential patient selection by studying low-variation procedures (Wennberg and Gittelsohn 1973; Wennberg, Freeman, and Culp 1987;) (or less discretionary procedures) and ask whether we observe the same findings as in the overall study.
METHODS
Conceptual Framework
We first present a simple identity that governs the net change in outcome (e.g., death) from a change in hospital aggressiveness. Consider a change in a hospital's treatment of patients, that is, its intensity of care or “aggressiveness,” as moving from the 25th to 75th percentile of the distribution of an aggressive treatment style measure such as total end-of-life expenditure as found in the Dartmouth Atlas. We can write the identity as the sum of the conditional probability of death for those who do and do not have surgery:
| (1) |
Equation (1) states that the probability of death “p(D)” is equal to the probability of death given a patient receives surgery “p(D|S=1)” multiplied by the probability of having surgery “p(S=1)” plus the probability of death given no surgery is performed “p(D|S=0)” multiplied by the probability that no surgery is performed “p(S=0).” We view p(D|S=1) as surgical care quality. If one undergoes surgery, does the patient have a good chance at survival (after adequately adjusting for severity)? p(S=1) is the surgical incidence. Finally, p(D|S=0) is “nonsurgical mortality.” If a patient does not undergo surgery, the death rate should be low, unless patients were being deprived of needed surgery.
From a policy perspective, one may wish to determine whether a change in aggressiveness “ΔA” (e.g., a change from, say the 25th to the 75th percentile of aggressiveness) will increase or decrease mortality. If we differentiate p(D) with respect to A, we get the following expression (for details see Appendix SA2):
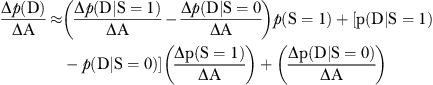 |
(2) |
The change in the probability of dying in response to a change in aggressiveness is Δp(D)/ΔA depends on three factors (see Equation 2 of Appendix SA2 for details):
Δp(D|S=1)/ΔA, which is the change in probability of death given surgery (surgical quality of care) after a change in aggressiveness;
Δp(D|S=0)/ΔA, which is the change in the probability of death in those not receiving surgery—a measure of nonsurgical mortality after a change in aggressiveness; and finally
Δp(S=1)/ΔA, which is the change in surgical incidence after a change in aggressiveness.
This paper focuses on the estimate of Δp(D|S=1)/ΔA, the change in the probability of death after surgery given a change in aggressiveness. Thus, we do not assess the full effect of a change in aggressiveness on mortality because we do not identify all three factors. However, our focus is important because much of the discussion about health care reform considers only the influence of aggressiveness, as measured by the change in surgical incidence (Δp(S=1)/ΔA), assuming that Δp(D|S=1)/ΔA is zero or even positive (Fisher et al. 2003b). Much less attention has been paid to the other two factors: Δp(D|S=1)/ΔA (change in surgical quality) and Δp(D|S=0)/ΔA (change in nonsurgical mortality). Our analysis centers on the relationship between aggressiveness and surgical quality because understanding this relationship will aid in implementing any policy that aims to reduce hospital aggressiveness in order to help reduce costs.
Population
A description of the data set and the selection/exclusion criteria has been reported previously (Volpp et al. 2007b, 2009; Silber et al. 2009). We examined elderly Medicare patients admitted to short-term general nonfederal acute-care hospitals from July 1, 2000 to June 30, 2005 with principal procedure/diagnosis-related groups (DRG) classification of general, orthopedic, or vascular surgery. The initial sample included 6,510,766 surgical patients from 5,736 acute care hospitals within 50 states. After exclusions, a total sample of 4,558,215 patients from 3,065 hospitals was left.
Defining Aggressive Treatment Style
For most hospitals in the United States, researchers associated with the Dartmouth Atlas of Health Care (The Dartmouth Atlas Working Group 2009) constructed measures of a hospital's intensity of resource use during the last 2 years of life for all deceased with nine chronic illnesses: malignant cancer/leukemia, congestive heart failure, chronic pulmonary disease, dementia, diabetes with end organ damage, peripheral vascular disease, chronic renal failure, severe chronic liver disease, and coronary artery disease. Deceased patients were assigned to the hospital in which they were admitted most often, and the aggressiveness measures were calculated for the period 2001–2005. All aggressiveness measures were adjusted for differences in patient age and sex. We focus on three measures of hospital's intensity associated with patients in their last 2 years of life: total hospital expenditures, total ICU days, and total hospital days. These measures are reported by the Dartmouth Atlas at the hospital level and do not represent figures based on a specific patient in our dataset. We use the Dartmouth Atlas as it was intended—to identify hospitals with styles that are more or less aggressive, as defined by their aggressiveness metric.
Defining Outcomes
Outcome measures were death within 30 days of hospital admission, in-hospital complications, and failure-to-rescue. A patient was considered to have developed a complication if any complication was noted during the index hospitalization, based on an algorithm published previously (Silber et al. 2007) in which the 1999–2000 Medicare Provider Analysis and Treatment File (MEDPAR) was used. Failure-to-rescue was defined as a death following an in-hospital complication and both the complication list and failure-to-rescue definitions have been described in detail in other publications (Silber, Rosenbaum, and Ross 1995a; Silber et al. 1992, 1995b, 2007) and are available online (National Quality Forum 2008a,b; The Center for Outcomes Research at The Children's Hospital of Philadelphia 2009;).
Risk-Adjustment Variables
We used the risk-adjustment approach that was developed by Elixhauser et al. (1998) at AHRQ with modifications which we have published on in recent work (Volpp et al. 2007b, 2009; Silber et al. 2009). The risk adjustment included age, sex, 27 comorbidities (excluding fluid and electrolyte disorders and coagulopathy) (Glance et al. 2006), and 37 interaction terms that we derived from previous models. A 180-day lookback was used for identifying comorbidities (Deyo, Cherkin, and Ciol 1992; Romano, Roos, and Jollis 1993; Stukenborg, Wagner, and Connors 2001; Silber et al. 2007;). There were a total of 82 DRG/principal procedure groups (Silber et al. 2007).
Defining Hospital Characteristics
The number of residents per hospital was obtained from Medicare Cost Reports. The resident-to-bed ratio is defined as the ratio of (interns+residents)/average operating beds (Ayanian and Weissman 2002; Volpp et al. 2007a,b;) and has been used in previous studies (Taylor, Whellan, and Sloan 1999; Volpp et al. 2007b;) to quantify teaching intensity. We defined nurse mix as the number of full-time equivalent (FTE) registered nurses (RNs) divided by the RN plus licensed practical nurses FTEs. The nurse-to-bed ratio was defined as RNs/average daily census. The Hospital Technology Index was defined to be 1 if hospitals performed open heart surgery, organ transplantation, or had a burn unit; otherwise the index was 0 (Silber et al. 2009). Hospital size was defined by the number of staffed beds as reported in the American Hospital Association Annual Survey.
Regression Models
We obtain estimates of the associations of interest using both logit regression models (using SAS SURVEYLOGISTIC procedure, which accounts for the clustering of patients within hospitals; SAS Institute Inc. 2009) and hospital random effects in a hierarchical model (using SAS GLIMMIX) (SAS Institute Inc. 2008). We estimated five regression models using these two types of methods: (1) a base model including an aggressive treatment style measure only adjusting for procedure type; (2) patient characteristics and procedure type; (3) procedure, patient, and five hospital characteristics; (4) procedure, patient characteristics, five hospital characteristics, and geographic region fixed effects; and (5) procedure, patient, and five hospital characteristics in a random effects model where each hospital has its own effect.
RESULTS
The first outcome we examined was the probability of developing a complication during the surgical stay. Note that the overall rate of patients who developed at least one of 39 types of complications was 44 percent, consistent with our previous work (Silber et al. 2007, 2009). In Table 1 we can observe the influence of a more aggressive style versus a less aggressive style by comparing the odds of developing a complication when going from the 25th percentile of aggressiveness to the 75th percentile of aggressiveness for each of the three measures of aggressiveness. As can be seen in Table 1, there was almost no association between the odds of developing a complication and the level of aggressiveness at the hospital.
Table 1.
The Association between (1) a U.S.$10,000 Change in Total Expenditures; (2) a 4-Day Change in Total Hospital Days; and (3) a 3-Day Stay in ICU Days (All a 25th to 75th Percentile Change in Aggressive Treatment Style) and the Outcomes of Complications
| Complications | Odds Ratio | 95% CI | p-Value | Number of Patients | Crude Rate (%) | C-Statistic |
|---|---|---|---|---|---|---|
| In U.S.$10,000 units | ||||||
| Procedure | 1.01 | (0.99–1.02) | .395 | 4,469,047 | 43.52 | 0.707 |
| Procedure and patient characteristics | 1.01 | (1.00–1.02) | .058 | 4,469,047 | 43.52 | 0.785 |
| Procedure, patient, and hospital characteristics | 1.01 | (1.00–1.02) | .051 | 4,465,736 | 43.52 | 0.785 |
| Procedure, patient, and hospital characteristics and region | 1.01 | (1.00–1.03) | .091 | 4,465,736 | 43.52 | 0.785 |
| Procedure, patient, and hospital characteristics and hospital (RE model) | 1.01 | (1.00–1.02) | .066 | 4,465,736 | 43.52 | 0.794 |
| In hospital days | ||||||
| Procedure | 1.01 | (1.00–1.02) | .182 | 4,558,215 | 43.47 | 0.707 |
| Procedure and patient characteristics | 1.01 | (1.00–1.02) | .145 | 4,558,215 | 43.47 | 0.785 |
| Procedure, patient, and hospital characteristics | 1.01 | (1.00–1.02) | .220 | 4,554,904 | 43.47 | 0.785 |
| Procedure, patient, and hospital characteristics and region | 1.00 | (0.98–1.02) | .983 | 4,554,904 | 43.47 | 0.785 |
| Procedure, patient, and hospital characteristics and hospital (RE model) | 1.00 | (0.99–1.02) | .645 | 4,554,904 | 43.47 | 0.794 |
| In ICU days | ||||||
| Procedure | 1.00 | (0.98–1.02) | .888 | 4,542,478 | 43.47 | 0.707 |
| Procedure and patient characteristics | 0.99 | (0.98–1.01) | .486 | 4,542,478 | 43.47 | 0.785 |
| Procedure, patient, and hospital characteristics | 1.00 | (0.98–1.01) | .659 | 4,539,167 | 43.47 | 0.785 |
| Procedure, patient, and hospital characteristics and region | 1.00 | (0.98–1.02) | .801 | 4,539,167 | 43.47 | 0.785 |
| Procedure, patient, and hospital characteristics and hospital (RE model) | 0.99 | (0.98–1.01) | .441 | 4,539,167 | 43.47 | 0.794 |
Note. Hospital adjustments include RB ratio, NTB ratio, N-mix ratio, technology, and size. Regions are the 10 Medicare regions. RE model refers to random effects model using SAS GLIMMIX.
ICU, intensive care unit; N-mix, nurse mix; NTB ratio, nurse-to-bed ratio; RB ratio, resident-to-bed.
Table 2 examines whether the style of aggressiveness was associated with the probability of death. Here we found significant associations between aggressiveness and mortality, where the greater the aggressiveness the lower the probability of dying. We observed about a 6–7 percent decline in the odds of dying for a shift from the 25th to the 75th percentile in aggressiveness, when measuring aggressiveness by total expenditures or hospital days. For ICU days, there was approximately a 4 percent reduction in the odds of dying.
Table 2.
The Association between (1) a U.S.$10,000 Change in Total Expenditures; (2) a 4-Day Change in Total Hospital Days; and (3) a 3-Day Stay in ICU Days (All a 25th to 75th Percentile Change in Aggressive Treatment Style) and the Outcome of 30-Day Mortality
| Mortality | Odds Ratio | 95% CI | p-Value | Number of Patients | Crude Rate (%) | C-Statistic |
|---|---|---|---|---|---|---|
| In U.S.$10,000 units | ||||||
| Procedure | 0.94 | (0.93–0.96) | <.0001 | 4,469,047 | 4.27 | 0.797 |
| Procedure and patient characteristics | 0.93 | (0.92–0.95) | <.0001 | 4,469,047 | 4.27 | 0.865 |
| Procedure, patient, and hospital characteristics | 0.94 | (0.93–0.96) | <.0001 | 4,465,736 | 4.27 | 0.865 |
| Procedure, patient, and hospital characteristics and region | 0.94 | (0.92–0.95) | <.0001 | 4,465,736 | 4.26 | 0.865 |
| Procedure, patient, and hospital characteristics and hospital (RE model) | 0.94 | (0.93–0.95) | <.0001 | 4,465,736 | 4.27 | 0.866 |
| In hospital days | ||||||
| Procedure | 0.96 | (0.94–0.97) | <.0001 | 4,558,215 | 4.25 | 0.796 |
| Procedure and patient characteristics | 0.94 | (0.92–0.96) | <.0001 | 4,558,215 | 4.25 | 0.865 |
| Procedure, patient, and hospital characteristics | 0.95 | (0.93–0.97) | <.0001 | 4,554,904 | 4.25 | 0.865 |
| Procedure, patient, and hospital characteristics and region | 0.94 | (0.92–0.96) | <.0001 | 4,554,904 | 4.25 | 0.865 |
| Procedure, patient, and hospital characteristics and hospital (RE model) | 0.94 | (0.93–0.96) | <.0001 | 4,554,904 | 4.25 | 0.866 |
| In ICU days | ||||||
| Procedure | 0.97 | (0.96–0.99) | <.0001 | 4,542,478 | 4.25 | 0.796 |
| Procedure and patient characteristics | 0.95 | (0.94–0.96) | <.0001 | 4,542,478 | 4.25 | 0.865 |
| Procedure, patient, and hospital characteristics | 0.96 | (0.95–0.97) | <.0001 | 4,539,167 | 4.25 | 0.865 |
| Procedure, patient, and hospital characteristics and region | 0.96 | (0.95–0.97) | <.0001 | 4,539,167 | 4.25 | 0.865 |
| Procedure, patient, and hospital characteristics and hospital (RE model) | 0.96 | (0.95–0.97) | <.0001 | 4,539,167 | 4.25 | 0.866 |
Note. Hospital adjustments include RB ratio, NTB ratio, N-mix ratio, technology, and size. Regions are the 10 Medicare regions. RE model refers to random effects model using SAS GLIMMIX.
ICU, intensive care unit; N-mix, nurse mix; NTB ratio, nurse-to-bed ratio; RB ratio, resident-to-bed.
Table 3 displays the association between aggressiveness and failure-to-rescue. Again, we see significant differences associated with aggressiveness, which are slightly larger than with mortality. In other words, once a patient develops a complication, more aggressive hospitals appear to do a better job at preventing mortality by reducing failure-to-rescue than less aggressive hospitals, with odds ratios associated with a shift from the 25th to the 75th percentile in aggressiveness corresponding to a 5–8 percent reduction in the odds of failure-to-rescue.
Table 3.
The Association between (1) a U.S.$10,000 Change in Total Expenditures; (2) a 4-Day Change in Total Hospital Days; and (3) a 3-Day Stay in ICU Days (All a 25th to 75th Percentile Change in Aggressive Treatment Style) and the Outcome of Failure-to-Rescue
| Failure-to-Rescue | Odds Ratio | 95% CI | p-Value | Number of Patients | Crude Rate (%) | C-Statistic |
|---|---|---|---|---|---|---|
| In U.S.$10,000 units | ||||||
| Procedure | 0.94 | (0.92–0.95) | <.0001 | 1,945,101 | 9.80 | 0.724 |
| Procedure and patient characteristics | 0.93 | (0.91–0.94) | <.0001 | 1,945,101 | 9.80 | 0.789 |
| Procedure, patient, and hospital characteristics | 0.93 | (0.92–0.95) | <.0001 | 1,943,638 | 9.80 | 0.790 |
| Procedure, patient, and hospital characteristics and region | 0.93 | (0.91–0.95) | <.0001 | 1,943,638 | 9.80 | 0.789 |
| Procedure, patient, and hospital characteristics and hospital (RE model) | 0.93 | (0.92–0.94) | <.0001 | 1,943,638 | 9.80 | 0.795 |
| In hospital days | ||||||
| Procedure | 0.94 | (0.93–0.96) | <.0001 | 1,981,626 | 9.78 | 0.723 |
| Procedure and patient characteristics | 0.93 | (0.91–0.95) | <.0001 | 1,981,626 | 9.78 | 0.789 |
| Procedure, patient, and hospital characteristics | 0.94 | (0.92–0.96) | <.0001 | 1,980,163 | 9.78 | 0.789 |
| Procedure, patient, and hospital characteristics and region | 0.93 | (0.91–0.96) | <.0001 | 1,980,163 | 9.78 | 0.789 |
| Procedure, patient, and hospital characteristics and hospital (RE model) | 0.94 | (0.93–0.95) | <.0001 | 1,980,163 | 9.78 | 0.795 |
| In ICU days | ||||||
| Procedure | 0.96 | (0.95–0.98) | <.0001 | 1,974,837 | 9.78 | 0.723 |
| Procedure and patient characteristics | 0.95 | (0.93–0.96) | <.0001 | 1,974,837 | 9.78 | 0.789 |
| Procedure, patient, and hospital characteristics | 0.96 | (0.94–0.97) | <.0001 | 1,973,374 | 9.78 | 0.789 |
| Procedure, patient, and hospital characteristics and region | 0.96 | (0.94–0.97) | <.0001 | 1,973,374 | 9.78 | 0.789 |
| Procedure, patient, and hospital characteristics and hospital (RE model) | 0.95 | (0.94–0.96) | <.0001 | 1,973,374 | 9.78 | 0.795 |
Note. Hospital adjustments include RB ratio, NTB ratio, N-Mix ratio, technology, and size. Regions are the 10 Medicare regions. RE model refers to random effects model using SAS GLIMMIX.
ICU, intensive care unit; N-mix, nurse mix; NTB ratio, nurse-to-bed ratio; RB ratio, resident-to-bed.
Examining Longer Follow-Up Intervals: Are Survival Benefits Associated with Aggressive Hospitals Durable?
We chose to report 30-day mortality because it is the most widely utilized measure of surgical quality, precisely because the 30-day interval allows for including most deaths that are associated with surgery yet does not extend so far from the index hospitalization as to become a poor reflection of the actual care provided in the index hospitalization due to confounding from other extraneous postdischarge treatment effects and baseline hazards. In contrast, Fisher et al. (2003a,b); have used 365-day mortality and even 5-year mortality when reporting the lack of association between aggressiveness and mortality in surgical procedures, and most recently Barnato and colleagues have suggested that longer follow-up intervals show smaller associations between aggressiveness and outcomes, although still finding significant associations at 180 days.
In Table 4 (on the left-hand side) we report on 30-, 60-, 90-, and 365-day mortality for two models, one with procedure and patient characteristics and one with procedure, patient, and hospital characteristics and region identifiers (identical to the specifications in the second and fourth models in Table 2 for a U.S.$10,000 change in aggressiveness). For each of these models we also report odds ratios for 365-day mortality in patients who survived either 30, 60, or 90 days (see the right-hand side of the table).
Table 4.
Testing for Durable Effects from Aggressiveness
| Full Model | 365-Day Mortality Conditional on Surviving 30, 60, and 90 Days‡ | ||||||
|---|---|---|---|---|---|---|---|
| Outcome Measure | Model Adjustments | Odds Ratio | 95% CI | p-Value | Odds Ratio | 95% CI | p-Value |
| 30-day mortality | P* | 0.934 | (0.919, 0.949) | <.0001 | 1.004 | (0.996, 1.013) | .3225 |
| P, H, R† | 0.937 | (0.919, 0.955) | <.0001 | 1.007 | (0.996, 1.018) | .2006 | |
| 60-day mortality | P | 0.958 | (0.947, 0.969) | <.0001 | 1.004 | (0.996, 1.013) | .3277 |
| P, H, R | 0.959 | (0.947, 0.972) | <.0001 | 1.008 | (0.997, 1.020) | .1316 | |
| 90-day mortality | P | 0.969 | (0.959, 0.979) | <.0001 | 1.003 | (0.995, 1.011) | .5042 |
| P, H, R | 0.971 | (0.960, 0.981) | <.0001 | 1.007 | (0.997, 1.017) | .1775 | |
| 365-day mortality | P | 0.987 | (0.979, 0.995) | .0011 | NA | NA | NA |
| P, H, R | 0.990 | (0.980, 0.999) | .0312 | NA | NA | NA | |
Notes. Presented below are the logistic regression adjusted odds ratios of 30, 60, 90, and 365-day mortality associated with a U.S.$10,000 increase in aggressive treatment style showing a significant reduction in the odds of dying for all models. To test whether the decline in the odds ratio associated with aggressiveness was durable, we also asked whether 365-day mortality was a function of aggressiveness conditional on surviving 30, 60, or 90 days from the index admission (see right-hand side of table). The results show no association between aggressive treatment style and 365-day mortality conditional on patient survival beyond 30 days. The early benefit of going to a more aggressive hospital appears to be durable.
P denotes model with patient characteristics identical to model in Table 1.
P, H, R denotes model with patients and hospital characteristics and region identical to Table 1.
The 365-day mortality conditional on surviving 30 days is computed by fitting a 365-day mortality model without including those patients who die before 30 days. 365-day mortality conditional on 60- and 90-day survival was calculated in a parallel manner.
Consistent with Barnato et al. (2010), more aggressive hospitals are significantly associated with a lower odds of mortality using either 30-, 60-, 90-, or 365-day mortality (though by 365 days the effect appears much smaller). However, when we look at the 365-day results only in those who survived beyond 30, 60, or 90 days (the right-hand side of Table 4), we see that there is no increase in the hazard of dying in patients treated at more aggressive versus less aggressive hospitals. Therefore, the early survival advantage from admission to more versus less aggressive hospitals appears to be durable. This advantage is not as apparent in the 365-day analysis, in part because the normal hazard rate for mortality in patients after surgery (both those admitted to more or less aggressive hospitals) is diluting out the benefits that occur in the early period. The use of short-term mortality such as 30-day mortality appears to be appropriate when studying this question, because the deaths observed after this early period occur at the same rate in both the survivors of more or less aggressive index hospitalizations. Reporting only the unconditional 365-day mortality would severely underestimate the survival advantages at more aggressive hospitals by allowing the similar late hazard for mortality in both groups to dilute the initial and durable 30-day mortality advantage observed in the more aggressive hospitals.
Examining Low-Variation/Low-Discretionary Surgeries
In the classic studies of Wennberg (Wennberg, Freeman, and Culp 1987), procedures were grouped by their variation in utilization. Low-variation procedures were ones thought to have low discretion on the part of the health care provider and hence would be associated with less selection bias. For the present study, presumably these low-variation procedures would be performed at similar rates at more and less aggressive hospitals and hence less potential differences in patient unobserved severity between hospitals would be expected. In this case, if we see benefits from aggressiveness in the low-variation procedures, this would provide us with some reassurance that such benefits of aggressiveness were not due to unobserved severity in the lower aggressiveness hospitals, as there was little discretion in receiving such procedures. Seeing similar results across low-variation procedures as compared with our overall results would reassure us that what we are reporting in Tables 1–3 is not an artifact due to unobserved severity.
We therefore examined the influence of aggressiveness on procedures that displayed higher or lower variation in use across all health referral regions (HRRs) (Wennberg et al. 1996) in the data set. To do this, we modeled Medicare's DRGs for our study population combining those described as with or without comorbidities or complications into 31 unique entities. Using these DRG procedure groups, we estimated the probability of a patient undergoing one of these procedures based on a random effects model (using GLIMMIX) that included age, sex, 27 patient comorbidities, and the 114 HRRs. We ran separate models for each of the 31 DRG groups. The associated across-HRR variance using the GLIMMIX random effects model was our estimate of adjusted procedure rate variation. We ranked all DRG procedure groups based on their across HRR variance and defined the bottom third as the low-variation group. (We provide these DRGs in Table 4 of Appendix SA2.) For these low-variation procedures, we examined the association of complications, deaths, and failure-to-rescue with aggressiveness defined by Dartmouth Atlas hospital-specific end-of-life expenditures, hospital days, and ICU days, fitting the same four types of models as described for Tables 1–3.
As is reported in Tables 1b, 2b, and 3b of Appendix SA2, our results were almost identical when limiting our analysis to low-variation procedures. This reinforces the evidence presented earlier that there is no difference in the rate of complications among more or less aggressive hospitals. If an aggressive style was associated with a different composition of patients (different p(S=1)), then we may expect a different rate of complications in those selected for surgery, which was not the case. We also found similar mortality and failure-to-rescue rates.
We also examined a subset of cases that would be associated with more immediate need for surgery (hip fracture, appendectomy, and colectomy for colon cancer cases). Again, we found almost identical results to those reported in Tables 1–3 (see Tables 1c, 2c and 3c of Appendix SA2).
Studying Nonlinear Effects from Aggressive Treatment Style
Recent work by Barnato and colleagues suggests that as hospitals become more aggressive, the marginal benefit of the next unit of aggressiveness appears to decline. In order to study this in our model we used two approaches. We first added a quadratic term to the 30-day mortality model in Table 2 (model 4, the logit model with patient, hospital, and region). We found that the linear and quadratic terms for aggressiveness (where 1 unit=U.S.$10,000) were −0.1509x+0.00848x2, with both terms being significant at the p <.0001 level. At the 25th percentile of aggressiveness expenditure (x = 2.3687) the slope would correspond to −0.1106. At the 75th percentile of aggressiveness expenditure (x = 3.2593) the slope would correspond to −0.0956. The odds ratios associated with these slopes were almost identical (0.90 versus 0.91, respectively). Alternatively, we also modeled aggressiveness with a linear term that can take on different values above and below the median level of aggressiveness (corresponding to a breakpoint at the median value of U.S.$26,751). The slope (in the logit model) below the median was −0.0972 and the slope above the median was −0.0679 corresponding to odds ratios of 0.91 and 0.93, respectively. The difference between these slopes was not significant (p <.3478) despite being based on 4.47 million observations.
DISCUSSION
Conditional on having surgery, there appear to be some advantages associated with being operated on in hospitals that are categorized as having a more aggressive treatment style. Our results show that patients in more aggressive hospitals did not develop an increase in complications, and if a complication did occur, patients were significantly more likely to survive these events than in less aggressive hospitals.
Our results do not suggest that aggressiveness is unambiguously good, as we have focused on only one of three possible consequences of a more aggressive style—that being surgical quality of care (see Equations (1) and (2)). Aggressiveness may have adverse effects that operate through the other two channels: the probability of death for nonsurgical patients and the incidence of surgery. However, to make the case for reducing aggressiveness, any adverse effects that work through these other two channels must offset some of the positive effects suggested by our results.
Because aggressiveness does not influence the rate of complications, but does improve failure-to-rescue, we may ask if better survival in aggressive hospitals is a good thing. While we cannot assume that lower failure-to-rescue in aggressive hospitals is always desirable, it is a much more reasonable assumption than to believe that the increase in saved lives associated with higher aggressiveness is unfortunate—that a patient who develops a complication and is saved would have been better off dead. We found evidence from Table 4 that the better 30-day mortality associated with patients treated at more aggressive hospitals did not produce elevated death rates after 30 days in those survivors treated at the more aggressive hospitals as compared with 30-day survivors in less aggressive hospitals. Hence, the benefits associated with more aggressive hospitals appear durable.
Our study has several limitations. Our data were limited to Medicare claims and we did not have the ability to collect chart information. There may be selection of less severely ill patients in the hospitals with more aggressive treatment style that may account for our findings. We believe there is no indication that inadequate adjustment somehow led to the observed association between increased aggressiveness and better outcomes. All analyses, even ones with only adjustment for procedure, provided similar results. Second, when we calculated the probability of death following complications (the failure-to-rescue analyses), we again found similar results. As the failure-to-rescue analyses only include those with complications, the severity-adjustment problem is reduced because complicated patients are more homogeneously ill than a mixture of patients with and without complications (Silber, Rosenbaum, and Ross 1995a; Silber et al. 2007;). Finally, the stability analyses on a subset of patients having low-variation procedures also displayed similar findings. Nevertheless, we cannot rule out the possibility that hospitals deemed to be more aggressive through the aggressiveness measure are the very same hospitals that over-report complications and comorbidities. If this were the case, a spurious association may be observed between increased aggressiveness and lower adjusted mortality.
Another limitation involves our ability to be certain that aggressive treatment style measures as reflected in the Dartmouth Atlas for the nine conditions used to construct their measure are reasonable proxies for surgical care aggressiveness in the procedures we report on in this study. As evidence that the Dartmouth aggressiveness measure does reflect aggressive hospital style beyond the nine conditions used to define the measure, we have found that these aggressiveness measures are associated with total spending on surgical patients (Kaestner and Silber, unpublished data, 2009). Specifically, aggressiveness measures for a hospital were strongly and positively associated with resource use for patients admitted to that hospital for general surgery, orthopedic surgery, and vascular surgery. In other words, the same style that leads to high expenditure in the Dartmouth Atlas also leads to high expenditure on our surgical admissions within the same hospital. In Table 5 of Appendix SA2 we present the relationship between the aggressive treatment style measures and total hospital expenditures based on the surgical population in this study. We found that the Dartmouth aggressiveness measures were associated with overall hospital spending for the procedures we studied. Furthermore, a previous study by Barnato et al. (2009) has shown a high correlation between a hospital's end-of-life spending and a hospital's spending on all patients who are severely ill, that is, those with a probability of death >21 percent. Finally, and most important, if the aggressiveness measures were meaningful only for the nine conditions used in their measure, we should not have seen any significant relationship between these aggressiveness measures and our outcome measures, yet we found highly significant and large effects for both mortality and failure to rescue.
While we have reported our results in terms of adjusted odds ratios, it is also helpful to think about the absolute probability differences between hospitals with more or less aggressive treatment styles. To do this, we computed directly standardized (Bishop, Fienberg, and Holland 1975) 30-day death rates and failure-to-rescue rates for all patients in the study, assuming each patient was operated on in a hospital associated with a 25th percentile versus a 75th percentile aggressive treatment style. The mean differences in rates of death were 2.7, 1.6, and 6.7 deaths per 1,000 admissions for general surgery, orthopedics, and vascular surgery, respectively. For failure-to-rescue the rates were 5.6, 4.1, and 9.4 deaths per 1,000 patients with complications, respectively. In populations where the underlying mortality rate is higher, such as in vascular surgery, the significant reduction in the odds of death at hospitals with more aggressive treatment style is reflected in a larger number of reduced deaths than when the underlying risk of death (or failure-to-rescue) is lower.
One can easily imagine that while aggressive care is associated with better survival after surgery, the cost per life saved may be quite variable (Kaestner and Silber, unpublished data, 2009). In a recent study by Chandra and Staiger (2007), they find that aggressive hospital care may save lives and do so at a relatively low cost. Other studies report similar results (Card, Dobkin, and Maestas 2008; Doyle 2005; Doyle, unpublished data, 2008).
The fact that we found that increased aggressiveness was significantly associated with reduced mortality and reduced failure-to-rescue is an especially important observation given the nature of the definition of aggressiveness. Much has been made of the lack of association between aggressiveness and process measures (Yasaitis et al. 2009). If aggressiveness was not associated with better process, as the argument goes, then reducing aggressiveness should not worsen quality. Our results suggest that when measuring outcomes in surgical procedures, there appears to be a significant and durable benefit from undergoing surgery in hospitals with a more aggressive treatment style as defined by the Dartmouth Atlas.
Finally, in a recent study of heart failure outcomes in six California Hospitals, Ong et al. (2009) reported a strong association between increased aggressiveness and better outcomes, in distinction to the Dartmouth results. Ong points out that by defining aggressiveness through looking backward and only studying the deaths, there is an implicit assumption that the probability of death, conditional on severity, is not influenced by the intensity of treatment and furthermore that those who survived had similar expenditure patterns—something that may not be true if hospitals use the patient's chances of survival as a variable in deciding how to expend resources. In a similar manner, we chose to examine the outcomes of surgical patients looking forward in time, and we present findings consistent with Ong, but on a larger scale. Our thought was that the problems inherent in the aggressiveness methodology would be especially transparent in surgical patients because we could directly measure failure-to-rescue, the probability of death after complications. Presumably there are costs to rescuing patients who develop complications, and the choice to be less aggressive may directly influence the failure-to-rescue effectiveness.
Our findings suggest a more narrow application of the concept of “aggressiveness” than the one now widely adopted, as evidenced by articles in popular press and statements by policy makers. We have presented evidence of a beneficial effect of aggressive or intensive treatment of surgical patients, in contrast to the broader view that aggressiveness is wasteful. We believe that these results provide an important cautionary note for a national-level policy based on a one-size-fits-all interpretation of aggressiveness, for example, by reimbursing hospitals by making use of a standard of care that is based on differences in geographic variation in resource use such as the aggressiveness measures reported in the Dartmouth Atlas.
Why does aggressive care appear to be associated with better surgical outcomes? Possibly the more aggressive hospitals are also ones with better facilities for handling patients who develop complications. Note, however, that we did report similar results when we adjusted for the hospital characteristics of size, technology, nurse-to-bed ratio, nurse skill mix, and finally resident-to-bed ratio.
In conclusion, surgery at hospitals with more aggressive treatment styles is associated with better surgical outcomes. Studying these practice styles may help improve quality. The recent emphasis on comparative effectiveness research will hopefully allow us to better understand why patients operated on at more aggressive hospitals appear to have better outcomes.
Acknowledgments
Joint Acknowledgment/Disclosure Statement: This work was supported by National Heart, Lung, and Blood Institute grant R01 HL082637, “Impact of Resident Work Hour Rules on Errors and Quality.”
This work was presented at the AcademyHealth Annual Research Meeting in Chicago, Illinois, on June 30, 2009.
We thank Fabienne Kyle (B. A.) and Traci Frank (A. A.) for their assistance with preparing this manuscript.
Disclosures: None.
Disclaimers: None.
SUPPORTING INFORMATION
Additional supporting information may be found in the online version of this article:
Appendix SA1: Author Matrix.
Appendix SA2: Supplemental Information.
Please note: Wiley-Blackwell is not responsible for the content or functionality of any supporting materials supplied by the authors. Any queries (other than missing material) should be directed to the corresponding author for the article.
REFERENCES
- Ayanian JZ, Weissman JS. Teaching Hospitals and Quality of Care: A Review of the Literature. Milbank Quarterly. 2002;80(3):569–93. doi: 10.1111/1468-0009.00023. [DOI] [PMC free article] [PubMed] [Google Scholar]
- Barnato AE, Chang CC, Farrell MH, Lave JR, Roberts MS, Angus DC. Is Survival Better at Hospitals with Higher “End-of-Life” Treatment Intensity? Medical Care. 2010;48(2):125–32. doi: 10.1097/MLR.0b013e3181c161e4. [DOI] [PMC free article] [PubMed] [Google Scholar]
- Barnato AE, Farrell MH, Chang CH, Lave JR, Roberts MS, Angus DC. Development and Validation of Hospital “End-of-Life” Treatment Intensity Measures. Medical Care. 2009;47(10):1098–105. doi: 10.1097/MLR.0b013e3181993191. [DOI] [PMC free article] [PubMed] [Google Scholar]
- Bishop YMM, Fienberg SE, Holland PW. Discrete Multivariate Analysis: Theory and Practice. Cambridge, MA: The MIT Press; 1975. Chapter 4: Formal Goodness of Fit: Summary, Statistics, and Model Selection; pp. 131–6. [Google Scholar]
- Card D, Dobkin C, Maestas N. The Impact of Nearly Universal Insurance Coverage on Health Care Utilization: Evidence from Medicare. American Economic Review. 2008;98(5):2242–58. doi: 10.1257/aer.98.5.2242. [DOI] [PMC free article] [PubMed] [Google Scholar]
- Chandra A, Staiger DO. Productivity Spillovers in Healthcare: Evidence from the Treatment of Heart Attacks. Journal of Political Economy. 2007;115:103–40. doi: 10.1086/512249. [DOI] [PMC free article] [PubMed] [Google Scholar]
- Consumer Reports Health.org. 2008. “Too Much Treatment? Aggressive Medical Care Can Lead to More Pain with No Gain” [accessed on October 1, 2009]. Available at http://www.consumerreports.org/health/doctors-hospitals/hospital-care/aggressive-medical-care/overview/aggressive-medical-care-ov.htm.
- Deyo RA, Cherkin DC, Ciol MA. Adapting a Clinical Comorbidity Index for Use with Icd-9-Cm Administrative Databases. Journal of Clinical Epidemiology. 1992;45(6):613–9. doi: 10.1016/0895-4356(92)90133-8. [DOI] [PubMed] [Google Scholar]
- Doyle J. Health Insurance, Treatment and Outcomes: Using Auto Accidents as Health Shocks. Review of Economics and Statistics. 2005;87(2):256–70. [Google Scholar]
- Elixhauser A, Steiner C, Harris DR, Coffey RM. Comorbidity Measures for Use with Administrative Data. Medical Care. 1998;36(1):8–27. doi: 10.1097/00005650-199801000-00004. [DOI] [PubMed] [Google Scholar]
- Fisher ES, Bynum JP, Skinner JS. Slowing the Growth of Health Care Costs—Lessons from Regional Variation. New England Journal of Medicine. 2009;360(9):849–52. doi: 10.1056/NEJMp0809794. [DOI] [PMC free article] [PubMed] [Google Scholar]
- Fisher ES, Wennberg DE, Stukel TA, Gottlieb DJ, Lucas FL, Pinder EL. The Implications of Regional Variations in Medicare Spending. Part 1: The Content, Quality, and Accessibility of Care. Annals of Internal Medicine. 2003a;138(4):273–87. doi: 10.7326/0003-4819-138-4-200302180-00006. [DOI] [PubMed] [Google Scholar]
- Fisher ES. The Implications of Regional Variations in Medicare Spending. Part 2: Health Outcomes and Satisfaction with Care. Annals of Internal Medicine. 2003b;138(4):288–9. doi: 10.7326/0003-4819-138-4-200302180-00007. [DOI] [PubMed] [Google Scholar]
- Gawande A. The Cost Conundrum: What a Texas Town Can Teach Us about Health Care. The New Yorker. 2009:36–44. June 1. [Google Scholar]
- Glance LG, Dick AW, Osler TM, Mukamel DB. Does Date Stamping Icd-9-Cm Codes Increase the Value of Clinical Information in Administrative Data? Health Services Research. 2006;41(1):231–5. doi: 10.1111/j.1475-6773.2005.00419.x. [DOI] [PMC free article] [PubMed] [Google Scholar]
- Lawthers AG, McCarthy EP, Davis RB, Peterson LE, Palmer RH, Iezzoni LI. Identification of In-Hospital Complications from Claims Data. Is It Valid? Medical Care. 2000;38(8):785–9. doi: 10.1097/00005650-200008000-00003. [DOI] [PubMed] [Google Scholar]
- National Quality Forum. 2008a. “Failure to Rescue 30 Day Mortality (Risk Adjusted). Nqf # 0353” [accessed on October 1, 2009]. Available at http://www.qualityforum.org/Measures_List.aspx?keyword=Failure+to+Rescue+30-Day+Mortality+(risk+adjusted)
- National Quality Forum. 2008b. “Failure to Rescue in Hospital Mortality (Risk-Adjusted). Nqf # 0352” [accessed on October 1, 2009]. Available at http://www.qualityforum.org/Measures_List.aspx?keyword=Failure+to+Rescue+In-Hospital+Mortality+(risk+adjusted)
- Ong MK, Mangione CM, Romano PS, Zhou Q, Auerbach AD, Chun A, Davidson B, Ganiats TG, Greenfield S, Gropper MA, Malik S, Rosenthal JT, Escarce JJ. Looking Forward, Looking Back: Assessing Variations in Hospital Resource Use and Outcomes for Elderly Patients with Heart Failure. Circulation Cardiovascular Quality and Outcomes. 2009;2(6):548–57. doi: 10.1161/CIRCOUTCOMES.108.825612. [DOI] [PMC free article] [PubMed] [Google Scholar]
- Orszag P. 2009. “Address to Brookings Institute” [accessed on October 1, 2009]. Available at http://www.cspan.org/Watch/Media/2009/06/09/HP/A/19603/Sen+Max+Baucus+DMT+OMB+Dir+Peter+Orszag+on+Health+Care+Reform.aspx.
- Orszag PR, Ellis P. Addressing Rising Health Care Costs—a View from the Congressional Budget Office. New England Journal of Medicine. 2007;357(19):1885–7. doi: 10.1056/NEJMp078191. [DOI] [PubMed] [Google Scholar]
- Romano PS, Roos LL, Jollis JG. Adapting a Clinical Comorbidity Index for Use with Icd-9-Cm Administrative Data: Differing Perspectives. Journal of Clinical Epidemiology. 1993;46(10):1075–9. doi: 10.1016/0895-4356(93)90103-8. [DOI] [PubMed] [Google Scholar]
- SAS Institute Inc. 2008. “Production Glimmix Procedure” [accessed on January 28, 2008]. Available at http://support.sas.com/rnd/app/da/glimmix.html.
- SAS Institute Inc. 2009. “The Surveylogistic Procedure” [accessed on January 28, 2008]. Available at http://support.sas.com/documentation/cdl/en/statug/59654/HTML/default/surveylogistic_toc.htm.
- Silber JH, Romano PS, Rosen AK, Wang Y, Ross RN, Even-Shoshan O, Volpp K. Failure-to-Rescue: Comparing Definitions to Measure Quality of Care. Medical Care. 2007;45(10):918–25. doi: 10.1097/MLR.0b013e31812e01cc. [DOI] [PubMed] [Google Scholar]
- Silber JH, Rosenbaum PR, Romano PS, Rosen AK, Wang Y, Teng Y, Halenar MJ, Even-Shoshan O, Volpp KG. Hospital Teaching Intensity, Patient Race, and Surgical Outcomes. Archives of Surgery. 2009;144(2):113–21. doi: 10.1001/archsurg.2008.569. [DOI] [PMC free article] [PubMed] [Google Scholar]
- Silber JH, Rosenbaum PR, Ross RN. Comparing the Contributions of Groups of Predictors: Which Outcomes Vary with Hospital Rather Than Patient Characteristics? Journal of the American Statistical Association. 1995a;90(429):7–18. [Google Scholar]
- Silber JH, Rosenbaum PR, Schwartz JS, Ross RN, Williams SV. Evaluation of the Complication Rate as a Measure of Quality of Care in Coronary Artery Bypass Graft Surgery. Journal of the American Medical Association. 1995b;274(4):317–23. [PubMed] [Google Scholar]
- Silber JH, Williams SV, Krakauer H, Schwartz JS. Hospital and Patient Characteristics Associated with Death after Surgery: A Study of Adverse Occurrence and Failure to Rescue. Medical Care. 1992;30(7):615–29. doi: 10.1097/00005650-199207000-00004. [DOI] [PubMed] [Google Scholar]
- Skinner JS, Staiger DO, Fisher ES. Is Technological Change in Medicine Always Worth It? The Case of Acute Myocardial Infarction. Health Affairs. 2006;25(2):w34–47. doi: 10.1377/hlthaff.25.w34. [DOI] [PMC free article] [PubMed] [Google Scholar]
- Stukenborg GJ, Wagner DP, Connors AF. Comparison of the Performance of Two Comorbidity Measures, with and without Information from Prior Hospitalizations. Medical Care. 2001;39(7):727–39. doi: 10.1097/00005650-200107000-00009. [DOI] [PubMed] [Google Scholar]
- Taylor DH, Whellan DJ, Sloan FA. Effects of Admission to a Teaching Hospital on the Cost and Quality of Care for Medicare Beneficiaries. New England Journal of Medicine. 1999;340(4):293–9. doi: 10.1056/NEJM199901283400408. [DOI] [PubMed] [Google Scholar]
- The Center for Outcomes Research at The Children's Hospital of Philadelphia. 2009. “Outcome Measures” [accessed on October 1, 2009]. Available at http://stokes.chop.edu/programs/cor/outcomes.php.
- The Dartmouth Atlas Working Group. 2009. “The Dartmouth Atlas of Health Care” [accessed on October 1, 2009]. Available at http://www.dartmouthatlas.org/data/download.shtm.
- The White House Office of the Press Secretary. 2009. “Remarks by the President at the Annual Conference of the American Medical Association, Chicago, IL” [accessed on October 1, 2009]. Available at http://www.whitehouse.gov/the_press_office/Remarks-by-the-President-to-the-Annual-Conference-of-the-American-Medical-Association/
- Volpp KG, Rosen AK, Rosenbaum PR, Romano PS, Even-Shoshan O, Canamucio A, Bellini L, Behringer T, Lee A, Silber JH. Mortality among Patients in VA Hospitals in the First 2 Years Following Acgme Resident Duty Hour Reform. Journal of the American Medical Association. 2007a;298(9):984–92. doi: 10.1001/jama.298.9.984. [DOI] [PubMed] [Google Scholar]
- Volpp KG, Rosen AK, Rosenbaum PR, Romano PS, Even-Shoshan O, Wang Y, Bellini L, Behringer T, Lee A, Silber JH. Mortality among Hospitalized Medicare Beneficiaries in the First 2 Years Following Acgme Resident Duty Hour Reform. Journal of the American Medical Association. 2007b;298(9):975–83. doi: 10.1001/jama.298.9.975. [DOI] [PubMed] [Google Scholar]
- Volpp KG, Rosen AK, Rosenbaum PR, Romano PS, Itani KM, Bellini L, Even-Shoshan O, Cen L, Wang Y, Halenar MJ, Silber JH. Did Duty Hour Reform Lead to Better Outcomes among the Highest Risk Patients? Journal of General Internal Medicine. 2009;24(10):1149–55. doi: 10.1007/s11606-009-1011-z. [DOI] [PMC free article] [PubMed] [Google Scholar]
- Wennberg JE, Cooper MM, Birkmeyer JD, Bronner KK, Bubolz TA, Fisher EF, Gittelsohn AM, Goodman DC, Herbst KW, Mohr JE, Poage JF, Sharp SM, Skinner JS, Stukel TA. The Dartmouth Atlas of Health Care 1998. Chicago, IL: American Hospital Publishing Inc; 1998. [Google Scholar]
- Wennberg JE, Cooper MM, Bubolz TA, Fisher EF, Gittelsohn AM, Goodman DC, Mohr JE, Poage JF, Sharp SM, Skinner J, Stukel TA. 1996. “The Dartmouth Atlas of Health Care 1996. Appendix on the Geography of Health Care in the United States” [accessed on October 1, 2009]. Available at http://www.dartmouthatlas.org.
- Wennberg J, Gittelsohn A. Small Area Variations in Health Care Delivery. Science. 1973;182(4117):1102–8. doi: 10.1126/science.182.4117.1102. [DOI] [PubMed] [Google Scholar]
- Wennberg JE, Freeman JL, Culp WJ. Are Hospital Services Rationed in New Haven or Over-Utilized in Boston? Lancet. 1987;1(8543):1185–9. doi: 10.1016/s0140-6736(87)92152-0. [DOI] [PubMed] [Google Scholar]
- Yasaitis L, Fisher ES, Skinner JS, Chandra A. Hospital Quality and Intensity of Spending: Is There an Association? Health Affairs. 2009;28(4):w566–72. doi: 10.1377/hlthaff.28.4.w566. [DOI] [PMC free article] [PubMed] [Google Scholar]
Associated Data
This section collects any data citations, data availability statements, or supplementary materials included in this article.