Our study shows that, in contrast to previous research, breast mass density is significantly associated with malignancy, even after controlling for other predictive variables.
Abstract
Purpose:
To determine whether the mammographic density of noncalcified solid breast masses is associated with malignancy and to measure the agreement between prospective and retrospective assessment.
Materials and Methods:
The institutional review board approved this study and waived informed consent. Three hundred forty-eight consecutive breast masses in 328 women who underwent image-guided or surgical biopsy between October 2005 and December 2007 were included. All 348 biopsy-proved masses were randomized and assigned to a radiologist who was blinded to biopsy results for retrospective assessment by using the Breast Imaging Reporting and Data System (retrospectively assessed data set). Clinical radiologists prospectively assessed the density of 180 of these masses (prospectively assessed data set). Pathologic result at biopsy was the reference standard. Benign masses were followed for at least 1 year by linking each patient to a cancer registry. Univariate analyses were performed on the retrospectively assessed data set. The association of mass density and malignancy was examined by creating a logistic model for the prospectively assessed data set. Agreement between prospective and retrospective assessments was calculated by using the κ statistic.
Results:
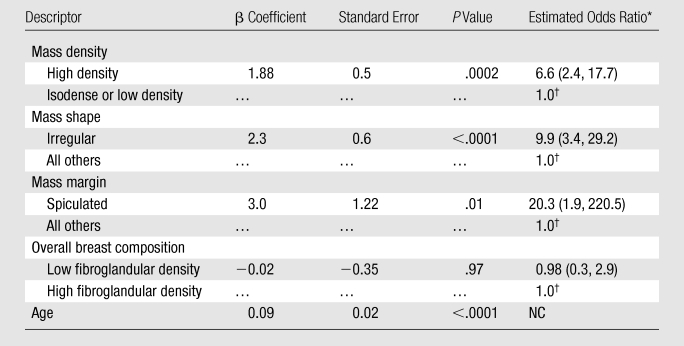
In the retrospectively assessed data set, 70.2% of high-density masses were malignant, and 22.3% of the isodense or low-density masses were malignant (P < .0001). In the prospective logistic model, high density (odds ratio, 6.6), irregular shape (odds ratio, 9.9), spiculated margin (odds ratio, 20.3), and age (β = 0.09, P < .0001) were significantly associated with the probability of malignancy. The κ value for prospective-retrospective agreement of mass density was 0.53.
Conclusion:
High mass density is significantly associated with malignancy in both retrospectively and prospectively assessed data sets, with moderate prospective-retrospective agreement. Radiologists should consider mass density as a valuable descriptor that can stratify risk.
© RSNA, 2010
Supplemental material: http://radiology.rsna.org/lookup/suppl/doi:10.1148/radiol.10100328/-/DC1
Introduction
Despite the relatively long history of mammography and recent technical advances, the positive predictive value (PPV) of biopsy for cancer ranges between 15% and 35% and is dependent on both the prevalence of cancer in the population and the age of the patient (1). Benign biopsies account for a large part of the cost of a breast screening program and may lead to substantial patient anxiety (2). One way researchers have sought to improve the performance of mammography and increase the accuracy of the decision to biopsy is through better estimation of breast cancer risk on the basis of mammographic findings (3,4).
The Breast Imaging Reporting and Data System (BI-RADS) (5) was developed in part to improve the predictive capability of mammography, and research has shown that both the final assessment categories (6–12) and the individual descriptive terms (8,13–20) can be used to accurately and reliably estimate the risk for malignancy. For example, the PPVs for carcinoma of masses with spiculated margins and those with irregular shape are 81% and 73%, respectively (8). Similarly, the risk of malignancy for circumscribed lesions categorized as probably benign (ie, BI-RADS 3) is less than 2% (18).
The predictive usefulness of the mammographic attenuation of a mass (called the mass density in the BI-RADS lexicon) remains controversial. Some investigators propose that high-density lesions are more likely to be malignant on account of the greater density of cellular components and reactive fibrosis surrounding a malignant tumor (1,21,22). However, this proposed association has not been proved in the literature and is based solely on expert opinion. To our knowledge, the only studies that examined mass density retrospectively evaluated small series of solid masses and concluded that mass density was difficult to consistently evaluate and contributed less to predicting malignancy than previously thought (23,24). Since that time, however, technical advances, including the use of digital detectors, have improved the diagnostic capability of mammography. The conclusions of those studies may no longer be valid. In addition, one of the most influential articles in establishing the predictive value of BI-RADS descriptors did not assess mass density but cited it as important future work (8). Research has indicated that high mass density may indeed improve the prediction of malignancy (25).
The purposes of our study were to determine whether the mammographic density of noncalcified solid breast masses is associated with malignancy and to measure the agreement between prospective and retrospective assessment.
Materials and Methods
The Institutional Review Board of the University of Wisconsin School of Medicine and Public Health approved the study protocol and waived informed consent. The study fully complied with the Health Insurance Portability and Accountability Act. This study analyzes a consecutive series of noncalcified breast masses that were assessed retrospectively and prospectively.
Subjects
The inclusion criterion for our study was any breast abnormality for which a percutaneous core biopsy (with ultrasonographic [US], stereotactic, or magnetic resonance [MR] imaging guidance) or a surgical biopsy was performed between October 2005 and December 2007. There were 704 image-guided percutaneous core or surgical biopsies of palpable or nonpalpable suspicious breast abnormalities that met this criterion.
Exclusion criteria were (a) biopsies performed for calcifications or a calcified mass (n = 309), (b) no diagnostic mammogram available at our institution (n = 42), and (c) male patient sex (n = 5). This left 348 eligible biopsies to be included in our study. Each biopsy was targeted to a single mass, which was defined as a space-occupying lesion seen in two different projections with convex-out borders that was denser in the center than at the periphery. There were no fat-containing masses referred for biopsy. Each mass was determined at US to be solid. Four MR imaging–guided biopsies were performed to sample the most suspicious enhancing area of a mass already identified on mammography (Table 1).
Table 1.
Patient, Biopsy, and Imaging Characteristics in the Retrospectively and Prospectively Assessed Data Sets
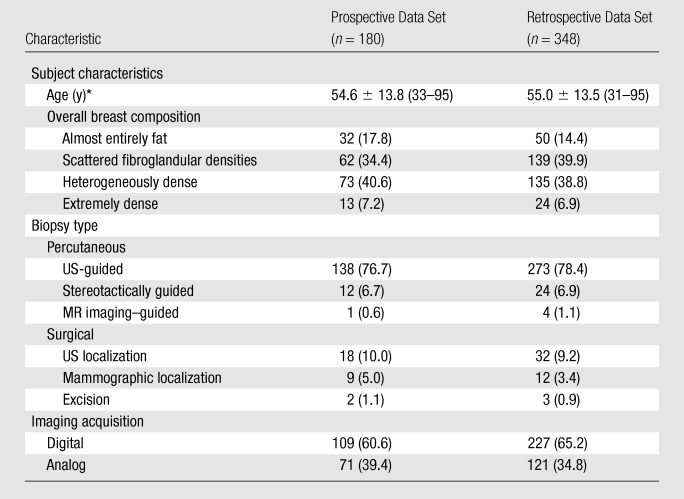
Note.—Unless otherwise specified, data are numbers of masses, with percentages in parentheses.
Data are means ± standard deviations, with ranges in parentheses.
Reference Standard
A board-certified pathologist evaluated all masses at the time of biopsy to determine the pathologic diagnosis, which was the reference standard for our study. For all cases, surgical pathology results were used when available. Pathologic diagnoses were grouped into benign and malignant categories on the basis of the specific pathologic findings. We considered invasive cancer (ductal and lobular) and ductal carcinoma in situ to be malignant. High-risk benign lesions, such as atypia or radial scars, were considered to be benign. Rigorous radiologic-pathologic correlation was performed weekly, and excision of atypia or radial scars used surgical biopsy as the basis for determining the pathologic diagnosis. In addition, any mass with a biopsy that was deemed discordant, atypical, or insufficient was recommended for excision as described by the American College of Radiology guidelines. For benign results, each subject was matched to a hospital-based cancer registry and followed for at least 12 months (mean, 24.7 months; range, 12–38 months) to establish benignity. A 12-month time frame was used for follow-up since this has been established as an adequate amount of time to minimize false-negative results in a mammography audit (5).
Imaging and Evaluation
For the purposes of our study, diagnostic mammography was defined as mammography using views tailored to the finding, including spot compression views and a true lateral projection, in concert with or following routine screening craniocaudal and mediolateral oblique views. At our institution, the recommended work-up of masses includes diagnostic mammography views before US evaluation in patients over the age of 30 years and US prior to diagnostic mammography in patients 30 years and younger.
All mammographic studies were performed with dedicated mammography equipment at a large academic dedicated breast imaging center (University of Wisconsin Breast Center, Madison, Wis). Analog mammographic examinations were performed by using Senographe DMR (GE Healthcare, Milwaukee, Wis) or M-IV (Lorad Breast Imaging, Danbury, Conn) units along with a screen-film technique (Min-R 2000; Kodak Health Imaging, Rochester, NY). Digital mammographic examinations were performed by using a Senographe 2000D unit (GE Healthcare). A technologist chose the type of equipment on the basis of room availability. All analog films in this study were digitized by using DiagnosticPRO Advantage (VIDAR Systems, Herndon, Va) with software optimized to scan images in Digital Imaging and Communications in Medicine mammography format with a 44-μm spot size selection, 12-bit imaging output, and an optical density of 0.05–4.0. An automatic digitizer calibration, a closed-loop quality assurance system, automatically prompted calibration before every film was digitized and eliminated the need for user intervention. This feature results in virtually no variation in image quality, ensures excellent gray-scale reproduction in every image, and exceeds the American College of Radiology Teleradiology Practice Guidelines. Of the 334 diagnostic mammograms obtained, 116 (34.7%) were digitized analog examinations, and 218 (65.3%) were digital examinations.
Eight radiologists (with 7–30 years experience) interpreted the mammograms as part of clinical practice during the time frame from which we collected prospective clinical data. All eight radiologists practice within the same group, and all meet the standards of the Mammography Quality Standards Act as qualified interpreting physicians. Three have fellowship training in breast imaging (G.S.S., L.R.S., E.S.B.). All mammographic images were evaluated on high-resolution picture archiving and communication system workstations. Diagnostic mammograms with comparison studies, if available, were used for evaluation of all masses.
Retrospective Evaluation
All 348 consecutive biopsy-proved noncalcified masses were randomized and assigned to one of the three fellowship-trained interpreting radiologists (G.S.S., L.R.S., E.S.B.) for retrospective assessment of the mass density. These 348 masses made up our retrospectively assessed data set. Each radiologist interpreted approximately 116 examinations and was blinded to biopsy results. Since some diagnostic mammography images showed more than one finding, the radiologist was given the mammographic mass location, including breast laterality, clock face position, and depth. The radiologist evaluated the mass density as compared with the density of an equal portion of fibroglandular tissue and recorded one of the following BI-RADS descriptors: low density, isodensity, or high density (Figs 1–3). The radiologist retrospectively measured and recorded the greatest transverse width of the mass in millimeters if imaging size had not been recorded during prospective assessment so that imaging mass size data were available for all masses.
Figure 1:
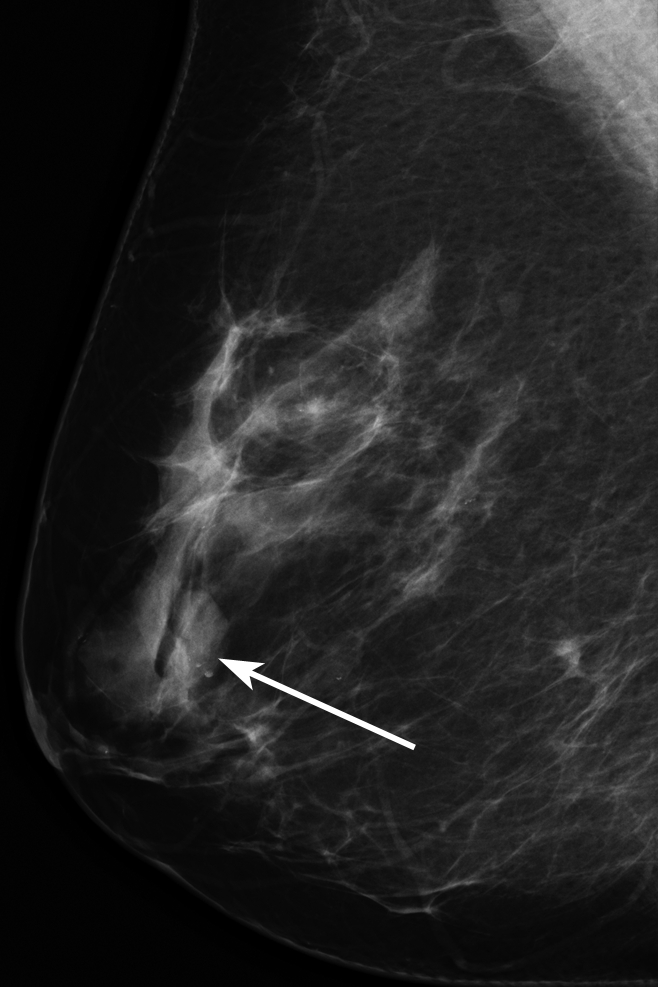
Mammographic image of a low-density mass (arrow).
Figure 3:
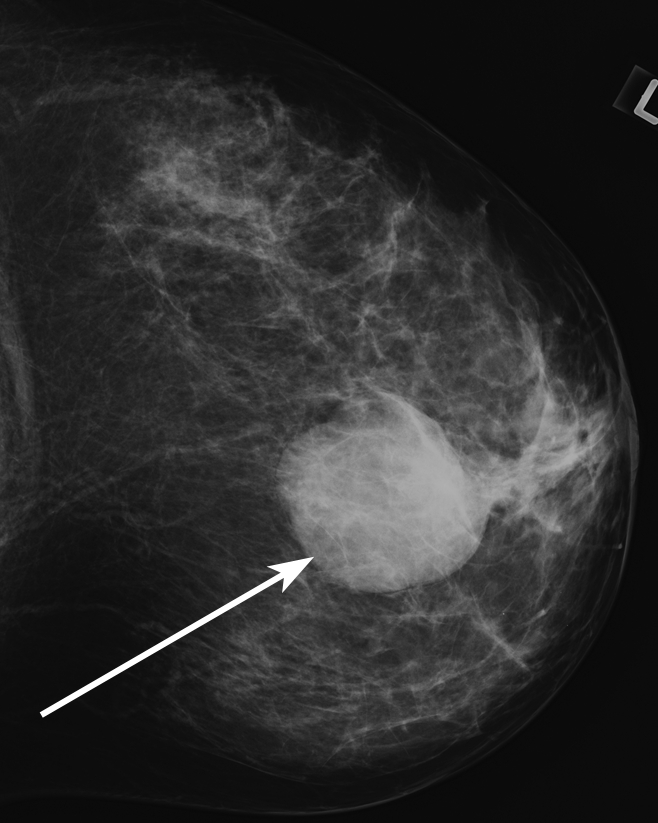
Mammographic image of a high-density mass (arrow).
Figure 2:
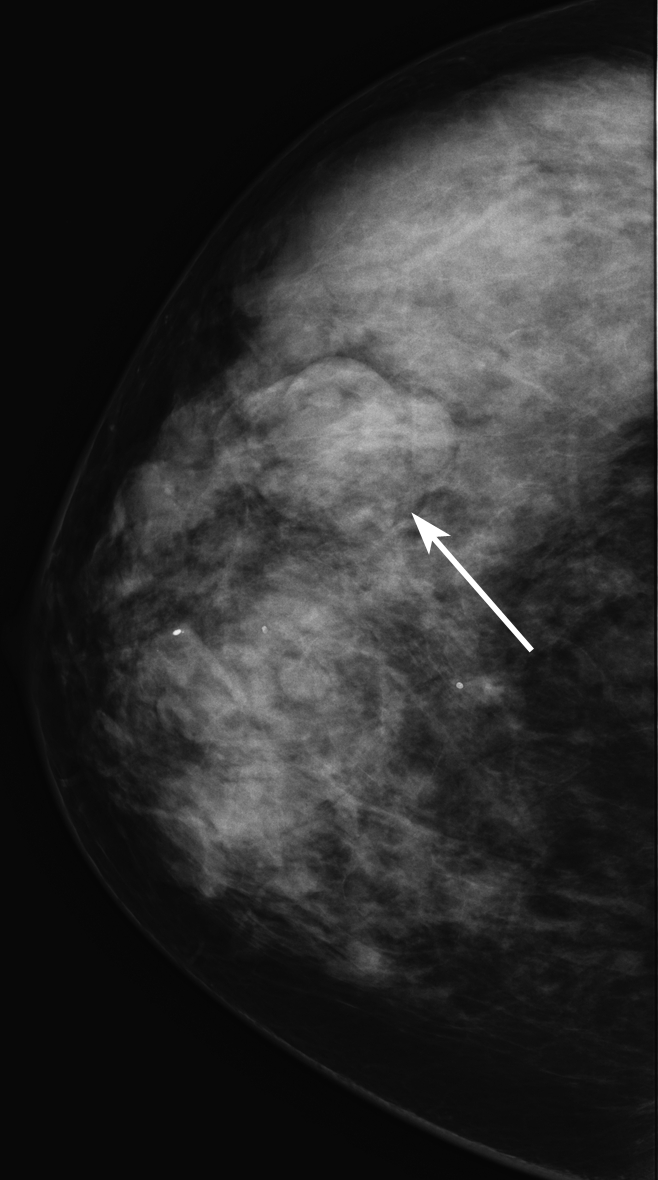
Mammographic image of an isodense mass (arrow).
Prospective Evaluation
Of the 348 consecutive biopsy-proved masses in our data set, 180 (51.7%) had been prospectively assessed for mass density at the time of initial interpretation. These 180 masses made up our prospectively assessed data set. For these masses, one of the eight interpreting clinical radiologists prospectively assessed each mass by using the fourth edition of the BI-RADS lexicon (5) for mass descriptors and mass size at their discretion as part of routine clinical practice. No formal training of the BI-RADS mass descriptors was provided to the interpreting radiologists. Thus, the criteria used by each interpreting radiologist were subjective and based on prior training and experience. Mass descriptors were directly entered into a structured reporting system (PenRad, Minnetonka, Minn) by the interpreting radiologist, and a final BI-RADS assessment category was assigned to all masses at the time of clinical interpretation. There were, therefore, 180 masses in which mass density was assessed both prospectively and retrospectively.
Statistical Analysis
We collected patient age and overall breast composition from the original radiology report, and all mass descriptors, biopsy type, and image acquisition technique were obtained by querying the structured reporting system. All statistical analyses were performed by using R statistical software (version 2.9.2, R Foundation for Statistical Computing, Vienna, Austria; available at http://www.R-project.org/) and the lme4 library (available at http://lme4.r-forge.r-project.org/). We combined low density and isodense masses for all analyses because fewer than 10% of masses (32 of 348) were characterized as low density at retrospective assessment. Among the masses in which more than one descriptor was used to describe the margin (n = 11), the most worrisome descriptor (in order of severity: spiculated, indistinct, obscured, microlobulated, circumscribed) was used in our analysis because radiologists use the most worrisome to make clinical management decisions (8). Only a single descriptor was used to describe mass shape and mass density for all masses. A P value of less than or equal to .05 was considered to indicate a significant difference for all analyses.
Descriptive statistics were calculated for subject age, overall breast composition, biopsy type, image acquisition technique, mass palpability, and pathologic outcome. A χ2 test for clustered data was performed on the above variables to evaluate any significant differences between the retrospectively and prospectively assessed data sets. The frequency for which mass descriptors were reported prospectively among the 348 masses was calculated.
Retrospectively assessed data set.—We evaluated the association between the predictor variables (ie, mass density, mass size, overall breast composition, image acquisition technique, and subject age) and the response variable (ie, malignancy) by using separate logistic linear mixed-effects models in the retrospectively assessed data set. The logistic linear mixed-effects model allowed us to account for multiple masses on a single mammogram and within the same patient. We calculated P values and odds ratios with 95% confidence intervals for each variable. The logistic linear mixed-effects model used to determine the P value and odds ratio for mass density included overall breast composition; therefore, the results shown are controlled for overall breast composition. A χ2 test was used to evaluate the association between image acquisition technique and malignancy among high-density masses.
Prospectively assessed data set.—To evaluate the relative contribution of breast mass density to the probability of malignancy, we created a logistic linear mixed-effects model with benign or malignant outcome as the dependent variable. We used a backward stepwise variable selection method and chose the best-fitting model on the basis of the lowest Akaike Information Criterion. This type of model was used to address clinically important predictors and remove those from the model that did not improve prediction accuracy. Overall breast composition was forced into the model regardless of its Akaike Information Criterion when assessing the association between mass density and malignancy to account for the association between overall breast composition, mass density, and malignancy.
For the model, we transformed the mass size variable to the log scale to obtain constant variance and collapsed multilevel categorical variables (ie, overall breast composition, mass shape, and mass margin) into dichotomous variables to address issues of multicollinearity. Overall breast composition was collapsed to low fibroglandular density (ie, almost entirely fat and scattered fibroglandular densities) and high fibroglandular density (ie, heterogeneously dense and extremely dense). For shape, masses designated as irregular were compared with those with all other shape descriptors. For margins, masses described as spiculated were compared with those with all other margin descriptors.
The logistic model was constructed from the prospectively assessed data set only and estimated the relative contribution of breast mass density to the probability of malignancy while controlling for the independent variables of subject age, mass size, mass margin, mass shape, overall breast composition, image acquisition technique, and interpreting radiologist. We created this model to evaluate the relative contribution of breast mass density in a consecutive prospectively assessed data set with all clinically important mass descriptors, as this data set most accurately reflects routine clinical practice.
Accuracy and prospective-retrospective agreement.—We calculated the sensitivity, specificity, PPV, and negative predictive value of mass density with high density considered to be positive result and biopsy outcome (benign or malignant) as the reference standard in the retrospectively assessed data set. We measured prospective-retrospective agreement by comparing prospectively and retrospectively assessed mass density by using the κ statistic and the categories established by Landis and Koch (26) for the 180 masses with both prospective and retrospective mass density assessment.
Results
Population Characteristics
There were 348 total biopsied masses in our study. These masses were visualized on 334 diagnostic mammograms in 328 patients. There were 309 patients with solitary masses, 18 patients with two masses, and one patient with three masses.
Descriptive statistics for subject age, overall breast composition, biopsy type, and image acquisition technique for the prospectively (n = 180) and retrospectively (n = 348) assessed data sets are summarized in Table 1. There were no significant differences between the prospective and retrospective data sets. Among the 348 total masses, diagnostic mammography was performed for a palpable abnormality for 88 (25.3%) masses.
Among the 348 masses in the retrospectively assessed data set, there were 230 (66.1%) benign masses and 118 (33.9%) malignant masses. Among the 90 invasive ductal carcinomas, 77 were of the subtype not otherwise specified. The subtypes for the remaining 13 invasive ductal carcinomas were as follows: five tubular, four mucinous, three intracystic papillary, and one medullary (Table E1 [online]).
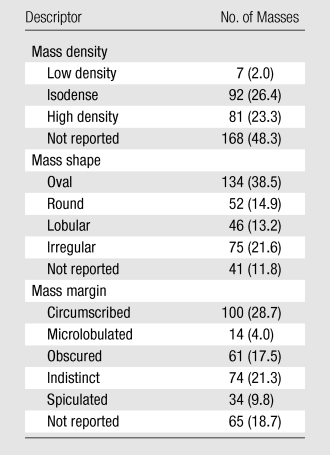
In the 348 masses studied, mass density was prospectively described in 52% (Table 2). Mass shape was assessed in 88%; and mass margin, in 81%.
Table 2.
Frequency of Breast Mass Descriptors in the Prospective Data Set
Note.—Data in parentheses are percentages.
Retrospectively Assessed Data Set
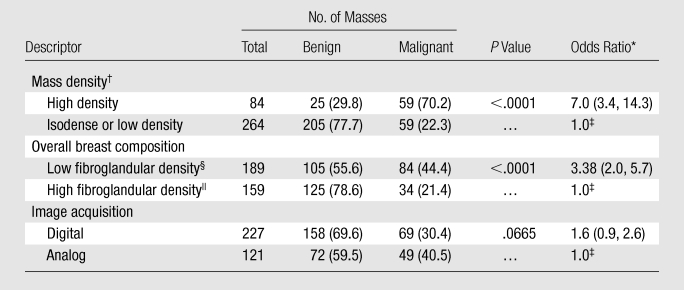
Among the 348 retrospectively assessed masses, there were zero that contained fat, 264 (75.9%) that were isodense or low density, and 84 (24.1%) that were high density. Among the categorical variables (Table 3), there were significant differences in mass density (P < .0001) and overall breast composition (P < .0001) between benign and malignant masses. There were no significant differences in the proportion of malignant cases between analog and digital acquisition techniques among the entire data set of masses, or among the 84 high-density masses alone (P > .99). Subject age (P < .0001) and mass size (P = .005) were also significant predictors of malignancy (Table 4).
Table 3.
Univariate Analysis of Categorical Variables in the Retrospective Data Set
Note.—Unless otherwise specified, data are numbers of masses, with percentages in parentheses.
Data in parentheses are 95% confidence intervals.
The logistic linear effects model used to determine the P value and odds ratio for mass density included overall breast composition; therefore, the results shown are controlled for overall breast composition.
Reference level in the odds ratio calculation.
Almost entirely fat or scattered fibroglandular densities.
Heterogeneously dense or extremely dense.
Table 4.
Univariate Analysis of Continuous Variables in the Retrospective Data Set

Note.—Unless otherwise specified, data are means ± standard deviations, with ranges in parentheses.
Prospectively Assessed Data Set
Among the 180 prospectively assessed masses, there were zero that contained fat, 99 (55.0%) that were isodense or low density, and 81 (45.0%) that were high density. In the logistic regression model (Table 5), the independent descriptors high mass density (odds ratio, 6.6), irregular mass shape (odds ratio, 9.9), spiculated mass margin (odds ratio, 20.3), and patient age (β = 0.09, P < .0001) significantly predicted the probability of malignancy. Mass size and image acquisition technique did not significantly improve prediction accuracy and were removed from the model.
Table 5.
Logistic Regression Analysis of Prospectively Assessed Mass Descriptors
Note.—NC = odds ratios could not be calculated for continuous variables.
Data in parentheses are 95% confidence intervals.
Reference level in the odds ratio calculation.
Accuracy and Prospective-Retrospective Agreement
In the retrospectively assessed data set, the sensitivity of high breast mass density was 50.0% (59 of 118), and the specificity was 89.1% (205 of 230). The PPV was 70.2% (59 of 84), and the negative predictive value was 77.7% (205 of 264). The κ value for agreement between prospectively and retrospectively assessed mass density was 0.53 (95% confidence interval: 0.4, 0.65), reflecting moderate agreement, as defined by Landis and Koch (26).
Discussion
Our results show that high mass density is significantly associated with malignancy among masses assessed retrospectively and prospectively. By assessing masses retrospectively and prospectively, we can confidently conclude that mass density is a significant predictor of malignancy.
In our data set of retrospectively assessed masses, we have shown the predictive capability of this descriptor in a series of consecutive biopsy-proved cases, unbiased by those masses in which mass density was not prospectively reported. We found that mass density, mass size, overall breast composition, and patient age were all independent significant predictors of malignancy. We did encounter some surprising results in this analysis: Subjects with low-fibroglandular-density breasts had a greater likelihood of malignancy as compared with subjects with high-fibroglandular-density breasts. This result, which is in contrast to evidence in the literature, is probably owing to greater sensitivity in detecting malignant masses in breasts that have less fibroglandular density. This result may also be explained by the increased age of subjects with malignant masses in our study, who likely had breast that were less dense than those in patients with benign masses.
Such an analysis of retrospectively assessed masses, however, does not accurately reflect the assessment of mass density in the context of the pressures of clinical practice. Our prospectively assessed data set is complimentary to the retrospective data set since it reflects actual routine clinical practice. Among our data set of prospectively assessed masses, our logistic regression model showed that high mass density is significantly associated with malignancy, even after controlling for potential confounders, including mass shape, mass margin, overall breast composition, and subject age.
In addition, we observed that while high breast mass density was only moderately sensitive for detection of cancer by itself, the specificity of this measure was reasonably high. We determined that agreement was moderate between retrospective and prospective assessment of breast mass density. Interestingly, we also found that high mass density was more often observed in the prospectively assessed data set (45.0% vs 24.1%, χ2 = 23.1, P < .0001) as compared with the retrospectively assessed data set. This may reflect an inclination toward using this descriptor more frequently in the midst of the pressures of clinical practice; however, further data would be helpful to validate this hypothesis.
In the past, the two studies (23,24) that analyzed mass density as a predictor of malignancy concluded that, although the majority of high-density masses are malignant, the presence of low-density cancers and other indicators of malignancy make mass density a less reliable descriptor. Our study is different from these previous studies in several important ways. First, our study of retrospectively and prospectively assessed masses provides a complete analysis of consecutive biopsy-proved cases, represents clinical practice, and allows for prospective-retrospective agreement analysis. Second, we used a logistic regression model to analyze our results, which considered a large range of potentially confounding factors of the relationship between mass density and malignancy. Our logistic regression model showed the relative importance of mass density as an associate of malignancy even when we controled for other variables, such as margin, shape, overall breast composition, and subject age. The magnitude of the estimated odds ratio for each parameter suggests that mass margin and mass shape are the most important indicators, followed by mass density. Finally, over the 20 years that have elapsed since these previous studies, many technical developments have improved mammographic image quality. Although our study did not find any significant effect of digital versus analog mammography, overall improvements in image quality may have increased the accuracy of mass density as an indicator of malignancy in general.
The ability of mass density to be used to help stratify the risk of malignancy has important clinical implications. Identifying additional important descriptors could help radiologists improve the PPV of biopsy. In our study, the PPV of high mass density was just over 70%. Although a PPV in this range does not suggest that mass density has sufficient accuracy to avert a biopsy, when used in combination with mass margin and shape, risk stratification may be accurate enough to improve the PPV of biopsy. A possible line of future research includes determining the imaging characteristics of a mass that make it safe to forego biopsy.
Despite these important clinical implications, we found that the consistent measurement of mass density is challenging and that prospective-retrospective agreement in mass density measurement is moderate, which is similar to previous research (3,7,24,27). There are several possible reasons for the inconsistency of evaluation. First, optical density cannot be directly measured with conventional two-view imaging owing to superimposed structures. Digital breast tomosynthesis or breast computed tomography would allow direct measurement of the attenuation, but these are not in routine clinical use at this time. Second, mass density evaluation can be difficult when the breast is predominantly fatty and there is little fibroglandular tissue to compare with or the only available surrounding fibroglandular tissue can only be seen through the mass. Third, large masses force the radiologist to make a comparison on the basis of unequal volumes of breast tissue and mass. Finally, the majority of masses are isodense, meaning that low- and high-density masses are seen relatively infrequently.
The prospective-retrospective agreement in our study was similar to that for mass shape and margin reported previously in the literature (7), suggesting that the challenges in consistently evaluating mass density do not eliminate the value of mass density as an indicator of malignancy. In the future, image processing of digital studies to more accurately quantify density could improve radiologists’ evaluation of mass density. The evaluation of mass density may also be improved with more consistent use of the mass density descriptor. Among our data set of 348 masses, mass density was prospectively used just over 50% of the time, whereas mass margin and shape descriptors were prospectively used approximately 85% of the time. Perhaps radiologists do not routinely assess mass density because they do not understand its value on the basis of prior literature. With more consistent use of the descriptor, interobserver variability may improve.
There were limitations to our study. First, the number of masses in our prospectively assessed data set was relatively small because interpreting radiologists often did not report the mass density descriptor. It would be interesting to test the predictive capability of mass density in a larger population of masses that are more consistently described. Second, our study evaluated only masses identified on diagnostic mammography, which may limit the generalizability of our results to the larger screening population, in which the prevalence of malignancy is much lower. Although our logistic model was relatively robust, the model suffered from issues of multicollinearity, making estimates of the relative contribution of each level of a mass descriptor impossible. By using a larger amount of data, we may be able to determine how the mass density descriptor should be used in the context of mass margin and shape. Third, we followed benign masses for 1 year, which may limit our ability to detect false-negative results. Fourth, we assessed the variability between prospective and retrospective assessments of mass density. Since our three readers who performed retrospective assessments participated in the initial interpretation of studies, this variability measurement is a combination of inter- and intraobserver variability. When creating these data sets, we did not code for initial interpreting radiologist, and since identifying information was removed from the records, we were unable to obtain these data later. Finally, although our digitized images passed all applicable quality control tests and were of such quality that they would pass the facility’s accreditation body’s phantom and clinical image review process, there may be small mass attenuation differences owing to the analog versus digital image processing techniques. Although not substantial in our analysis, small differences may have influenced the results.
In conclusion, our study shows that, in contrast to previous research, breast mass density is significantly associated with malignancy, even after controlling for other predictive variables. Future research should focus on ways to improve the objective measurement of mass density. We believe that, when evaluating breast masses for biopsy, radiologists should consider the density of a mass as a valuable descriptor that can help stratify risk.
Advance in Knowledge.
High breast mass density is significantly associated with malignancy, even after controlling for other well-known predictors of malignancy, such as mass margin, mass shape, age, and breast composition.
Implication for Patient Care.
Identifying additional associates of malignancy, such as breast mass density, may help to stratify the risk of malignancy and aid the radiologist in making that decision to obtain a biopsy.
Disclosures of Potential Conflicts of Interest: R.W.W. Financial activities related to the present article: institution received funding from National Institutes of Health grants K07-CA114181 and R01-CA127379. Financial activities not related to the present article: none to disclose. Other relationships: none to disclose. G.S.S. No potential conflicts of interest to disclose. L.R.S. No potential conflicts of interest to disclose. K.S. No potential conflicts of interest to disclose. Y.L. No potential conflicts of interest to disclose. E.S.B. Financial activities related to the present article: institution received funding from National Institutes of Health. Financial activities not related to the present article: none to disclose. Other relationships: none to disclose.
Supplementary Material
Received February 10, 2010; revision requested March 11; revision received July 29; accepted August 13; final version accepted September 20.
Current address: Department of Radiology, Johns Hopkins Hospital, Baltimore, Md.
Funding: This research was supported by the National Institutes of Health (grants K07-CA114181 and R01-CA127379).
Abbreviations:
- BI-RADS
- Breast Imaging Reporting and Data System
- PPV
- positive predictive value
References
- 1.Kopans D. Breast imaging. 3rd ed. Philadelphia, Pa: Lippincott-Raven, 2007 [Google Scholar]
- 2.Poplack SP, Carney PA, Weiss JE, Titus-Ernstoff L, Goodrich ME, Tosteson AN. Screening mammography: costs and use of screening-related services. Radiology 2005;234(1):79–85 [DOI] [PubMed] [Google Scholar]
- 3.Baker JA, Kornguth PJ, Floyd CE., Jr Breast Imaging Reporting and Data System standardized mammography lexicon: observer variability in lesion description. AJR Am J Roentgenol 1996;166(4):773–778 [DOI] [PubMed] [Google Scholar]
- 4.D’Orsi CJ. The American College of Radiology mammography lexicon: an initial attempt to standardize terminology. AJR Am J Roentgenol 1996;166(4):779–780 [DOI] [PubMed] [Google Scholar]
- 5.American College of Radiology Breast Imaging Reporting and Data System (BI-RADS). 4th ed. Reston, Va: American College of Radiology, 2003 [Google Scholar]
- 6.Lacquement MA, Mitchell D, Hollingsworth AB. Positive predictive value of the Breast Imaging Reporting and Data System. J Am Coll Surg 1999;189(1):34–40 [DOI] [PubMed] [Google Scholar]
- 7.Lazarus E, Mainiero MB, Schepps B, Koelliker SL, Livingston LS. BI-RADS lexicon for US and mammography: interobserver variability and positive predictive value. Radiology 2006;239(2):385–391 [DOI] [PubMed] [Google Scholar]
- 8.Liberman L, Abramson AF, Squires FB, Glassman JR, Morris EA, Dershaw DD. The Breast Imaging Reporting and Data System: positive predictive value of mammographic features and final assessment categories. AJR Am J Roentgenol 1998;171(1):35–40 [DOI] [PubMed] [Google Scholar]
- 9.Orel SG, Kay N, Reynolds C, Sullivan DC. BI-RADS categorization as a predictor of malignancy. Radiology 1999;211(3):845–850 [DOI] [PubMed] [Google Scholar]
- 10.Taplin SH, Ichikawa LE, Kerlikowske K, et al. Concordance of Breast Imaging Reporting and Data System assessments and management recommendations in screening mammography. Radiology 2002;222(2):529–535 [DOI] [PubMed] [Google Scholar]
- 11.Varas X, Leborgne JH, Leborgne F, Mezzera J, Jaumandreu S, Leborgne F. Revisiting the mammographic follow-up of BI-RADS category 3 lesions. AJR Am J Roentgenol 2002;179(3):691–695 [DOI] [PubMed] [Google Scholar]
- 12.Zonderland HM, Pope TL, Jr, Nieborg AJ. The positive predictive value of the Breast Imaging Reporting and Data System (BI-RADS) as a method of quality assessment in breast imaging in a hospital population. Eur Radiol 2004;14(10):1743–1750 [DOI] [PubMed] [Google Scholar]
- 13.Baker JA, Kornguth PJ, Lo JY, Williford ME, Floyd CE., Jr Breast cancer: prediction with artificial neural network based on BI-RADS standardized lexicon. Radiology 1995;196(3):817–822 [DOI] [PubMed] [Google Scholar]
- 14.Ciatto S, Cataliotti L, Distante V. Nonpalpable lesions detected with mammography: review of 512 consecutive cases. Radiology 1987;165(1):99–102 [DOI] [PubMed] [Google Scholar]
- 15.Hall FM, Storella JM, Silverstone DZ, Wyshak G. Nonpalpable breast lesions: recommendations for biopsy based on suspicion of carcinoma at mammography. Radiology 1988;167(2):353–358 [DOI] [PubMed] [Google Scholar]
- 16.Helvie MA, Pennes DR, Rebner M, Adler DD. Mammographic follow-up of low-suspicion lesions: compliance rate and diagnostic yield. Radiology 1991;178(1):155–158 [DOI] [PubMed] [Google Scholar]
- 17.Lehman CD, Rutter CM, Eby PR, White E, Buist DS, Taplin SH. Lesion and patient characteristics associated with malignancy after a probably benign finding on community practice mammography. AJR Am J Roentgenol 2008;190(2):511–515 [DOI] [PubMed] [Google Scholar]
- 18.Sickles EA. Nonpalpable, circumscribed, noncalcified solid breast masses: likelihood of malignancy based on lesion size and age of patient. Radiology 1994;192(2):439–442 [DOI] [PubMed] [Google Scholar]
- 19.Varas X, Leborgne F, Leborgne JH. Nonpalpable, probably benign lesions: role of follow-up mammography. Radiology 1992;184(2):409–414 [DOI] [PubMed] [Google Scholar]
- 20.Vizcaíno I, Gadea L, Andreo L, et al. Short-term follow-up results in 795 nonpalpable probably benign lesions detected at screening mammography. Radiology 2001;219(2):475–483 [DOI] [PubMed] [Google Scholar]
- 21.Egan RL. Breast imaging: diagnosis and morphology of breast diseases. Philadelphia, Pa: Saunders, 1988 [Google Scholar]
- 22.Homer MJ. Mammographic interpretation: a practical approach. 2nd ed. New York, NY: McGraw-Hill, Health Professions Division, 1997 [Google Scholar]
- 23.Cory RC, Linden SS. The mammographic density of breast cancer. AJR Am J Roentgenol 1993;160(2):418–419 [DOI] [PubMed] [Google Scholar]
- 24.Jackson VP, Dines KA, Bassett LW, Gold RH, Reynolds HE. Diagnostic importance of the radiographic density of noncalcified breast masses: analysis of 91 lesions. AJR Am J Roentgenol 1991;157(1):25–28 [DOI] [PubMed] [Google Scholar]
- 25.Burnside ES, Davis J, Costa VS, et al. Knowledge discovery from structured mammography reports using inductive logic programming. AMIA Annu Symp Proc 2005:96–100 [PMC free article] [PubMed] [Google Scholar]
- 26.Landis JR, Koch GG. The measurement of observer agreement for categorical data. Biometrics 1977;33(1):159–174 [PubMed] [Google Scholar]
- 27.Berg WA, Campassi C, Langenberg P, Sexton MJ. Breast Imaging Reporting and Data System: inter- and intraobserver variability in feature analysis and final assessment. AJR Am J Roentgenol 2000;174(6):1769–1777 [DOI] [PubMed] [Google Scholar]
Associated Data
This section collects any data citations, data availability statements, or supplementary materials included in this article.


