Abstract
Apoptosis contributes to the development of diabetic nephropathy, but the mechanism by which high glucose (HG) induces apoptosis is not fully understood. Because the tuberin/mTOR pathway can modulate apoptosis, we studied the role of this pathway in apoptosis in type I diabetes and in cultured proximal tubular epithelial (PTE) cells exposed to HG. Compared with control rats, diabetic rats had more apoptotic cells in the kidney cortex. Induction of diabetes also increased phosphorylation of tuberin in association with mTOR activation (measured by p70S6K phosphorylation), inactivation of Bcl-2, increased cytosolic cytochrome c expression, activation of caspase 3, and cleavage of PARP; insulin treatment prevented these changes. In vitro, exposure of PTE cells to HG increased phosphorylation of tuberin and p70S6K, phosphorylation of Bcl-2, expression of cytosolic cytochrome c, and caspase 3 activity. High glucose induced translocation of the caspase substrate YY1 from the cytoplasm to the nucleus and enhanced cleavage of PARP. Pretreatment the cells with the mTOR inhibitor rapamycin reduced the number of apoptotic cells induced by HG and the downstream effects of mTOR activation noted above. Furthermore, gene silencing of tuberin with siRNA decreased cleavage of PARP. These data show that the tuberin/mTOR pathway promotes apoptosis of tubular epithelial cells in diabetes, mediated in part by cleavage of PARP by YY1.
Apoptosis of tubular epithelial cells is a major feature of diabetic kidney disease, and hyperglycemia triggers the generation of free radicals and oxidant stress in tubular cells.1–3 Hyperglycemia and high glucose in vitro also lead to apoptosis, a form of programmed cell death characterized by cell shrinkage, chromatin condensation, and DNA fragmentation in variety of cell types including proximal tubular epithelial cells.2,3 Prolonged exposure of proximal tubular epithelial cells to high glucose inhibits cell proliferation and induces growth arrest or cellular apoptosis.2–5
High glucose activates signaling pathways that include the phosphotidylinostiol 3 kinase (PI3 kinase) and protein kinase B (Akt).6 Moreover, high glucose phosphorylates tuberin at Thr 1462 in mouse renal proximal tubular epithelial cells and in cortical kidney tissue of type I diabetic rats.6 Tuberin, a product of the tumor suppressor gene TSC-2, exists in an active state to inhibit the mammalian target of rapamycin (mTOR) signaling pathway.7–10 Tuberin expression increases the susceptibility of renal cells to apoptosis induced by the tumor promoter okadaic acid.11 In addition, tuberin triggers apoptosis accompanied by phosphorylation of Bad on Ser136 and increases the association of BAD/Bcl2 and BAD/Bcl-XL.12
mTOR phosphorylates and activates p70S6K (p70 ribosomal protein S6 kinase) on Thr 389.13 mTOR is also involved in the phosphorylation/inactivation of Bcl-2 in microtubules treated with apoptotic agents.14 Bcl-2–related proteins comprise a family of positive and negative regulators of apoptosis. Phosphorylation of Bcl-2 inactivates its anti-apoptotic effect and triggers the release of cytochrome c from the mitochondria, leading to the activation of downstream caspases.15,16 Caspase 3 is the protease that does most of the DNA repair enzyme, poly (ADP-ribose) polymerase (PARP), cleaving during apoptosis.17–19 The sequence at which caspases, granzyme A, or calpain cleave PARP is very well conserved in the PARP protein in many distinct species, indicating the potential importance of PARP cleavage in apoptosis. Diabetes or high glucose cleaves PARP in the thoracic aorta of adult male BALB/c mice,20 bovine aortic endothelial cells,21 and mesangial cells in the renal glomerulus.22 Ying Yang 1 (YY1) is known to be a substrate of caspases, the intracellular executioners of apoptosis.23
The mechanism by which high glucose induces apoptosis is not fully understood. In this study, we investigated the potential role of the tuberin/mTOR pathway in activating an apoptotic signal cascade in a rat model of type I diabetes and in proximal tubular epithelial cells.
RESULTS
At 4 weeks after streptozotocin (STZ) injection, blood glucose levels, kidney weight, kidney/body weight, and protein urea were significantly increased in the diabetic group, whereas insulin treatment of diabetic animals normalized these parameters (Table 1). Body weight was significantly decreased in the diabetic group and normalized to control levels in animals treated with insulin.
Table 1.
Physical and metabolic parameters in control and diabetic rats
| Control | Diabetes | Diabetes + Insulin | |
|---|---|---|---|
| Blood glucose (mg/dl) | 108 ± 5.9 | 426.8 ± 49.3a | 83 ± 30.4 |
| Body weight (g) | 391.7 ± 22.7 | 284.0 ± 9.6a | 391.3 ± 11 |
| Kidney weight (g) | 2.51 ± 0.17 | 3.33 ± 0.25b | 2.97 ± 0.13 |
| Kidney/body weight (mg/g) | 6.5 ± 0.39 | 11.6 ± 0.68a | 7.6 ± 0.48 |
| Proteinurea (mg protein/24 h urine) | 7.5 ± 2.55 | 49.2 ± 14.4b | 8.3 ± 0.5 |
Values are means ± SEM: n = 4.
aP < 0.01 and bP < 0.05 versus control by ANOVA.
Diabetes Is Associated with Increased Number of Apoptotic Cells
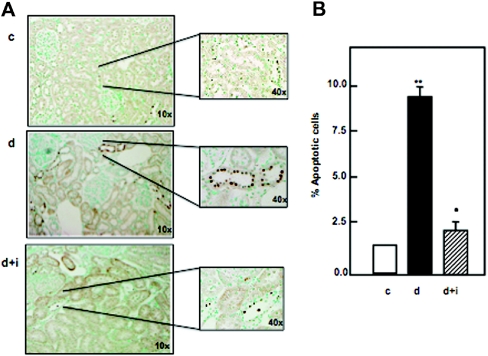
Diabetes induced an increase in terminal deoxynucleotidyl transferase (TdT)–mediated dUTP nick-end labeling (TUNEL)-positive tubular cells in the kidney section of diabetic rats, and insulin (four to five units daily; Novolin) reversed these changes (Figure 1A). The percentage of TUNEL-positive tubular cells stained in the kidney sections was higher in diabetic rats compared with the control rats, whereas insulin treatment of the diabetic rats decreased the number of the apoptotic cells but not to control levels (Figure 1B).
Figure 1.
Diabetes is associated with increased apoptosis in kidney cortex of rats, and insulin treatment significantly decreases these changes. (A) Kidney sections of control, diabetes, and diabetes+insulin of rats were stained by TUNEL. There is an increase in TUNEL-positive cells to five- to sixfold in diabetic rats compared with control rats. Insulin treatment of diabetic rats (see Results) significantly decreases the apoptosis. (B) Percentage of total number of TUNEL-positive cells counted in kidney sections of control, diabetes, and diabetes+insulin of rats. Significant difference from control animals is indicated by **P < 0.01 and *P < 0.05.
Hyperglycemia Enhances Tuberin Phosphorylation and Activation of the mTOR Pathway to Increase Apoptosis
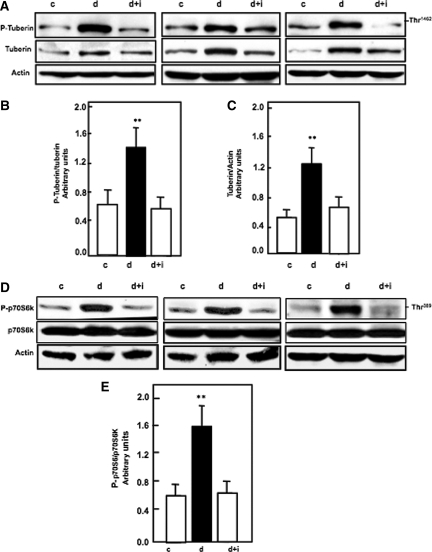
To study the effect of diabetes on the upstream signal of mTOR, the Akt-dependent phosphorylation site on tuberin, Thr1462, was examined in kidney cortex by Western blot analysis. Tuberin phosphorylation and p-tuberin/total tuberin levels were increased in diabetic rats compared with control rats, whereas insulin treatment reversed these changes to control levels (Figure 2, A and B). Total tuberin was increased in diabetic rats compared with control rats, and insulin treatment reversed these changes to control levels (Figure 2C).
Figure 2.
Diabetes increases the phosphorylation of tuberin and activates the mTOR pathway, and insulin treatment reverses it to control levels. (A) Representative immunoblot shows that diabetes (d) enhances the phosphorylation of tuberin at Thr1462 in kidney cortex of rats. Treatment of the diabetic rats with insulin (d+i) reversed the changes to control (c) levels. Actin was used as a loading control. (B) Histograms in the bottom panel show increased phospho tuberin/tuberin expression in diabetic animals and (C) increased total tuberin/actin expression in diabetic animals. (D) Increase in phosphorylation tuberin (P-Tuberin) is associated with increased activation of the mTOR pathway by phosphorylation S70S6K (P-S70S6K) at Thr389 in kidney cortex in diabetic rats compared with control rats. Insulin treatment (d+i) reversed these changes to control levels. Actin was used as a loading control. (E) Histogram shows levels of phospho-p70S6K/total p-70S6K. Histograms represent means ± SE of four animals. Significant difference from control animals is indicated by **P < 0.01. Western blot was repeated two times for each animal.
To study the role of diabetes in downstream target of mTOR, p70S6K on Thr389 was examined by Western blot and immunostaining analysis. Phosphorylation of tuberin leads to activation of mTOR through increase expression of phospho-p70S6K at Thr389 in diabetic rats compared with control rats, whereas insulin treatment reversed these changes to control levels (Figure 2, D and E).
Diabetes Activates Apoptosis Cascade Signals
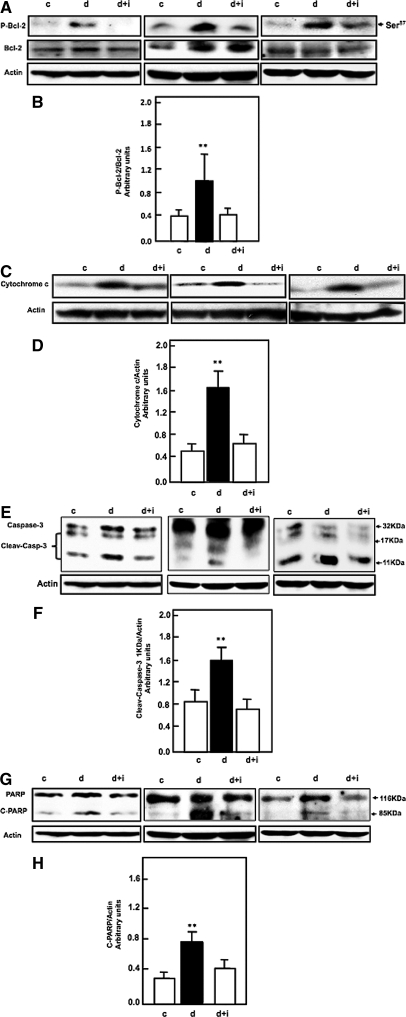
To elucidate the involvement of tuberin/S6K cascade signals in the activation of the apoptotic pathway in diabetes, we first examined the effect of diabetes on phosphorylation of Bcl-2. Phosphorylation of Bcl-2 at Ser87 and expression of cytochrome c in the kidney cortex of control, diabetes, and diabetes+insulin rats was measured by Western blot. Data in Figure 3, A and B, show that diabetes enhances the phosphorylation/inactivation of Bcl-2 at Ser87 that results in its inactivation and increased cytosolic cytochrome c expression in diabetic rats (Figure 3, C and D) compared with control rats. Treatment of the diabetic rats with insulin reverses these changes to control levels (Figure 3, A–D). Caspase 3 has been shown to be primarily responsible for the cleavage of Poly (ADP-Ribose) polymerase (PARP) during cell death. Diabetes activates and cleaves caspase 3 at 17 and 11 kD, which when cleaved/activated plays a central role in the execution of the cell death program. We assessed the activity of caspase 3 in the kidney cortex of control, diabetes, and diabetes+insulin rats by Western blot analysis. Diabetes enhances activation/cleavage of caspase 3.
Figure 3.
Diabetes is associated with increased apoptosis cascade signals, and insulin treatment restores these changes to the control levels. (A and B) Diabetes enhanced phosphorylation of Bcl-2 at Ser87 (C and D), increased in cytosolic cytochrome c expression (E and F), increased cleavage of caspase-3 at 11 kD, and (G and H) increased cleavage of PARP at 85 kD, and insulin treatment reversed theses changes to control levels in rats. Actin was used as a loading control. Histogram shows representative means ± SE of four animals. Significant difference from control animals is indicated by **P < 0.01. Western blot was repeated two times for each animal.
PARP cleaves by caspases, granzyme A, or calpain and that leads to apoptosis. The cleaving of PARP at 116 and 85 kD was increased in diabetic rats. Treatment of diabetic rats with insulin reverses the apoptosis cascade signals to control levels (Figure 3, A–H), suggesting that diabetes activates the apoptosis cascade signals through tuberin/p70S6K/Bcl2 phosphorylation, which releases cytochrome c to activate/cleave caspases and PARP. Collectively, these data suggest that tuberin/p70S6K/Bcl2 phosphorylation plays an important role in the activation of cell death cascade signals in diabetes.
High Glucose Increases Cell Death in Proximal Tubular Cells
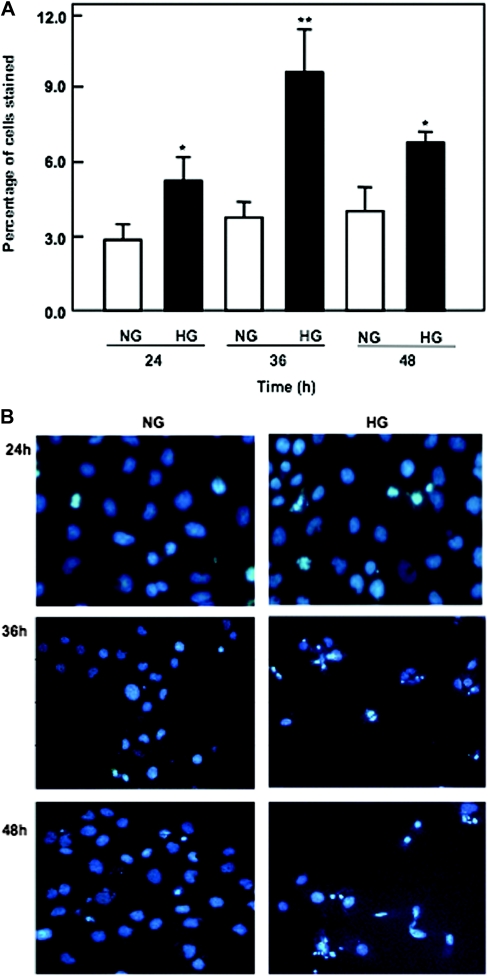
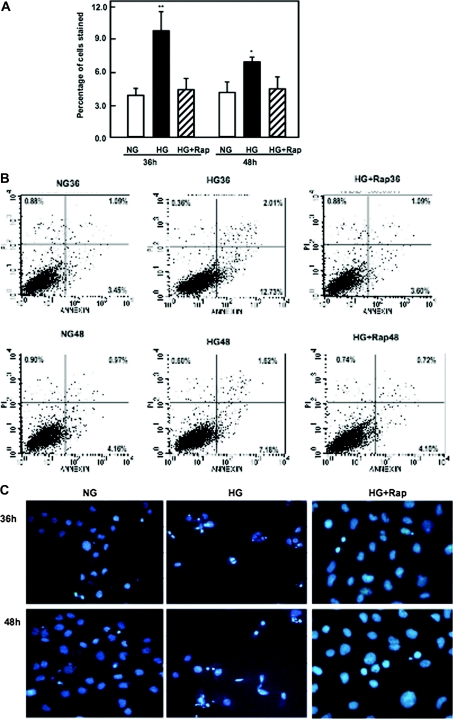
To further determine the above hypothesis, apoptosis was induced by high glucose in HK2 cells. Cells were examined by double staining with annexin V and propidium iodide (PI) using flow cytometry. In this assay, we determined the ability of FITC conjugate of annexin V to stain high glucose–exposed cells independently (during early apoptosis) and in combination with PI (during secondary necrosis). In cells exposed to high glucose, the percentage of cells in early apoptosis was significantly increased compared with normal glucose exposure. Data from Figure 4A show that cells exposed to high glucose at the indicated time points showed a gradual increase in the number of apoptotic cells reaching a peak at 36 hours and a decrease in the percentage of apoptotic cells at 48 hours, consistent with the data shown by the apoptotic cascade signals in the Western blot analysis. Increase in the number of apoptotic cells after treatment with high glucose was also confirmed by Hoechst staining (Figure 4B). Annexin V and Hoechst staining data show that exposure of the cells to high glucose has a maximum apoptotic effect at 36 hours.
Figure 4.
High glucose induces apoptosis of proximal tubular epithelial cells. (A) Data represent annexin V binding and PI staining of cells exposed to high glucose concentration (25 mM). Serum-starved cells were exposed to glucose for the time periods indicated. Cells were harvested and stained with FITC-conjugated annexin V and PI for 15 minutes. The cells were analyzed by flow cytometer as described in Concise Methods. Maximum number of apoptotic cells was shown at 36 hours after high glucose treatment. (B) Cells were plated on a two-chamber slide. Serum-starved cells were treated with normal or high glucose for various time points as indicated. Apoptotic nuclei were detected using Hoechst 33258 (Sigma) staining and analyzed by fluorescence microscopy at 350-nm excitation and 460-nm emission. Annexin and Hoechst staining were repeated four times for each time point. *P < 0.05, **P < 0.01.
High Glucose Enhances Tuberin Phosphorylation and mTOR Activation in Proximal Tubular Cells
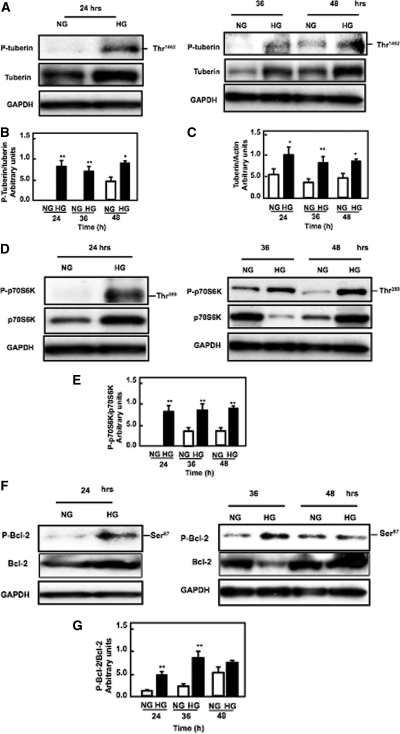
To show involvement of the tuberin/mTOR pathway in the apoptosis signal cascade, HK2 cells were incubated for the indicated time periods in serum-free medium containing either normal glucose or high glucose. High glucose caused an increase in tuberin phosphorylation at Thr1462 with a maximum expression at 24 hours and then decreased at 48 hours (Figure 5, A and B). However, high glucose caused an increase in total tuberin at all time points (Figure 5, A and C), suggesting that tuberin promotes the cells to go apoptosis pathway. The effect of high glucose on the downstream regulator of mTOR was determined by measuring the phosphorylation levels of p70S6K at Thr389. Phosphorylation of p70S6K was increased in cells incubated with high glucose for 24 to 48 hours, and a maximum effect was observed at 36 hours (Figure 5, D and E).
Figure 5.
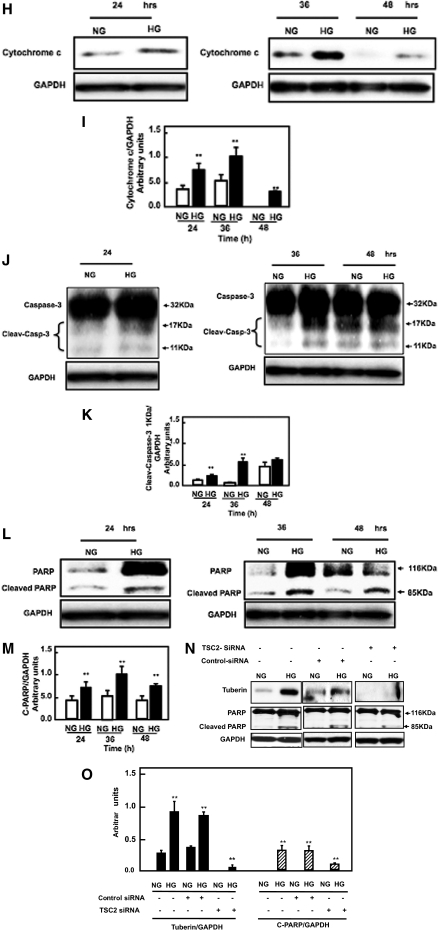
High glucose increases tuberin phsophorylation and mTOR activation to activate apoptosis signal pathways in proximal tubular epithelial HK2 cells. (A) Representative immunoblot shows an increase in phospho-tuberin (p-tuberin) and total tuberin. (B and C) Histograms in the bottom panel show increase in phospho-tuberin/tuberin expression and increase in total tuberin/actin expression in cells treated with high glucose for the time periods indicated. (D) Representative immunoblot shows an increase in phopho-p70S6K (P-p70S6K) in HK2 cells treated with high glucose (25 mM glucose d-glucose) for the time periods indicated. (E) Histograms show increased P-p70S6K/p70S6K. (F and G) High glucose enhances phosphorylation of Bcl-2, (H and I) increases cytosolic cytochrome c expression, (J and K) increases cleavage of caspase at 11 kD, and (L and M) increases cleavage of PARP at 85 kD in HK2 cells treated for the time periods indicated. Glyceraldehyde 3-phosphate dehydrogenase (GAPDH) was used as a loding control. Western blot was repeated three times for each time point. (N and O) Cells transfected with siRNA against tuberin (TSC2) and treated with low or high glucose show significant decrease in tuberin protein expression and decrease in cleavage of PARP. *P < 0.05, **P < 0.01.
Activation of the mTOR Pathway by High Glucose Activates the Apoptotic Cascade Signals in Proximal Tubular Epithelial Cells
Activation of the mTOR pathway by high glucose is associated with an increase in the phosphorylation of Bcl-2. Phosphorylation of Bcl-2 at Ser87 was increased in cells incubated with high glucose for 24 to 48 hours and reached a maximum at 36 hours (Figure 5, F and G). Consistent with phosphorylation of Bcl-2, we observed an increase in cytosolic cytochrome c expression at 24 to 48 hours that reached a maximum at 36 hours, suggesting that phosphorylation/inactivation of Bcl-2 triggers the release of cytochrome c from the mitochondria into the cytosol (Figure 5, H and I).
High glucose also activates and cleaves caspase 3 at 17 and11 kD (Figure 5, J and K). The maximum effect of high glucose on cleaving PARP at 116 and 85 kD was observed at 36 hours (Figure 5, L and M). These data show that this process starts as early as 24 hours, reaches a maximum at 36 hours, and gradually starts to subside by 48 hours after high glucose treatment (Figure 5, L and M). The above data collectively show that high glucose increases phosphorylation of tuberin, resulting in the activation of the mTOR pathway that phosphorylates/activates p70S6K, phosphorylates/inactivates BCL-2, and triggers the release of cytochrome c from mitochondria into the cytosol to activate the downstream caspases and cleave PARP, leading to an increase in cell apoptosis.
Downregulation of Tuberin by siRNA Prevents Apoptosis
To confirm the role of tuberin in apoptosis, cells transfected with control siRNA and treated with high glucose show a significant increase in tuberin protein expression and increase in cleavage of PARP (Figure 5, N and O). On the other hand, cells transfected with siRNA against tuberin (TSC2) and treated with high glucose show a significant decrease in tuberin protein expression and a decrease in cleavage of PARP (Figure 5, N and O). These data indicate that tuberin activates apoptosis.
Inhibition of mTOR Activity Decreased Apoptosis in Proximal Tubular Epithelial Cells
To study whether inhibition of the mTOR pathway could prevent the activation of the apoptosis cascade pathway, serum-starved HK2 cells were pretreated with 20 nM rapamycin for 24 hours before exposure to high glucose. Apoptosis was examined at 36 and 48 hours using flow cytometry, after staining the cells with annexin V and PI. Apoptotic cells were also measured by Hoechst staining. The number in the bottom right of the quadrant represents cells in early apoptosis. Inhibition of mTOR activation by rapamycin significantly decreases apoptosis at 36 and 48 hours in cells treated with high glucose (Figure 6, A and B). A decrease in apoptotic cells pretreated with rapamycin was confirmed by Hoechst staining (Figure 6C).
Figure 6.
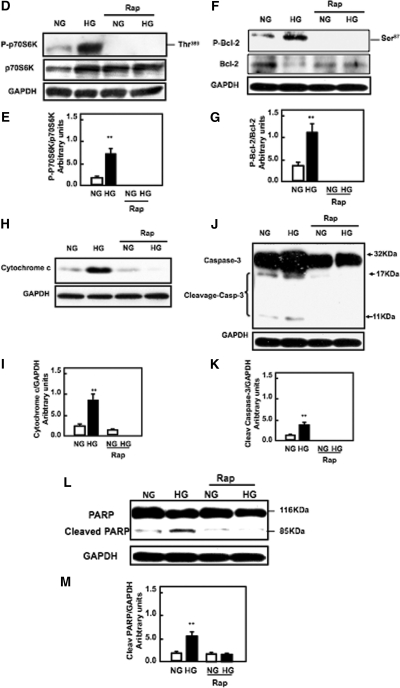
Rapamycin inhibits mTOR activation and decreases apoptosis of proximal tubular epithelial cells treated with high glucose. (A) Serum-starved cells were treated with rapamycin (20 nM) for 24 hours before exposure to high glucose for the time periods indicated. Data represent annexin V binding and PI staining of cells exposed to high glucose concentration (25 mM). Cells were harvested and stained with FITC-conjugated annexin V and PI for 15 minutes. The cells were analyzed by flow cytometer as described in Concise Methods. Histogram represents mean ± SE of three independent experiments. Significant difference from untreated cells is indicated by *P < 0.05 and **P < 0.01. (B) Flow cytometry data represent one of three experiments. (C) Cells were plated on two-chamber slides. Serum-starved cells were treated with normal or high glucose in the presence or absence of rapamycin for various time points as indicated. Apoptotic nuclei were detected using Hoechst 33258 staining and analyzed by fluorescence microscopy at 350-nm excitation and 460-nm emission. (D and E) Immunoblot and histogram show that pretreatment of HK2 cells with rapamycin (20 nM) for 24 hours before exposure to high glucose for 36 hours abolishes phosphorylation of p70S6K, (F and G) decreases Bcl2 phosphoryaltion at Ser 87, (H and I) decreases cytosolic cytochrome c expression, (J and K) decreases cleavage of caspase-3 at 11 kD, and (L and M) decreases the cleavage of PARP at 85 kD. GAPDH was used as loading control. Annexin, Hoechst staining, and Western blot were repeated three times for each time point.
To study whether a decrease in apoptosis is related to the mTOR pathway, we measured the expression of phospho-p70S6K and downstream signals cascade of apoptosis, Bcl2, caspase 3, cytochrome c, and PARP. Pretreatment of cells with rapamycin before exposure to high glucose abolished phosphorylation of p70S6K at Thr389 (Figure 6D and E) and phosphorylation of Bcl2 at Ser87 (Figure 6F and G), decreased cytosolic cytochrome c expression (Figure 6H and I), abolished the activity of caspase 3 (Figure 6J and K), and decreased cleavage of PARP (Figure 6L and M). Collectively, these data suggest that blocking mTOR activity is an important pathway involved in activation of the apoptosis cascade signals.
High Glucose Redistributes YY1 from Cytoplasm into Nucleus
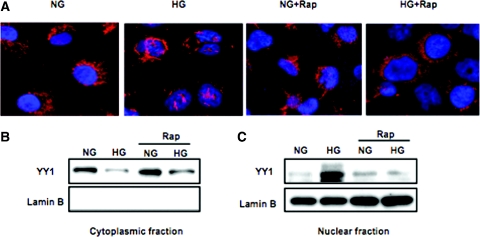
To determine the mechanism by which high lucose enhances apoptosis cascade signals in HK2 cells, we show the cytoplasmic and nuclear distribution of the transcriptional regulator YY1 by immunohistochemical staining and Western blot analysis. The staining of the cells shows the location of YY1 in the cytoplasm of cells grown in normal glucose (Figure 7A). Translocation of YY1 from the cytoplasm into the nucleus reaches a maximum at 36 hours in high glucose–treated cells (Figure 7A). Moreover, pretreatment of the cells with rapamycin before high glucose blocked its translocation (Figure 7A). We confirmed the redistribution of YY1 by Western blot analysis in cytoplasmic and nuclear fractions (Figure 7, B and C). These data suggest that high glucose increases the nuclear redistribution of YY1 that may result in cleavage of PARP and an increase in programmed cell death. However, inhibition of mTOR activity by rapamycin reversed YY1 localization, indicating that activation of the mTOR pathway plays an important role in the activation of apoptotic signaling in cells treated with high glucose.
Figure 7.
High glucose results in the redistribution of YY1 from the cytoplasm to nucleus, and rapamycin reverses these effects. Immunostaining and Western blot analysis were used to detect the localization of YY1 in cells exposed to normal glucose or high glucose for 36 hours or cells treated with rapamycin (20 nM) for 24 hours before exposure to high glucose for 36 hours. (A) Alexa Fluro 594 red signals for YY1 were detected using a filter with excitation range of 535 nm and DAPI blue signals for nuclear DNA using a filter with excitation at 488 nm. To show staining specificity, control cells were stained without primary antibody. (B) High glucose decreases YY1 in the cytoplasmic fraction. (C) High glucose increases YY1 in the nuclear fraction. Pretreatment of the cells with rapamycin reversed these changes. Lamin B was used as a nuclear marker. Immunostaining and Western blot were repeated three times.
DISCUSSION
In this study, we identified a novel mechanism of tubular epithelial cell apoptosis in diabetes. Our data showed for the first time that diabetes is associated with enhanced phosphorylation of tuberin, increase total tuberin, phosphorylation/activation of the mTOR substrate p70S6K, phosphorylation/inactivation of Bcl-2, an increase in cytosolic cytochrome c expression, activation of caspase 3, and cleavage of PARP, leading to apoptosis of tubular epithelial cells in the kidney cortex of rats. TUNEL staining showed that diabetes causes apoptosis, mainly in tubular epithelial cells of the kidney cortex of rats. We also showed that this pathway is activated in cultured human proximal tubular epithelial cells exposed to high glucose. In cultured proximal tubular epithelial cells, high glucose enhances phosphorylation of tuberin/p70S6K/Bcl-2, release of cytochrome c from mitochondria, and activation of caspase 3. In addition, downregulation of tuberin with siRNA abolished tuberin expression and significantly decreased cleavage of PARP. Rapamycin treatment of cells exposed to high glucose resulted in 1) inhibition of mTOR, 2) decrease in p70S6K/Bcl-2 phosphorylation, 3) decrease in cytochrome C expression, 4) increase in cleavage of caspase 3, 5) cytoplasmic localization of YY1, and 6) a decrease in cleavage of PARP. These data indicate that the tuberin/mTOR pathway plays an important role in the activation of this apoptotic signaling cascade. Tuberin has been shown to increase the susceptibility of the tumor cells to apoptosis and to trigger apoptosis through activation of the proapoptotic protein BAD.11,12 Our data showed that an increase in tuberin expression in cells treated with high glucose results in apoptosis, whereas downregulation of tuberin with siRNA inhibits the proapoptotic signals, indicating the important role of tuberin in the proapoptotic signal cascade.
There is an evidence of the involvement of the mTOR pathway in cell death/survival24,25 and in autophagy.26,27 mTOR inhibition plays a preponderant role in the control of net protein synthesis and cell size. In addition, mTOR may also have a pleiotropic function in the regulation of cell death. This function seems to be dictated by the cellular context and by multiple downstream targets including apoptosis-regulatory proteins such p53, Bad, and Bcl-2. Another explanation is that rapamycin prevents translocation of mTOR from the cytoplasm to the nucleus and prevents transcriptional activation and phosphorylation of p53. That may lead to inhibition of the proapoptotic proteins such as Bax and Bcl2 and activation of the mitochondrial cell death pathway. Inactivated Bcl-2 is known to trigger the release of cytochrome c from mitochondria and to activate the downstream caspases.15,16 Our data showed an increase in the phosphorylation of Bcl-2, tuberin, and 70S6K in the kidney cortex of rats with type I diabetes. This is associated with an increase in cytosolic cytochrome c expression and enhanced cleavage of caspase 3. Cleaved PARP is also significantly higher in the kidney cortex of diabetic rats. Taken together, these findings indicate that, in diabetes, apoptotic signals are activated through phosphorylation of tuberin and activation of the mTOR pathway. Activation of mTOR and downstream target p70S6K is associated with increased phosphorylation/inactivation of Bcl-2 and release of cyotchrome c from the mitochondria to the cytoplasm, suggesting that the tuberin/mTOR pathway plays a critical role in the apoptosis of tubular epithelial cells in the kidney cortex of rats with diabetes. We also showed that chronic exposure of HK2 cells to high glucose increases the number of apoptotic cells at 24 hours, with a maximum effect at 36 hours. High glucose also enhances phosphorylation of tuberin and p70S6K at 24 hours, with a maximum effect at 36 hours. These effects were markedly reduced by rapamycin.
The caspases, a family of cysteine-dependent, aspartate-directed proteases, are prominent among apoptosis-associated molecules.28 Once activated, caspases cleave a variety of intracellular polypeptides, including major structural elements of the cytoplasm and nucleus, which are components of DNA repair machinery. Caspase-3 is expressed in cells as an inactive precursor from which the p11 subunit of the mature caspase-3 is proteolytically cleaved during apoptosis. Our data showed the cleavage of caspase 3 and generation of the 11-kD active fragment in the kidney cortex of diabetic rats. Caspase 3 was also cleaved at 11 kD in proximal tubular epithelial cells treated with high glucose, consistent with increased cytochrome c expression, suggesting that cytochrome c activates caspase 3. YY1 is a substrate of caspases and one of the few proteins that modifies PARP-1 in response to DNA damaging agents.23,29 Our data showed that YY1 is translocated from the cytoplasm to the nucleus and is associated with cleavage of PARP, resulting in apoptosis of proximal tubular cells treated with high glucose. Treatment of the cells with rapamycin blocks the translocation of YY1 from the cytoplasm to nucleus, reduces cleavage of PARP, and decreases the number of the apoptotic cells.
PARP, a DNA repair enzyme, when cleaved, plays a critical role in apoptosis in several cells, including renal cells.20–22 PARP is cleaved by caspase 3 early during apoptosis in many different cell types. The cleavage of PARP is thought to prevent depletion of energy, NAD, and ATP required at later stages of apoptosis.29 PARP, when cleaved into a 85-kD fragment, is inactivated and is unable to repair DNA breaks or fragmentation. We show that phosphorylation of tuberin and activation of mTOR is associated with the cleavage of PARP in diabetic rats and in proximal tubular epithelial cells treated with high glucose, suggesting that the mTOR pathway plays an important role in activation of the apoptosis signaling cascade.
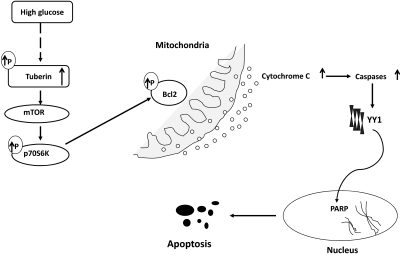
In summary, our data provide the first evidence that hyperglycemia in diabetes and high glucose concentration leads to increase total tuberin expression and phosphorylation, thereby activating the mTOR pathway. Activation of mTOR in turns phosphorylates/inactivates BCL-2 with increased release of cytochrome c from the mitochondria to the cytoplasm. Cytochrome c cleaves caspase 3, and the activated caspase 3 likely results in translocation of YY1 from the cytoplasm to the nucleus to cleave PARP or another death substrate, resulting in an increase in programmed cell death (Figure 8). This signaling cascade may play an important role in apoptosis induced by hyperglycemia during diabetic nephropathy. Furthermore, our results highlight the notion that optimal management of diabetic complications, particularly diabetic kidney disease, will require a full understanding of the chronic effects of hyperglycemia.
Figure 8.
Proposed model of activation of the apoptosis cascade signals in diabetes.
CONCISE METHODS
Animals
Two-month-old male Long Evans rats weighing between 200 and 225 g were purchased from a breeding colony maintained at the University of Texas M.D. Anderson Cancer Center, Smithville, TX. The animals were allowed food and water ad libitum before and during the experiments. The rats were divided into three groups of four rats per group. Group 1 (controls) was injected with an equivalent amount of sodium citrate buffer alone. Group 2 was injected intravenously via the tail vein with 55 mg/kg body weight STZ (Sigma, St. Louis, MO) in sodium citrate buffer (0.01 M, pH 4.5) under isofluorane inhalation anesthesia (Abbott, Abbott Park, IL) to induce type 1 diabetes. Group 3 was injected with STZ as in group 2 and was treated with four to five units of insulin daily. Average serum glucose levels and body weight of both groups were measured at 4 weeks of STZ injection. Animals were killed at 4 weeks, and the kidneys were removed rapidly. The kidneys were dissected longitudinally, one half was preserved in 10% formalin in PBS, pH 7.4, for TUNEL assay, and the remaining tissue was used for biochemical analysis. The Institutional Animal Care and Use Committee of the University of Texas Health Science Center at San Antonio approved these animal studies.
Proximal Tubular Epithelial Cells
HK-2 cells, a proximal tubule cell line (American Type Cell Collection, Rockville, MD), were grown in Dulbecco's MEM and Nutrient Mixture F-12 containing 10% FBS and 5 mmol/L glucose. Confluent cells were growth-arrested overnight in serum-free Dulbecco's MEM before the experiments.
In Vivo Experiments
TUNEL Assay.
TUNEL staining using the TUNEL Apoptosis Detection Kit (Upstate) was performed according to the manufacturer's instructions. The sections were examined using light microscopy. Sections incubated with PBS, instead of TDT enzyme solution, served as the negative controls. The number of TUNEL-positive cells was counted in five randomly selected fields under 400× magnification for each animal. Four animals were studied per group.
Western Blot Analysis.
Homogenates of kidney cortex were prepared as described previously.30 Protein concentrations were determined with the Bradford assay31 using BSA as a standard. Western blot analysis was performed as described previously.32 Phospho-tuberin, tuberin, phospho-p70S6k, p70S6K, phospho-Bcl2, cytochrome c, caspase 3, and PARP antibodies were from Cell Signaling (Beverly, MA); actin and GAPDH antibodies were obtained from Santa Cruz Biotechnology. After extensive washing of membrane with Tris-buffered saline Tween-20 buffer, anti-rabbit Ig conjugated with horseradish peroxidase was added at a 1:5000 dilution and incubated for 1 hour at room temperature. An enhanced chemiluminescence kit (Amersham) was used to identify protein expression. Expression of each protein was quantified by densitometry using National Institutes of Health image 1.62 software and normalized to a loading control.
Downregulation of Tuberin by siRNA.
HEK293 cells were grown in 6-well plates in normal glucose medium. Selected siRNA duplexes with “UU” overhangs and 5′ phosphate on the anti-sense strand against TSC2 or control siRNA were obtained as a kit from Santa Cruz. Cells were infected with siRNA specific for TSC2 or control nonspecific siRNA duplexes as described previously.33 Cells were treated with high glucose for 36 hours before harvesting for Western blot analysis.
In Vitro Experiments
HK2 cells were seeded at a density of 0.5 × 10⁶ cells on 60-mm petri dishes in 5 mM glucose. When cells reached 90% confluency, serum was withdrawn for 24 hours, and cells were treated with high glucose (25 mM) alone or preincubated with rapamycin (20 nM) for 24 hours under serum-free conditions before exposure to high glucose for various time points as indicated. The cells were lysed in radioimmune precipitation assay buffer as described above. Protein concentrations were determined with the Bradford assay.31 Protein (40 μg) was subjected to 8% SDS-PAGE and Western blot.
Cell Lysates and Tissue Homogenates Fractionation
Cytosolic protein fractions were extracted from the cell lysates and kidney cortex homogenates using mitochondria and cytosol fractionation kit (Pierce). Cytoplasmic and nuclear fractions were also extracted from the cell lysates using a nuclear and cytoplasmic fractionation kit (Pierce). The protein concentration of the nuclear extracts was determined using the Bradford method.31
Apoptosis Assay
Annexin Assay.
The apoptotic cells were measured using annexin V-FITC conjugated to PI by flow cytometry. Serum-starved cells were treated with normal or high glucose in the presence or absence of rapamycin for various time points as indicated. Harvested cells were assayed for apoptosis using an annexin V-FITC apoptosis detection kit (Calbiochem) according to the manufacturer's instructions. To prepare the cell samples for flow cytometry, cells were gently washed two times with annexin-binding buffer. To each plate, 0.5 ml of Trypsin (0.05%) was added, and the plates were incubated until the cells appear detached by microscopic evaluation. Cells were released from the plate with gentle tapping and added to the collected cells from the medium. Cells were suspended in cold binding buffer and stained with annexin V FITC and PI. Analysis was conducted for 20,000 cells using a flow cytometer with CellQuest software (Becton-Dickinson, Rutherford, NJ) using FL1 and FL2 ranges for annexin V FITC and PI, respectively. In each of the graphs, the bottom left quadrant represents live cells, the bottom right quadrant represents cells in early apoptosis, the top right quadrant represents cells in secondary necrosis, and the top left quadrant represents cells stained with PI alone.
Hoechst Staining.
Cells were plated on two-chamber slides. Serum-starved cells were treated with normal or high glucose in the presence or absence of rapamycin for various time points as indicated. Apoptotic nuclei were detected using Hoechst 33258 (Sigma) staining (10 μg/ml, 30 min at 37°C) in cells fixed with 4% paraformaldehyde and analyzed via fluorescence microscopy at 350-nm excitation and 460-nm emission.
Immunostaining of YY1
A double fluorescence labeling method was used as described previously30 with minor modifications. HK2 cells in chamber slides were serum-starved for 24 hours and incubated with 25 mM glucose or treated with rapamycin for 24 hours before exposed to high glucose for the indicated time periods. The cells were washed with PBS, fixed, and stained with mouse antibody against YY1 (Santa Cruz), followed by treatment with anti-mouse IgG (1:200) conjugated with FITC. The slides were reacted with Vectashield Mounting Medium with 4',6-diamidino-2-phenylindole (DAPI) (Vector Laboratories). In this assay, DNA was labeled with DAPI, and YY1 was identified by the primary monoclonal antibody and Alexa Fluro 594 conjugated secondary antibody. Alexa Fluro 594 red signals for YY1 were detected using a filter with an excitation range of 535 nm and DAPI blue signals for nuclear DNA using a filter with excitation at 488 nm. Alexa Fluro 594 and DAPI were detected using Olympus FV-500 laser scanning confocal microscopy. To show staining specificity, control cells were stained without primary antibody.
Statistical Analysis
Data are presented as mean ± SE. Statistical differences were determined using ANOVA followed by Dunnett's (Exp. versus Control) test using one trial analysis. Significant association was defined when P < 0.05 and 0.01 as compared with control.
DISCLOSURES
None.
Acknowledgments
Confocal fluorescence microscopy and FACS analysis were performed in the core optical imaging facility supported by UTHSCSA and San Antonio Cancer Institute and the immunostaining at the Morphology core of the George O' Brien Kidney Research Center. We thank Dan Riley, M.D., for reading the manuscript. This work was supported in part by grants from a VA merit review award and NIH RO1 (DK 078971) (to H.E.A.), a Research Scholar Award from The Italian Society of Nephrology (to S.S.), and the American Heart Association, New Investigator Award and Merit Review Award from South Texas Veterans Healthcare System (to S.L.H.).
Footnotes
Published online ahead of print. Publication date available at www.jasn.org.
REFERENCES
- 1. Verzola D, Bertolotto MB, Villaggio B, Ottonello L, Dallegri F, Berruti V, Gandolfo MT, Frumento G, Garibotto G, Defferrari G: Taurine prevents apoptosis induced by high ambient glucose in human tubule renal cells. J Investig Med 50: 443–451, 2002 [DOI] [PubMed] [Google Scholar]
- 2. Allen AD, Harwood SM, Varagunam M, Raftery MJ, Yaqoob MM: High glucose-induced oxidative stress causes apoptosis in proximal tubular epithelial cells and is mediated by multiple caspases. FASEB J 17: 908–921, 2003 [DOI] [PubMed] [Google Scholar]
- 3. Liu F, Brezniceanu ML, Wei CC, Chénier I, Sachetelli S, Zhang SL, Filep JG, Ingelfinger JR, Chan JS: Overexpression of angiotensinogen increases tubular apoptosis in diabetes. J Am Soc Nephrol 19: 269–280, 2007 [DOI] [PMC free article] [PubMed] [Google Scholar]
- 4. Verzola D, Bertolotto MB, Villaggio B, Ottonello L, Dallegri F, Salvatore F, Berruti V, Gandolfo MT, Garibotto G, Defferrari G: Oxidative stress mediates apoptotic changes induced by hyperglycemia in human tubular kidney cells. J Am Soc Nephrol 15: S85–S87, 2004 [DOI] [PubMed] [Google Scholar]
- 5. Park Sh, Choi HJ, Lee JH, Woo Ch, Kim JH, Han HJ: High glucose inhibits renal proximal tubule cell proliferation and involves PKC, oxidative stress and TGF-β1. Kidney Int 59: 1695–1705, 2001 [DOI] [PubMed] [Google Scholar]
- 6. Simone S, Gorin Y, Velagapudi C, Abboud HE, Habib SL: Mechanism of oxidative DNA damage in diabetes. Diabetes 57: 2626–2636, 2008 [DOI] [PMC free article] [PubMed] [Google Scholar]
- 7. Garami A, Zwartkruis FJ, Nobukuni T, Joaquin M, Roccio M, Stocker H, Kozma SC, Hafen E, Bos JL, Thomas G: Insulin activation of Rheb, a mediator of mTOR/S6K/4E-BP signaling is inhibited by TSC1 and TSC2. Mol Cell 11: 1457–1466, 2003 [DOI] [PubMed] [Google Scholar]
- 8. Saucedo LJ, Gao X, Chiarelli DA, Li L, Pan D, Edgar BA: Rheb promotes cell growth as a component of the insulin/TOR signaling network. Nat Cell Biol 5: 566–571, 2003 [DOI] [PubMed] [Google Scholar]
- 9. Tee AR, Manning BD, Roux PP, Cantley LC, Blenis J: Tuberous sclerosis complex gene products, Tuberin and Hamartin, control mTOR signaling by acting as a GTPase-activating protein complex toward Rheb. Curr Biol 13: 1259–1268, 2003 [DOI] [PubMed] [Google Scholar]
- 10. Zhang Y, Gao X, Saucedo LJ, Ru B, Edgar BA, Pan D: Rheb is a direct target of the tuberous sclerosis tumor suppressor proteins. Nat Cell Biol 5: 578–581, 2003 [DOI] [PubMed] [Google Scholar]
- 11. Kolb TD, Duan L, Davis MA: Tsc2 expression increases the susceptibility of renal tumor cells to apoptosis. Toxicol Sci 88: 331–339, 2005 [DOI] [PubMed] [Google Scholar]
- 12. Freilinger A, Rosner M, Krupitza G, Nishino M, Lubec G, Korsmeyer SJ, Hengstschlager M: Tuberin activates the proapoptotic molecule BAD. Oncogene 25: 6467–6479, 2006 [DOI] [PubMed] [Google Scholar]
- 13. Dufner A, Thomas G: Ribosomal S6 kinase signaling and the control of translation. Exp Cell Res 253: 100–109, 1999 [DOI] [PubMed] [Google Scholar]
- 14. Calastretti A, Bevilacqua A, Ceriani C, Vigano S, Zancai P, Capaccioli S, Nicolin A: Damaged microtubules can inactivate BCL-2 by means of the mTOR kinase. Oncogene 20: 6172–6180, 2001 [DOI] [PubMed] [Google Scholar]
- 15. Cory S, Adams JM: The BCL2 family: Regulators of the cellular life-or-death switch. Nat Rev Cancer 2: 647–656, 2002 [DOI] [PubMed] [Google Scholar]
- 16. Jeong BC, Kwak C, Cho KS, Kim BS, Hong SK, Kim JI, Lee C, Kim HH: Apoptosis induced by oxalate in human renal tubular epithelial HK2 cells. Urol Res 33: 87–92, 2005 [DOI] [PubMed] [Google Scholar]
- 17. Nicholson DW, Ali A, Thornberry NA, Vaillancourt JP, Ding CK, Gallant M, Gareau Y, Griffin PR, Labelle M, Lazebnik YA, Munday NA, Raju SM, Smulson ME, Amin TT, Yu Vl, Miller DK: Identification and inhibition of the CED-3 protease necessary for mammalian apoptosis. Nature 376: 37–43, 1995 [DOI] [PubMed] [Google Scholar]
- 18. Tewari M, Quan LT, O'Rourke K, Desnoyers S, Zeng Z, Beidler DR, Poirier GG, Salvesen GS, Dixit VM: Yama/CPP32β, a mammalian homolog of CED-3 is a CrmA-inhibitable protease that cleaves the death substrate poly(ADP-Ribose) polymerase. Cell 81: 801–809, 1995 [DOI] [PubMed] [Google Scholar]
- 19. Rhun YL, Kirklan JB, Shah GM: Cellular responses to DNA damage in the absence of poly(ADP-ribose) polymerase. Biochem Biophys Res Commun 245: 1–10, 1998 [DOI] [PubMed] [Google Scholar]
- 20. Soriano FG, Virag L, Jagtap P, Szabo E, Mabley JG, Liaudet L, Marton A, Hoyt DG, Murthy KGK, Salzman A, Southan GJ, Szabo C: Diabetic endothelial dysfunction: The role of poly(ADP-ribose) polymerase activation. Nat Med 7: 108–113, 2001 [DOI] [PubMed] [Google Scholar]
- 21. Du X, Matsumura T, Edelstein D, Rossetti L, Zsengeller Z, Szabo C, Brownlee M: Inhibition of GAPDH activity by poly(ADP-ribose) polymerase activates three major pathways of hyperglycemic damage in endothelial cells. J Clin Invest 112: 1049–1057, 2003 [DOI] [PMC free article] [PubMed] [Google Scholar]
- 22. Brownlee M: The pathobiology of diabetic complications. Diabetes 54: 1615–1625, 2005 [DOI] [PubMed] [Google Scholar]
- 23. Krippner-Heidenreich A, Walsemann G, Beyrouthy MJ, Speckgens S, Kraft R, Thole H, Talanian RV, Hurt MM, Luscher B: Caspase-dependent regulation and subcellular redistribution of the transcriptional modulator YY1 during apoptosis. Molec Cell Biol 25: 3704–3714, 2005 [DOI] [PMC free article] [PubMed] [Google Scholar]
- 24. Sekulic A, Hudson CC, Homme JL, Yin P, Otterness DM, Karnitz LM, Abraham RT: A direct linkage between the phosphoinositide 3-kinase-AKT signaling pathway and the mammalian target of rapamycin in mitogen-stimulated and transformed cells. Cancer Res 60: 3504–3513, 2000 [PubMed] [Google Scholar]
- 25. Chen J, Fang Y: A novel pathway regulating the mammalian target of rapamycin (mTOR) signaling. Biochem Pharmacol 64: 1071–1077, 2002 [DOI] [PubMed] [Google Scholar]
- 26. Anita Öst, Kristoffer Svensson, Iida Ruishalme, Cecilia Brännmark, Niclas Franck. Attenuated mTOR signaling and enhanced autophagy in adipocytes from obese patients with type 2 diabetes. Mol Med 16: 235–246, 2010 [DOI] [PMC free article] [PubMed] [Google Scholar]
- 27. Zhou Z, Wu S, Li X, Xue Z, Tong J: Rapamycin induces autophagy and exacerbates metabolism associated complications in a mouse model of type 1 diabetes. Indian J Exp Biol 48: 31–38, 2010 [PubMed] [Google Scholar]
- 28. Earnshaw WC, Martins LM, Kaufmann SH: Mammmalian caspases: structure, activation, substrates, and functions during apoptosis. Annu Rev Biochem 68: 383–424, 1999 [DOI] [PubMed] [Google Scholar]
- 29. Berger NA: Poly(ADP-ribose) in the cellular response to DNA damage. Radiation Res 101: 4–15, 1985 [PubMed] [Google Scholar]
- 30. Habib SL, Phan MN, Patel Sk LID, Monks TJ, Lau SS: Reduced constitutive 8-oxoguanine-DNA glycosylase expression and impaired induction following oxidative DNA damage in the tuberin deficient Eker rat. Carcinogenesis 24: 573–582, 2003 [DOI] [PubMed] [Google Scholar]
- 31. Bradford MM: A rapid and sensitive method for the quantitation of microgram quantities of protein utilizing the principle of protein-dye binding. Anal Biochem 72: 248–254, 1976 [DOI] [PubMed] [Google Scholar]
- 32. Habib SL, Simone S, Barnes JJ, Abboud HE: Tuberin haploinsufficiency is associated with the loss of OGG1 in rat kidney tumors. Molec Cancer 7: 10–14, 2008 [DOI] [PMC free article] [PubMed] [Google Scholar]
- 33. Habib SL, Riley DJ, Bhandari B, Mahimainathan L, Abboud HE: Tuberin regulates the DNA repair enzyme OGG1. Am J Physiol Renal Physiol 294: F281–F290, 2008 [DOI] [PubMed] [Google Scholar]


