

Abstract
The voltage-dependent anion channel (VDAC) in the outer membrane of mitochondria serves an essential role in the transport of metabolites and electrolytes between the cell matrix and mitochondria. To examine its structure, dynamics, and the mechanisms underlying its electrophysiological properties, we performed a total of 1.77 μs molecular dynamics simulations of human VDAC isoform 1 in DOPE/DOPC mixed bilayers in 1 M KCl solution with transmembrane potentials of 0, ±25, ±50, ±75, and ±100 mV. The calculated conductance and ion selectivity are in good agreement with the experimental measurements. In addition, ion density distributions inside the channel reveal possible pathways for different ion species. Based on these observations, a mechanism underlying the anion selectivity is proposed; both ion species are transported across the channel, but the rate for K+ is smaller than that for Cl− because of the attractive interactions between K+ and residues on the channel wall. This difference leads to the anion selectivity of VDAC.
Introduction
The voltage-dependent anion channels (VDACs) are 30-kDa transmembrane (TM) proteins found in the outer membrane of mitochondria. They provide important conducting pathways for simple ions such as K+, Cl−, and Ca2+, and small molecules like pyruvate and ATP, between the cytosol and the intermembrane space in mitochondria (1). There is also evidence that VDACs are involved in cancer cell metabolism (2) and release of apoptotic proteins from mitochondria (3). Isoforms of VDACs exist in many organisms. In human mitochondria, three VDAC isoforms (hVDAC1, hVDAC2, and hVDAC3) have been identified (4). Although they all provide exchange pathways for ions and metabolites between the mitochondria and cell matrix, their expression profiles and physiological properties are different (5). VDAC1 shows characteristic electrophysiological properties (e.g., single-channel conductance, anion selectivity, and voltage dependence) that are shared in VDACs across different eukaryote species from yeast to human (6). Therefore, it is presently the most extensively studied VDAC isoform. Studies of VDACs from rat liver mitochondria reveal moderate anion selectivity. The selectivity ratio between Cl− and K+ is ∼2:1 in 1.0:0.1 M KCl asymmetric solution (7), and the single-channel conductance ranges from 3.9 nS to 4.5 nS in 1.0 M KCl solution (8). When inserted into planar phospholipid membranes with low TM potential (∼±10 mV), VDACs are open and preferentially transport anions. Increasing the TM potential to ∼±30 mV, however, shifts the channels into a slightly cation-selective closed state with reduced single-channel conductance of 1–2 nS (7). Given the gating threshold of VDAC and the mitochondria resting TM potential of about −180 mV (9), VDACs are presumably closed in the outer membrane of mitochondria at the resting state.
hVDAC1 was first cloned and expressed in human B-lymphocyte cells (10). It consists of 283 amino acids, with alternating hydrophobic and hydrophilic residues in many regions, consistent with β-strands in a TM β-barrel (11). Recent NMR and x-ray structures of human and mouse VDAC1 (12–14) confirm the β-barrel architecture of the channel. In both structures of hVDAC1 (12,14), there are 19 β-strands, with the first and last strands parallel to each other, forming a cylindrical barrel of ∼30 Å in diameter. A part of the N-terminus forms a short α-helix that extends into the channel lumen (Fig. 1). Of the 179 residues residing in the pore lining, 17 are acidic and 20 are basic, as might be anticipated for a channel that is mildly anion-selective but also transports cations. VDAC1 orientation in the mitochondria membrane, i.e., whether both the N- and C-termini face the cytosol (15,16) or the intermembrane side (17), is still under debate.
Figure 1.
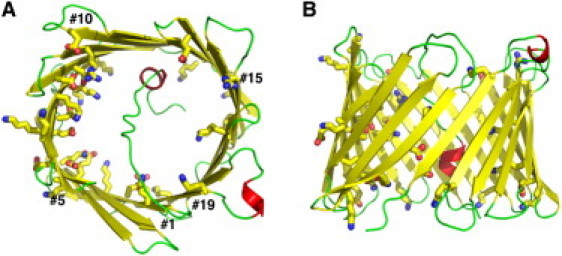
Molecular representation of hVDAC1 from the first NMR model (PDB:2K4T). Top view (A) and side view (B) showing α-helices (red), β-strands (yellow), and loops (green). Charged residues that line the channel wall are highlighted in stick representations. The figures were produced using the molecular visualization program PyMOL (46).
Before the atomic structures of VDACs were determined, models for ion selectivity and voltage dependence were primarily based on functional studies (18,19). It is now possible to examine the ion permeation at the atomic level. Based on the crystal structure of mouse VDAC1 (13) and continuum electrostatic calculations, Choudhary et al. (20) rationalized the anion selectivity of the wild-type channel by computing the free energy required to transfer different ion species from bulk solution into the channel. Since the calculations were performed on a static structure, structural dynamics, which may alter the electrophysiological properties of the channel, was not considered in computing the free energies. In addition, the free energies were calculated by placing a single ion along the pore axis, neglecting its lateral freedom as well as the effects from other ions. This work presents results from a total of 1.77 μs molecular dynamics (MD) simulations of hVDAC1 in DOPE/DOPC mixed bilayers bathed in 1 M KCl solution at TM potentials of 0, ±25, ±50, ±75, and ±100 mV. The results are discussed in terms of the channel stability and dynamics in membranes, its electrophysiological properties, ion diffusion constants inside the pore, and the molecular mechanisms underlying its anion selectivity.
Methods
Simulation of hVDAC1 in explicit membrane bilayers without TM potential
The structure of hVDAC1 was taken from the first model of the NMR structures (PDB:2K4T) (12) using the PDB Reader module in CHARMM-GUI (http://www.charmm-gui.org) (21) with a positively charged N-terminus and a negatively charged C-terminus. The channel was centered at z = 0 and reoriented to make its pore axis parallel to the membrane normal (i.e., the z axis). Both the N- and C-termini were placed in the lower half of the simulation cell with z < 0. To best resemble the lipid compositions used in the structure determination (12), a mixed lipid bilayer containing dioleoylphosphatidylethanolamine (DOPE), dioleoylphosphatidylcholine (DOPC), and cholesterol (22) was generated with a ratio of 40:40:1 (PE/PC/Chol) by CHARMM-GUI Membrane Builder (23). Both the top and bottom leaflets contain 81 lipid molecules, with the same lipid composition ratios. KCl (1.0 M) was also added to hydrate and neutralize the system (217 K+, 219 Cl−, and ∼12,500 waters), resulting in a simulation system of 88.9 × 88.9 × 85.7 Å3. To enhance sampling of hVDAC1 conformation and ion motions, three independent hVDAC1 systems, denoted S1_0, S2_0, and S3_0, were built, with total atom numbers of 63,749, 63,710, and 63,884, respectively; the suffix indicates that the applied voltage is 0. The number of water molecules is different in each system because the systems were generated independently by CHARMM-GUI Membrane Builder with lipid molecules of different conformations and positions. After 700 ps equilibration, each system was subjected to an initial 5-ns production. All the simulations were carried out in NPγT ensemble (i.e., constant pressure Pz = 1.0 atm along the z axis, surface tension γ = 20 dyn/cm (24), and temperature T = 303.15 K) using biomolecular simulation program CHARMM (25) with all-atom parameter set PARAM22 (26) including the dihedral cross-term corrections (CMAP) (27), C27r lipid parameters (28), and the modified TIP3P water model (29). Trajectories were generated with a 2-fs time step and bonds with hydrogen were constrained with the SHAKE algorithm. We used the same options for nonbonded interactions in the input scripts provided by the CHARMM-GUI Membrane Builder (23); the van der Waals interactions were smoothly switched off at 11−12 Å by a force-switching function (30) and the electrostatic interactions were calculated using the particle-mesh Ewald (PME) method with a mesh size of ∼1 Å for fast Fourier transformation, κ = 0.34 Å−1, and a sixth-order B-spline interpolation (31).
Simulation of hVDAC1 in explicit membrane bilayers with TM potentials
After 5 ns equilibration, nine different TM potentials (Vmp) ranging from −100 mV to 100 mV in 25-mV increments were applied to the three systems, resulting in a total of 27 systems; e.g., S2_n100 is originated from S2_0 with Vmp = −100 mV. For each system, a 65-ns MD trajectory was then generated in the NPγT ensemble with the same conditions described above. Applying TM potentials greatly enhances the sampling of ion crossing events and therefore increases the statistical significance of the calculated electrophysiological properties of the channel. Nevertheless, it should be stressed that because of the gap between the current simulation times (tens of nanoseconds) and the time required for the open-to-closed transition of the channel (seconds), the simulations with high TM potentials are unlikely to provide any gating information or to alter the channel's conductance and selectivity significantly. Nine different TM potentials are employed to improve the conformational sampling of hVDAC1 as well as to evaluate the channel's I/V characteristics at various TM potentials. Fig. S1 in the Supporting Material shows the last snapshots of system S1_n100, S2_0, and S3_p100.
Vmp was established by applying an external constant electric field across the membrane system (32), Vmp = V(z = −Lz/2) − V(z = Lz/2), where Lz is the system size in the z axis. The direction of the electric field was parallel to the membrane normal. To verify that Vmp was implemented correctly during the simulations, we calculated the electrostatic potential along the z axis, V(z), by solving Poisson's equation,
| (1) |
where denotes the system charge distribution along the z axis. The V(z) profiles and the potential differences across the bilayers in Fig. 2 and Fig. S2 validate the applied Vmp during the simulations.
Figure 2.
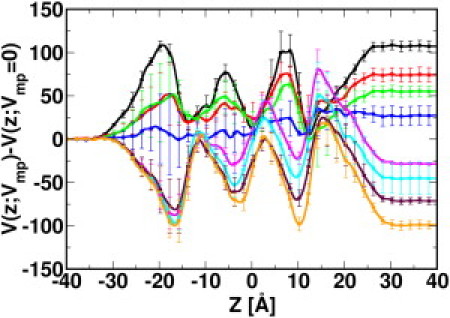
Average electrostatic potential profiles of the systems with Vmp = −100 (black), −75 (red), −50 (green), −25 (blue), 25 (magenta), 50 (cyan), 75 (maroon), and 100 mV (orange) along the z axis. The average electrostatic potential profile from the systems with Vmp = 0 is subtracted from the original V(z; Vmp) profiles (Fig. S2) to illustrate the influence of the applied electric field on the electrostatic potential throughout the simulation system. The established potentials, i.e., V(−40; Vmp) − V(40; Vmp), during the simulations are −104±4, −72±5, −53±4, −25±7, 31±1, 48±11, 74±2, and 102±3 mV for Vmp = −100, −75, −50, −25, 25, 50, 75, and 100 mV.
Results and Discussion
Structural stability and dynamics of the hVDAC1-membrane systems
The overall stability of hVDAC1 during the simulations with different Vmp was examined by the root-mean-square deviations (RMSDs) of the β-barrel backbone atoms. The RMSDs are averaged for the last 60 ns and plotted with standard deviations for all systems in Fig. 3 A. The averaged RMSDs are similar for different Vmp, ranging from 1.6±0.1 Å in system S2_p50 to 2.5±0.3 Å in system S1_n25. Although the overall RMSD is small, the β-barrel is flexible in some regions, especially the channel wall near the N-terminal α-helix (−4.0 Å ≤ z ≤ −2.0 Å). In particular, the changes of the xy cross section of the channel in this region suggest a large breathing motion; i.e., the ratios of the short and long axes (b/a) under different TM voltage conditions vary from 0.65 to 1.0 with an average of 0.88 (Fig. S3). The breathing motion is likely related to the dynamics of the N-terminal helix (residues 6–10), which is believed to play a key role in channel gating as a voltage sensor (6). In all the simulations, its center-of-mass position varied from −10.0 Å to 6.4 Å along the z axis (Fig. S4, A and B), whereas the hydrophobic interactions between Tyr7 and Leu10 in the α-helix and the pore lining residues Val143, Leu150, and Ala170 are well maintained (Fig. S4 C). It is interesting to note that the helix movement is biphasic; since the overall charge of the N-terminal region (residues 1–23) is positive, the helix moves toward the negative z direction when Vmp < 0, and vice versa.
Figure 3.
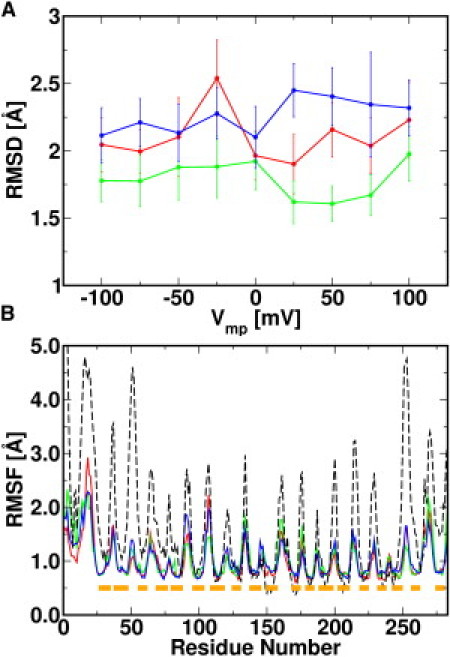
(A) Average backbone RMSD in all systems for the last 60 ns, with S1 (red), S2 (green), and S3 (blue). (B) Backbone RMSF for systems S1_n100 (red), S1_0 (green), and S1_p100 (blue), and from 20 NMR models (PDB:2K4T) (black dash). The RMSF of the NMR models was calculated with respect to the average NMR structure. The residue span of the β-strands is shown in boxes (orange).
Fig. 3 B plots the backbone root-mean-square fluctuations (RMSFs) of S1_n100, S1_0, and S1_p100 for the last 60 ns. Similar RMSFs are observed for systems with different Vmp, indicating minimal structural change upon the applied TM potentials on the simulation timescale described here. In each system, the RMSFs differ for residues residing in different secondary structures; as expected, they are smaller for residues in the channel wall (∼0.5 Å) than for those in loops or in termini (∼2.0 Å). The RMSFs calculated from the 20 NMR structure models (12) exhibit similar trends in the conformational flexibilities of different channel regions (Fig. 3 B, dashed lines). The loop/terminus RMSFs are larger in the NMR structure ensemble than in the MD simulations, because the paucity of NMR restraints in those regions leads to larger conformational uncertainties. Nonetheless, together with the similar trends in the RMSFs from MD and NMR, we show that the simulations, with and without TM potentials, maintain the channel stability with the integrity of its secondary structures and reasonable dynamics during the simulations. The generated trajectories can therefore be used to further analyze the electrophysiological properties and ion permeation mechanism of the channel.
Electrophysiological properties of hVDAC1 calculated from MD simulations
The electrophysiological properties of hVDAC1 are examined in terms of its conductance level and ion current ratio. The conductance (G) of hVDAC1 was calculated based on the accumulated ion crossing number (NK/Cl) for each ion type (Fig. S5) and Ohm's Law,
| (2) |
where is the total current and q is the charge of a monovalent ion. NK/Cl is either increased or decreased every 2 ps by the net number of ions that cross z = 0 in the positive direction of the z axis. With NK/Cl in a given time interval τ, one can estimate the average current carried by each ion using Eq. 2.
As shown in Fig. 4, the conductance values are similar in all systems, with an average at 4.8±0.2 nS except in S3_n75 (6.5 nS), S3_n50 (7.0 nS), and S3_p75 (2.8 nS). The noticeable deviation from the mean in these three systems arises from stochastic ion crossing events with limited simulation timescales. Nonetheless, the calculated conductance values agree well with experimental values of ∼3.9–4.5 nS in the same KCl concentration (6). In addition, the fact that the MD conductance is very similar to the conductance (4.9±0.6 nS) from longer-time Brownian dynamics (BD) simulations (33) supports the statistical reliability of the averaged MD conductance, even with the stochastic nature of ion crossing events with small Vmp and limited simulation timescales. The slightly higher value of the computed G compared to experimental values is partly associated with the low viscosity of the TIP3 water model (see below for more details) (34).
Figure 4.
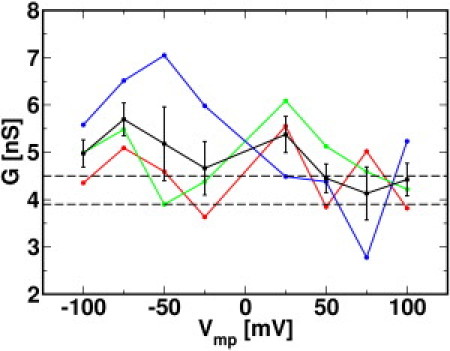
Conductance calculated from the last 60 ns in simulation sets S1 (red), S2 (green), and S3 (blue) as a function of applied voltage Vmp, with average conductance and standard error (black). The dashed lines indicate the range of experimental single-channel conductance.
Fig. 5 shows the total current () and the currents carried by K+ () and Cl− () as a function of applied voltage. Although the difference in current magnitudes is within the standard error at most voltages, there is a small asymmetry of the currents (and thus conductance) at positive and negative TM potentials (Table 1 and Table S1); a similar level of asymmetry was obtained in the BD simulations of hVDAC1 under the same conditions (33). Such conductance asymmetry was also observed in OmpF in E. coli (35,36). This suggests that hVDAC1 passes K+ ions more easily in the negative direction of the z axis, whereas the situation is reversed in the case of Cl−. The ion selectivity (ρ) can be estimated from the ratio between and as . Assuming the linearity of the I/V curve, ρ can be evaluated by the ratio of the slopes of individual ion currents. Using least-square linear regression, the calculated slopes of and are determined as 3.2 and 1.6, respectively, giving a ratio of 2.0±0.1. This ratio is in excellent agreement with the 2:1 anion-selective ratio estimated experimentally (6).
Figure 5.
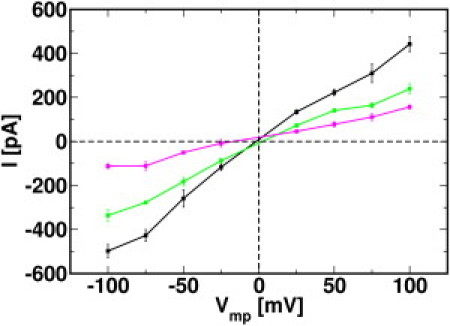
Current-voltage (I/V) relationship for the total (black), K+ (magenta), and Cl− (green) currents. The average current and standard error at each voltage point are calculated from three independent simulations.
Table 1.
Average currents among three replicates at various Vmp
| Vmp |
Itotal |
IK |
ICl |
|||
|---|---|---|---|---|---|---|
| –Vmp | +Vmp | –Vmp | +Vmp | –Vmp | +Vmp | |
| 100 | −498±35 | 442±42 | −132±17 | 166±10 | −366±26 | 275±33 |
| 75 | −427±32 | 310±52 | −138±14 | 126±25 | −289±20 | 183±32 |
| 50 | −259±48 | 223±19 | −56±17 | 88±14 | −203±31 | 134±5 |
| 25 | −117±17 | 134±12 | 13±17 | 53±4 | −104±5 | 82±12 |
Values (in pA) are shown as mean±SE.
Given the structural variability in the NMR model structures (Fig. 3 B and Fig. S3), it is reasonable to ask whether the electrophysiological properties calculated from MD simulations using only one model are biologically relevant and can be compared with experimental data. It is clear that the MD simulations described here do not sample the barrel conformations with the low b/a ratios (∼0.65) that exist in the NMR models. It would be computationally prohibitive to perform MD simulations with all NMR models and examine the influence of structural variance on channel transport properties. However, our coarse-grained BD simulation study with all NMR models (33) indicates that the transport properties of the model used in this MD simulation study closely represent those calculated from the ensemble of all the NMR models. Therefore, the ion transport properties from these MD simulations are meaningful and can be directly compared with experimental measurements.
Diffusion constants inside the hVDAC1 pore
An important determinant of the electrophysiological property of the channel is the position-dependent ion diffusion constant, D(z), inside the pore. Note that D(z) is an important input for coarse-grained BD or PNP (Poisson-Nernst-Planck) approaches to calculate electrophysiological properties of ion channels (35,36). The evaluation of D(z), however, is not straightforward, because the effects of systematic forces (e.g., ion-protein interactions) must be removed (37). Following Im and Roux (36), D(z) is obtained from the variance of a shifted Gaussian distribution along the z axis,
| (3) |
where , τ is a suitably small time interval (several picoseconds), and is the average z displacement of an ion per unit time τ arising from systematic forces. In free solution, = 0, and Eq. 3 reduces to the familiar Einstein relation (38).
Fig. 6 shows the averaged diffusion constant profiles along the z axis for both K+ and Cl− at Vmp = 0. The diffusion constants of K+ and Cl− at ±40 Å (bulk solution) are 0.30 Å2/ps and 0.29 Å2/ps, respectively. These values are independent of τ and ∼1.5 times larger than the experimental values in bulk solution, = 0.19 Å2/ps and = 0.2 Å2/ps, at 298.15 K (39). The discrepancy is the result of the different temperature (303.15 K) used in the simulations, the low viscosity of TIP3P water (34), and other errors in the potential energy function. As expected, the choice of τ modulates the calculated diffusion constants of both ion species inside the channel pore. With a small τ (e.g., τ = 1 ps), both ion types experience a 30% reduction of diffusion constant ( = 0.21 Å2/ps, = 0.21 Å2/ps), whereas the reduction is 50% ( = 0.15 Å2/ps, = 0.15 Å2/ps) when a larger time interval is used (e.g., τ = 4 ps). The diffusion constant calculated from the larger τ represents the mobility of ions in the pore region more precisely compared to the one calculated using a smaller τ. This is because the autocorrelation of an ion's velocity is nonzero in a small time interval. In other words, the velocity of an ion is dependent on its previous velocity (i.e., the system memory), and the evaluation of D(z) from Eq. 3 is biased (40). Proceeding according to the previous MD study of OmpF in E. coli (36), we determined the diffusion constants for K+ and Cl− in the VDAC pore with a time interval τ = 4 ps. The resulting diffusion profiles along the z axis can be used as inputs for BD or PNP calculations.
Figure 6.
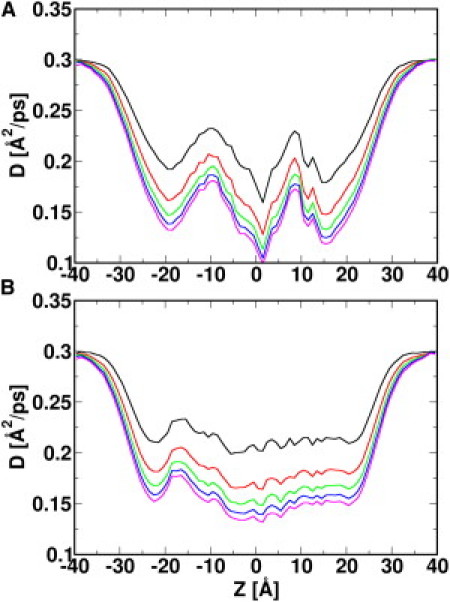
Diffusion constant profiles for K+ (A) and Cl− (B) along the z axis. The diffusion constant D(z) is calculated using different time intervals: τ = 1 ps (black), 2 ps (red), 3 ps (green), 4 ps (blue), and 5 ps (magenta). Using time intervals τ = 4 ps and τ = 5 ps, a 50% decrease of D is observed when ions move from the bulk region to the VDAC pore region.
Mechanisms of hVDAC1's anion selectivity
The good agreement between the calculated and experimental electrophysiological properties of hVDAC1 supports an investigation into the mechanisms underlying the anion selectivity of the channel. We approach the problem by examining the ion number density profile, ion hydration number profile, and the cross-sectional ion charge distribution along the z axis.
The number density profiles of both K+ and Cl− ions along the z axis averaged for three independent simulations with Vmp = 0 (S1_0, S2_0, and S3_0) are shown in Fig. S6 A. It is not surprising that the average density of Cl− inside the pore is higher than that of K+, consistent with the anion selectivity of the channel. We also calculated the average number of ions inside the pore by integrating the density over the pore region (−15.0 Å ≤ z ≤ 15.0 Å). Table 2 lists the resulting numbers of K+ and Cl− inside the channel pore and the ratios between them. The average ratio of 1.3 is 35% smaller than the average ratio of 2.0 calculated from the ion currents (Table 1). This implies that K+ ions stay in the channel longer than Cl−. These differences in crossing times of the two ion species appear to arise from the attractive interactions between K+ and the inner wall of the channel, as seen in the K+ density. In the middle of the channel, there is a region (−2.0 Å ≤ z ≤ 2.0 Å) with high K+ density, whereas the density sharply decreases when ions move from the middle to either end of the channel (−12.0 Å ≤ z ≤ −8.0 Å or 8.0 Å ≤ z ≤ 12.0 Å). This indicates that there are free-energy barriers for K+ ions near both openings of the channel, which prevent K+ from either entering or leaving the channel. In contrast, the density (and corresponding free-energy profile) for Cl− is much smoother, and thus, transport of Cl− ions across the channel is more rapid.
Table 2.
Average numbers of K+ and Cl− ions inside the pore and the nCl/nK ratios
| nK | nCl | nCl/nK | |
|---|---|---|---|
| n100 | 8.1±0.8 | 9.2±0.7 | 1.1±0.2 |
| n75 | 6.9±0.6 | 9.5±0.4 | 1.4±0.2 |
| n50 | 6.1±0.7 | 8.5±0.4 | 1.4±0.2 |
| n25 | 7.0±0.3 | 10.0±0.3 | 1.4±0.1 |
| 0 | 5.4±0.5 | 7.5±0.6 | 1.4±0.3 |
| p25 | 5.6±0.1 | 6.8±0.2 | 1.2±0.1 |
| p50 | 5.8±0.2 | 7.6±0.9 | 1.3±0.2 |
| p75 | 6.0±0.0 | 8.2±1.0 | 1.4±0.2 |
| p100 | 6.5±1.1 | 7.8±0.3 | 1.2± 0.3 |
Values are shown as the mean±SE.
The variation of K+ and Cl− density profiles correlates with the different hydration conditions for the ions along the pore axis. In channels with narrow passageways, like gramicidin A (41) and KscA (42), ions are desolvated upon entering into the channel or the selectivity filter, and then form favorable interactions with the channel, i.e., the channel provides the solvation partners. To examine such hydration effects in hVDAC1 with a much larger aqueous pore, we calculated the hydration number as a function of the ion's z-position. The total hydration number is further decomposed into the contributions from water molecules, counterions, and protein atoms (i.e., oxygen atoms for K+ and nitrogen atoms for Cl−). The hydration profiles for systems with Vmp = 0 are shown in Fig. S6, B and C. The total hydration numbers for both K+ (NK,total = 8.3±0.2) and Cl− (NCl,total = 8.0±0.1) at any position along the z axis inside the pore are similar. These numbers are also similar to the total hydration numbers of both ion species in the bulk KCl solution (NK,total = 8.3±0.0 and NCl,total = 8.4±0.1). Note that the protein hydration for K+ reaches its peak in the middle of the channel, where the highest K+ density is found. This indicates that the K+ ions are close to the channel wall, possibly as a result of specific attractive interactions. In contrast, protein hydration of Cl− is constant throughout the channel.
To determine the specific residues involved in ion hydration, the cross-sectional ion charge distributions were evaluated for three slabs along the pore axis: −8.0 Å ≤ z ≤ −4.0 Å; −2.0 Å ≤ z ≤ 2.0 Å; and 4.0 Å ≤ z ≤ 8.0 Å (Fig. S7, A–C, respectively). Note that the charge distributions result from the summation of both K+ and Cl−, so that zero density at a certain region reflects the fact that there are equal amounts of K+ and Cl− in the region. Near the openings of the channel (Fig. S7, A and C), the overall positive charge density (ρ+) is relatively small, with the maxima at 6.0 × 10⁻³ e/Å3 in slabs A and C. The major ρ+ are distributed in two zones on the xy plane. One is in the vicinity of the first five β-strands of hVDAC1, and the other is close to β-strands 11–14, which are on the opposite side of the channel wall (Fig. S7). Although ρ+ has a clear position preference, the negative charge density (ρ−) is distributed throughout the pore, with slightly higher values near the channel wall due to the protein-ion interactions. The scenario shifts in the middle of the channel (slab B), where concentrated positive charge is found. The maximum value of ρ+ reaches 1.7 × 10⁻² e/Å3, 4.3 times larger than the maximum ρ− in the slab and 2.8 times larger than the maximum ρ+ observed in slabs A and C. Further investigation indicates that this accumulation arises from attractive electrostatic interactions between K+ and negatively charged residues on the first five β-strands, especially Asp30 and Glu84. It is of interest that mutations of the corresponding residues, Asp30 to Lys and Lys84 to Glu, in VDAC1 from Saccharomyces cerevisiae increase and decrease the anion selectivity of the channel respectively (43). The present simulation studies of hVDAC1 show that these two residues form strong attractive interactions with K+, which make K+ permeation less effective. In contrast, Cl− ions pass the channel relatively freely, without strong interactions with residues on the channel wall. Consequently, hVDAC1 conducts more Cl− ions than K+ ions in a given time interval, resulting in the observed anion selectivity.
An alternative way of examining the selectivity mechanism is to characterize the pathway that each ion type takes to travel across the channel. In a wide channel pore containing multiple ions, an overlap of ion positions during the simulation offers information on the average pathways of ions. For this reason, we superimposed ion trajectories from the last 10 ns in system S1_n100 (Fig. 7). Although it is not quantitative, the superposition of ions demonstrates approximately the three-dimensional ion density inside the pore. From Fig. 7, there are three clusters of the most populated K+ ions: the first is near Asp30 on β-strand 1 toward the channel opening with z < 0; the second is near Glu84 on β-strand 5 in the middle of the channel; and the third is between Asn207 on β-strand 14 and Asp16. These clusters are consistent with the observed positive charge density in Fig. S7. There are no clearly defined paths for K+ and Cl− in hVDAC1, compared to the ones observed in the OmpF channel from E. coli (36). The hVDAC1 channel has an aqueous conducting pathway and transports both ion species. However, the pathway for K+ is more restricted than that of Cl−. K+ ions enter the channel from either side, but they cannot proceed directly as do Cl− ions, although the two have similar averaged diffusion constants inside the pore. Once the K+ ions are in the pore, they start to form attractive interactions with the aforementioned four residues. As a result, their effective diffusion is reduced. Alternatively, the passageway of Cl− ions is not as restricted. The majority of Cl− ions pass through the channel with minimal interactions with the protein, and therefore their effective diffusion is faster than that of the K+ ions. The difference in the effective diffusion rates of K+ and Cl− determines the anion-selective nature of the channel.
Figure 7.
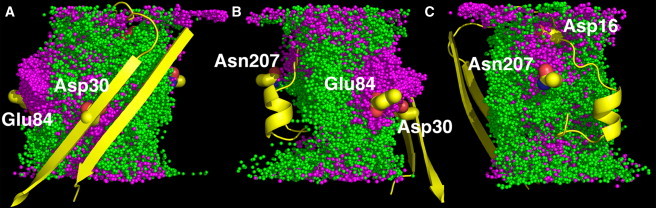
Overlay of ion trajectories for the last 10 ns of simulations in S1_n100. The trajectories are sampled every 10 ps, resulting in a superposition of 1000 snapshots. (A–C) Three different views by 120° rotation. K+ (magenta) and Cl− (green) are shown as spheres. To indicate the positions of involved residues, a reference segment (yellow) of the channel is also shown, including residues numbered 1 to 36 and 273 to 285. Important residues (yellow) such as Asp16, Asp30, Glu84, and Asn207 are presented in stick representation.
Although it is suggested that the channel's anion selectivity mainly arises from the net positive charges on the pore lining (6), the proposed mechanism in this study supplements rather than contradicts this prevailing view. Fig. 8 shows the one-dimensional multi-ion potential of mean force (PMF) (44), , for both K+ and Cl−, from their equilibrium distributions along the z axis, calculated using
| (4) |
where α is the ion type and Cref is set to the bulk concentration so that = 0 in the bulk solution. represents the mean potential acting on an ion along the channel axis, including contributions from protein-ion, ion-ion, and ion-solvent interactions and the volume-exclusion effect (i.e., variation in the ion-accessible cross-sectional area). As shown in Fig. 8, the free-energy barriers for Cl− at both entrances of VDAC are slightly lower than that for K+, probably due to the net positive charges of the pore. This limits K+ from entering the channel. In addition, the K+ PMF shows a free-energy well with a depth of 0.7 kcal/mol in the middle of the channel, a result of the attractive interactions between K+ and negatively charged residues including Asp30 and Glu84. Compared to the Cl− PMF, which is smooth inside the pore, such a free-energy well for K+ makes the K+ permeation slow. These two features of the K+ PMF are likely to be the origin of hVDAC1's mild anion selectivity. The spatial preference of both ion species inside the pore can also be illustrated by the two-dimensional multi-ion PMF maps along the pore axis (Fig. S8). Both the observation of homogeneous Cl− PMF throughout the pore and the existence of potential wells for K+ in the middle of the channel further corroborate the proposed selectivity mechanism. As mentioned above, such ion distribution and thus the multi-ion PMFs are largely dictated by electrostatic interactions between ions and the charged residues on the channel wall; the importance of electrostatic interactions underlying the VDAC anion selectivity is also illustrated by the electrostatic potential maps along the pore axis (Fig. S9), calculated from the Poisson-Boltzmann continuum electrostatics (45).
Figure 8.
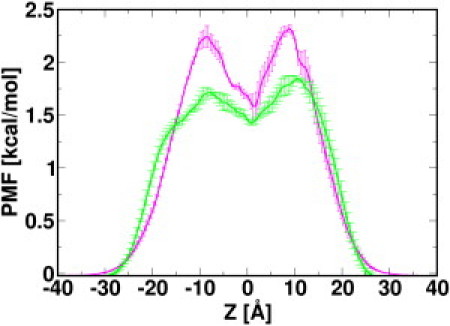
The averaged one-dimensional multi-ion PMF for K+ (magenta) and Cl− (green), calculated from simulations at zero TM potential.
Summary and Conclusions
To investigate the ion permeation and selectivity of hVDAC1 and its underlying mechanisms, we have performed sets of three independent all-atom MD simulations of hVDAC1 embedded in DOPE/DOPC/cholesterol mixed membrane bilayers at TM potentials of 0, ±25, ±50, ±75, and ±100 mV. We generated a total of 1.77-μs trajectories and analyzed them to elucidate channel stability, electrophysiological properties, ion diffusion constants inside the channel pore, and a possible ion selectivity mechanism.
The overall hVDAC1 structure remained stable in each simulation, as corroborated by its backbone RMSD and RMSF (Fig. 3, A and B). The qualitative agreement between the RMSFs calculated from different structural information (i.e., the NMR models and the MD trajectories) illustrates adequate sampling of hVDAC1 conformations.
The good stability and sampling of hVDAC1 allows for the evaluation of important properties of the channel with acceptable accuracy. The channel conductance, ion current ratio, and ion diffusion constant can be readily calculated. The conductance and ion current ratio of hVDAC1 are in good agreement with experimental measurements, revealing a functional channel with a conductance level around 4.8 nS and an approximate 2:1 selectivity between Cl− and K+ (Figs. 4 and 5). Position-dependent ion diffusion constants (Fig. 6) were obtained from a shifted Gaussian distribution (Eq. 3.) to separate stochastic and systematic forces. These diffusion constants can be used in BD or PNP calculations for rapid evaluations of the channel electrophysiological properties.
Based on the calculated ion density profile, ion hydration profile, cross-sectional ion charge density distributions, and position-dependent diffusion constants, we propose a possible mechanism for ion permeation and selectivity of hVDAC1. In this mechanism, both ion species can travel across the channel. The determinant of the channel's anion selectivity is the transport efficiency of different ions. Cl− is transported more efficiently than its counterions, which are slowed down by attractive ion-protein interactions in the middle of the pore. Residues involved in K+-protein interactions are Asp16, Asp30, Glu84, and Asn207 (Fig. S6, Fig. S7, and Fig. 7). Mutation studies also suggest the importance of Asp16, Asp30, and Glu84 in yeast VDAC anion selectivity (43). These residues appear to serve as traps for K+ ions as they pass through the middle of the channel. It is such specific K+-protein interactions that increase the average time K+ ions spend in the pore. Together with the higher free-energy barrier for K+ to enter the channel (Fig. 8), the K+-protein attractive interactions result in the difference in ion transport rate for K+ and Cl− and determine the anion selectivity of hVDAC1.
Acknowledgments
This work was supported in part by institutional funding from the University of Kansas, including J. R. and Inez Jay funds, the National Institutes of Health (R01-GM092950), the National Science Foundation (NSF OCI-0503992) through TeraGrid resources provided by Purdue University (to W.I.), and the Intramural Research Program of the National Institutes of Health, National Heart, Lung, and Blood Institute (to R.W.P.).
Supporting Material
References
- 1.Hodge T., Colombini M. Regulation of metabolite flux through voltage-gating of VDAC channels. J. Membr. Biol. 1997;157:271–279. doi: 10.1007/s002329900235. [DOI] [PubMed] [Google Scholar]
- 2.Lindén M., Gellerfors P., Nelson B.D. Pore protein and the hexokinase-binding protein from the outer membrane of rat liver mitochondria are identical. FEBS Lett. 1982;141:189–192. doi: 10.1016/0014-5793(82)80044-6. [DOI] [PubMed] [Google Scholar]
- 3.Shimizu S., Narita M., Tsujimoto Y. Bcl-2 family proteins regulate the release of apoptogenic cytochrome c by the mitochondrial channel VDAC. Nature. 1999;399:483–487. doi: 10.1038/20959. [DOI] [PubMed] [Google Scholar]
- 4.Decker W.K., Bowles K.R., Craigen W.J. Revised fine mapping of the human voltage-dependent anion channel loci by radiation hybrid analysis. Mamm. Genome. 1999;10:1041–1042. doi: 10.1007/s003359901158. [DOI] [PubMed] [Google Scholar]
- 5.Sampson M.J., Decker W.K., Craigen W.J. Immotile sperm and infertility in mice lacking mitochondrial voltage-dependent anion channel type 3. J. Biol. Chem. 2001;276:39206–39212. doi: 10.1074/jbc.M104724200. [DOI] [PubMed] [Google Scholar]
- 6.Colombini M. Voltage gating in the mitochondrial channel, VDAC. J. Membr. Biol. 1989;111:103–111. doi: 10.1007/BF01871775. [DOI] [PubMed] [Google Scholar]
- 7.Colombini M. Purification of VDAC (voltage-dependent anion-selective channel) from rat liver mitochondria. J. Membr. Biol. 1983;74:115–121. doi: 10.1007/BF01870500. [DOI] [PubMed] [Google Scholar]
- 8.Roos N., Benz R., Brdiczka D. Identification and characterization of the pore-forming protein in the outer membrane of rat liver mitochondria. Biochim. Biophys. Acta. 1982;686:204–214. doi: 10.1016/0005-2736(82)90114-6. [DOI] [PubMed] [Google Scholar]
- 9.Petit P.X., O'Connor J.E., Brown S.C. Analysis of the membrane potential of rat- and mouse-liver mitochondria by flow cytometry and possible applications. Eur. J. Biochem. 1990;194:389–397. doi: 10.1111/j.1432-1033.1990.tb15632.x. [DOI] [PubMed] [Google Scholar]
- 10.Blachly-Dyson E., Zambronicz E.B., Forte M. Cloning and functional expression in yeast of two human isoforms of the outer mitochondrial membrane channel, the voltage-dependent anion channel. J. Biol. Chem. 1993;268:1835–1841. [PubMed] [Google Scholar]
- 11.Mannella C.A., Forte M., Colombini M. Toward the molecular structure of the mitochondrial channel, VDAC. J. Bioenerg. Biomembr. 1992;24:7–19. doi: 10.1007/BF00769525. [DOI] [PubMed] [Google Scholar]
- 12.Hiller S., Garces R.G., Wagner G. Solution structure of the integral human membrane protein VDAC-1 in detergent micelles. Science. 2008;321:1206–1210. doi: 10.1126/science.1161302. [DOI] [PMC free article] [PubMed] [Google Scholar]
- 13.Ujwal R., Cascio D., Abramson J. The crystal structure of mouse VDAC1 at 2.3 Å resolution reveals mechanistic insights into metabolite gating. Proc. Natl. Acad. Sci. USA. 2008;105:17742–17747. doi: 10.1073/pnas.0809634105. [DOI] [PMC free article] [PubMed] [Google Scholar]
- 14.Bayrhuber M., Meins T., Zeth K. Structure of the human voltage-dependent anion channel. Proc. Natl. Acad. Sci. USA. 2008;105:15370–15375. doi: 10.1073/pnas.0808115105. [DOI] [PMC free article] [PubMed] [Google Scholar]
- 15.De Pinto V., Prezioso G., Palmieri F. Peptide-specific antibodies and proteases as probes of the transmembrane topology of the bovine heart mitochondrial porin. Biochemistry. 1991;30:10191–10200. doi: 10.1021/bi00106a017. [DOI] [PubMed] [Google Scholar]
- 16.McDonald B.M., Wydro M.M., Lakey J.H. Probing the orientation of yeast VDAC1 in vivo. FEBS Lett. 2009;583:739–742. doi: 10.1016/j.febslet.2009.01.039. [DOI] [PubMed] [Google Scholar]
- 17.Stanley S., Dias J.A., Mannella C.A. Peptide-specific antibodies as probes of the topography of the voltage-gated channel in the mitochondrial outer membrane of Neurospora crassa. J. Biol. Chem. 1995;270:16694–16700. doi: 10.1074/jbc.270.28.16694. [DOI] [PubMed] [Google Scholar]
- 18.Mannella C.A. Structural analysis of mitochondrial pores. Experientia. 1990;46:137–145. doi: 10.1007/BF02027309. [DOI] [PubMed] [Google Scholar]
- 19.Zizi M., Thomas L., Colombini M. Oriented channel insertion reveals the motion of a transmembrane β strand during voltage gating of VDAC. J. Membr. Biol. 1995;144:121–129. doi: 10.1007/BF00232798. [DOI] [PubMed] [Google Scholar]
- 20.Choudhary O.P., Ujwal R., Grabe M. The electrostatics of VDAC: implications for selectivity and gating. J. Mol. Biol. 2010;396:580–592. doi: 10.1016/j.jmb.2009.12.006. [DOI] [PMC free article] [PubMed] [Google Scholar]
- 21.Jo S., Kim T., Im W. CHARMM-GUI: a web-based graphical user interface for CHARMM. J. Comput. Chem. 2008;29:1859–1865. doi: 10.1002/jcc.20945. [DOI] [PubMed] [Google Scholar]
- 22.Rostovtseva T.K., Kazemi N., Bezrukov S.M. Voltage gating of VDAC is regulated by nonlamellar lipids of mitochondrial membranes. J. Biol. Chem. 2006;281:37496–37506. doi: 10.1074/jbc.M602548200. [DOI] [PubMed] [Google Scholar]
- 23.Jo S., Lim J.B., Im W. CHARMM-GUI Membrane Builder for mixed bilayers and its application to yeast membranes. Biophys. J. 2009;97:50–58. doi: 10.1016/j.bpj.2009.04.013. [DOI] [PMC free article] [PubMed] [Google Scholar]
- 24.Rui H., Im W. Protegrin-1 orientation and physicochemical properties in membrane bilayers studied by potential of mean force calculations. J. Comput. Chem. 2010;31:2859–2867. doi: 10.1002/jcc.21580. [DOI] [PubMed] [Google Scholar]
- 25.Brooks B.R., Brooks C.L., 3rd, Karplus M. CHARMM: the biomolecular simulation program. J. Comput. Chem. 2009;30:1545–1614. doi: 10.1002/jcc.21287. [DOI] [PMC free article] [PubMed] [Google Scholar]
- 26.MacKerell A.D., Bashford D., Karplus M. All-atom empirical potential for molecular modeling and dynamics studies of proteins. J. Phys. Chem. B. 1998;102:3586–3616. doi: 10.1021/jp973084f. [DOI] [PubMed] [Google Scholar]
- 27.MacKerell A.D., Jr., Feig M., Brooks C.L., 3rd Improved treatment of the protein backbone in empirical force fields. J. Am. Chem. Soc. 2004;126:698–699. doi: 10.1021/ja036959e. [DOI] [PubMed] [Google Scholar]
- 28.Klauda J.B., Brooks B.R., Pastor R.W. An ab initio study on the torsional surface of alkanes and its effect on molecular simulations of alkanes and a DPPC bilayer. J. Phys. Chem. B. 2005;109:5300–5311. doi: 10.1021/jp0468096. [DOI] [PubMed] [Google Scholar]
- 29.Durell S.R., Brooks B.R., Bennaim A. Solvent-induced forces between two hydrophilic groups. J. Phys. Chem. 1994;98:2198–2202. [Google Scholar]
- 30.Steinbach P.J., Brooks B.R. New spherical-cutoff methods for long-range forces in macromolecular simulation. J. Comput. Chem. 1994;15:667–683. [Google Scholar]
- 31.Essmann U., Perera L., Pedersen L.G. A smooth particle mesh Ewald potential. J. Chem. Phys. 1995;103:8577–8592. [Google Scholar]
- 32.Roux B. The membrane potential and its representation by a constant electric field in computer simulations. Biophys. J. 2008;95:4205–4216. doi: 10.1529/biophysj.108.136499. [DOI] [PMC free article] [PubMed] [Google Scholar]
- 33.Lee, K. I., H. Rui, …, W. Im. 2010. Brownian dynamics simulations of ion transport through VDAC. 100:. [DOI] [PMC free article] [PubMed]
- 34.Feller S.E., Pastor R.W., Brooks B.R. Effect of electrostatic force truncation on interfacial and transport properties of water. J. Phys. Chem. 1996;100:17011–17020. [Google Scholar]
- 35.Im W., Roux B. Ion permeation and selectivity of OmpF porin: a theoretical study based on molecular dynamics, Brownian dynamics, and continuum electrodiffusion theory. J. Mol. Biol. 2002;322:851–869. doi: 10.1016/s0022-2836(02)00778-7. [DOI] [PubMed] [Google Scholar]
- 36.Im W., Roux B. Ions and counterions in a biological channel: a molecular dynamics simulation of OmpF porin from Escherichia coli in an explicit membrane with 1 M KCl aqueous salt solution. J. Mol. Biol. 2002;319:1177–1197. doi: 10.1016/S0022-2836(02)00380-7. [DOI] [PubMed] [Google Scholar]
- 37.Roux B., Karplus M. Ion-transport in a gramicidin-like channel—dynamics and mobility. J. Phys. Chem. 1991;95:4856–4868. [Google Scholar]
- 38.Einstein A. Dover Publications; New York: 1926. Investigation on the Theory of Brownian Movement. [Google Scholar]
- 39.Lobo V.M.M., Ribeiro A.C.F., Verissimo L.M.P. Diffusion coefficients in aqueous solutions of potassium chloride at high and low concentrations. J. Mol. Liq. 1998;78:139–149. [Google Scholar]
- 40.Lyubartsev A.P., Laaksonen A. Concentration effects in aqueous NaCl solutions. A molecular dynamics simulation. J. Phys. Chem. 1996;100:16410–16418. [Google Scholar]
- 41.Andersen O.S., Koeppe R.E., 2nd Molecular determinants of channel function. Physiol. Rev. 1992;72(4, Suppl):S89–S158. doi: 10.1152/physrev.1992.72.suppl_4.S89. [DOI] [PubMed] [Google Scholar]
- 42.Roux B., MacKinnon R. The cavity and pore helices in the KcsA K+ channel: electrostatic stabilization of monovalent cations. Science. 1999;285:100–102. doi: 10.1126/science.285.5424.100. [DOI] [PubMed] [Google Scholar]
- 43.Blachly-Dyson E., Peng S.Z., Forte M. Selectivity changes in site-directed mutants of the VDAC ion channel: structural implications. Science. 1990;247:1233–1236. doi: 10.1126/science.1690454. [DOI] [PubMed] [Google Scholar]
- 44.Egwolf B., Luo Y., Roux B. Ion selectivity of α-hemolysin with β-cyclodextrin adapter. II. Multi-ion effects studied with grand canonical Monte Carlo/Brownian dynamics simulations. J. Phys. Chem. B. 2010;114:2901–2909. doi: 10.1021/jp906791b. [DOI] [PMC free article] [PubMed] [Google Scholar]
- 45.Jo S., Vargyas M., Im W. PBEQ-Solver for online visualization of electrostatic potential of biomolecules. Nucleic Acids Res. 2008;36(Web Server issue):W270–W275. doi: 10.1093/nar/gkn314. [DOI] [PMC free article] [PubMed] [Google Scholar]
- 46.DeLano W.L. DeLano Scientific; Palo Alto, CA: 2002. The PyMOL Molecular Graphics System. [Google Scholar]
Associated Data
This section collects any data citations, data availability statements, or supplementary materials included in this article.