Abstract
Fluid dynamic analysis of turbodynamic blood pumps (TBPs) is often conducted under steady flow conditions. However, the preponderance of clinical applications for ventricular assistance involves unsteady, pulsatile flow—due to the residual contractility of the native heart. This study was undertaken to demonstrate the importance of pulsatility and the associated time derivative of the flow rate (dQ/dt) on hemodynamics within a clinical-scale TBP. This was accomplished by performing flow visualization studies on a transparent model of a centrifugal TBP interposed within a cardiovascular simulator with controllable heart rate and stroke volume. Particle image velocimetry triggered to both the rotation angle of the impeller and phase of the cardiac cycle was used to quantify the velocity field in the outlet volute and in between the impeller blades for 16 phases of the cardiac cycle. Comparison of the unsteady flow fields to corresponding steady conditions at the same (instantaneous) flow rates revealed marked differences. In particular, deceleration of flow was found to promote separation within the outlet diffuser, while acceleration served to stabilize the velocity field. The notable differences between the acceleration and deceleration phases illustrated the prominence of inertial fluid forces. These studies emphasize the importance of dQ/dt as an independent variable for thorough preclinical validation of TBPs intended for use as a ventricular assist device.
Keywords: Particle image velocimetry, Turbodynamic blood pump, Levacor, Triggering, Heart simulator, Pulsatile pump flow
Fluid dynamic design and optimization of turbo-dynamic blood pumps (TBPs) aim to minimize conditions in which blood is exposed to high shear for long periods and regions where blood can stagnate (1–5). Both computer simulations (6–9) and flow visualization (10–13) have become contemporary tools for evaluating and optimizing TBP designs. The details of a steady flow field can be predicted relatively quickly with computational fluid dynamics (CFD), but inadequate turbulence models and hemorheological models limit the accuracy of the predicted flow fields. The experimental counterpart of CFD, flow visualization, is likewise limited by various assumptions and approximations—due to time, cost, and actual physical restrictions. Particle image velocimetry (PIV), the most popular quantitative method, is time intensive, and therefore almost invariably performed under steady conditions. Although such experiments provide valuable information, they do not adequately represent the unsteady conditions commonly experienced in clinical use. Specifically, the contractility of the native ventricle commonly imparts a time-varying modulation of flow rate through the TBP (14). In turn, the inertial contribution to the flow field cannot be neglected. The purpose of this study was therefore to evaluate the importance of pulsatile flow upon the flow field within a TBP and thereby illustrate the importance of time-varying simulations and experiments for realistic evaluation of the associated hemodynamics.
METHODS
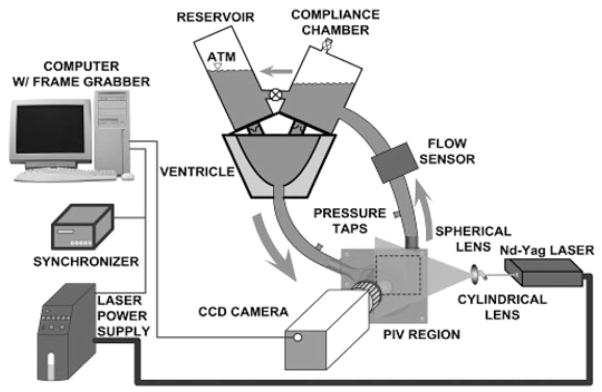
Flow visualization studies were performed using a transparent replica of a magnetically levitated centrifugal blood pump (Levacor VAD, WorldHeart Corp., Oakland, CA, USA) interposed to a cardiovascular simulator circuit (see Fig. 1). The housings, impeller, inlet, and outlet of the pump model were fabricated of acrylic to permit optical access to the fluid path. The impeller of the flow visualization unit was supported by conventional bearings and actuated through a drive shaft by a brushed DC motor (ServoDisc, PMI Motion Technologies, Commack, NY, USA), which was controlled by a servo-amplifier (Accelus, Copley Controls Corp., Canton, MA, USA). The cardiac simulator consisted of a closed fluid circuit with an actuated flexible silicone axi-symmetric sac representing the left ventricle (LV). The volume variations of the LV were achieved by suspending it in a rigid water-filled chamber connected to a cam-operated servo-controlled piston pump. Preload to the mock LV was provided by an atrial reservoir. The afterload consisted of a hydropneumatic accumulator followed by a ball-valve to reproduce systemic compliance and resistance, respectively. The atrial reservoir and aortic compliance chamber were mounted on top of the ventricular chamber and were interconnected by bovine pericardial bileaflet valves acting as mitral and aortic valves, respectively. The working fluid was a glycerol and water mixture (35/65 v/o) titrated to a viscosity of 3.5 cP and a density of 1.08 g/mL at room temperature to simulate the asymptotic rheological properties of blood.
FIG. 1.
Schematic of the flow loop setup with PIV system.
Particle image velocimetry was performed with a double-pulsed Nd-YAG laser (532 nm wavelength, NewWave, Fremont, CA, USA), and a high sensitivity CCD digital camera (SensiCam, PCO Imaging, Kelheim, Germany) with resolution of 1376 × 1040 pixels (Fig. 1). The working fluid was seeded with neutrally buoyant fluorescent polymer particles (Duke Scientific Corp., Palo Alto, CA, USA) with mean diameter of 7 μm. The laser beam was routed through a glass cylinder (5 mm diameter) and a spherical lens (30 cm focal length) to form a light sheet with 0.5 mm thickness, which was aligned by mirrors to illuminate the region of measurement, which contains two sub-regions of interest: the blade-to-blade region of the spinning impeller and the outflow volute of the TBP housing.
Particle image velocimetry-derived velocity fields were obtained from multiple (165) image pairs that were acquired for each setpoint, evaluated with an FFT-based cross-correlation method (PIVPROC, NASA), and phase averaged. The image acquisition within the impeller regions was synchronized to the position of the impeller to repeatedly expose the blade-to-blade region at the same angle, which was necessary for the phase averaging. For pulsatile flow imaging, a unique gated trigger system was developed that synchronized the laser and camera with both the impeller position and the phase of the cardiac cycle, thereby yielding true dynamic PIV results. A total of 16 cardiac phases were imaged, providing a representative sampling of hemodynamics throughout the cardiac cycle.
Pressures within the mock LV, aorta, pump inlet and outlet were measured with clinical grade transducers (TruWave, Edwards Lifesciences, Irvine, CA, USA) connected to standard patient monitors (Data-scope 870, Datascope Corp., Paramus, NJ, USA). Transit-time flow meters were used for TBP and aorta flow (ME13PXN with TS410 meter and H16C probe with HT107 meter, respectively, Transonic Systems, Inc., Ithaca, NY, USA). Instantaneous LV volume was measured with a LVDT sensor mounted on the piston pump shaft. This latter signal was also used for determining the phase of the cardiac cycle, used to trigger the acquisition of images. The hemo-dynamic time-varying signals were recorded on a personal computer at 1000 Hz with Simulink software (The MathWorks, Natick, MA, USA) equipped with a Quanser AD/DA board (Multi-Q, Quanser Consulting, Inc., Markham, Ontario, Canada).
The steady state velocity fields were measured using a simplified, closed fluid circuit containing a reservoir and a Hoffman clamp for providing after-load, adjusted incrementally to provide measurements at multiple flow rates.
RESULTS
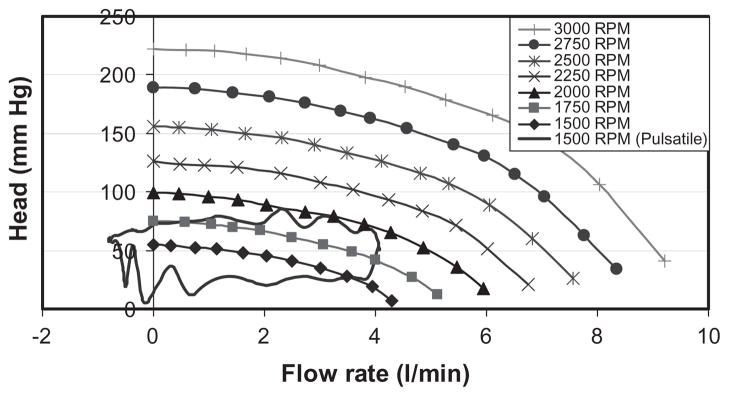
Steady state pilot experiments were performed to characterize the pressure head-flow relationship of the pump at various pump speeds from 1500 rpm to 3000 rpm (Fig. 2).
FIG. 2.
Hydrodynamic characteristics of the experimental pump used in these studies.
Ten pulsatile conditions with different combinations of impeller speed, stroke volume, and heart rate were evaluated, as summarized in Table 1. For brevity, the detailed results of one pulsatile condition (nominal, representing severe heart failure) are presented below. The associated hemodynamics (pump flow, aortic pressure, pump head, LV pressure, and LV volume) are presented in Fig. 3. The corresponding pressure-flow diagram for this operating condition is also indicated in Fig. 2, where it is noted that a single line under steady conditions is replaced by a closed loop under pulsatile conditions.
TABLE 1.
Experimental conditions studied
| Condition | Impeller speed (rpm) | Stroke volume (mL) | Heart rate (bpm) |
|---|---|---|---|
| Nominal | 1500 | 37.5 | 120 |
| Steady | 1500 | 0 | n/a |
| Other | 1500, 2250, 3000 | 37.5, 50, 60 | 60, 90, 120 |
FIG. 3.
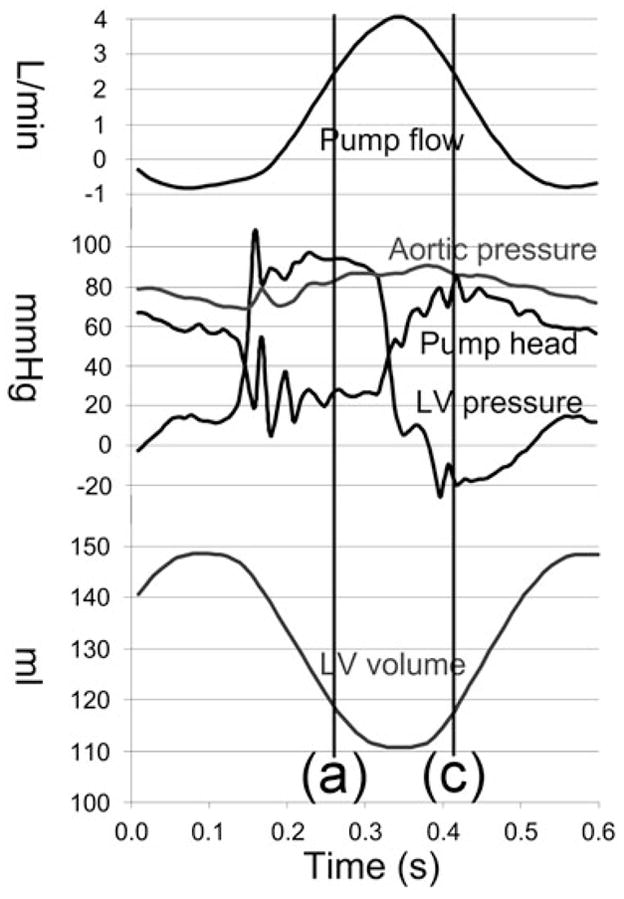
Hemodynamic data corresponding to the nominal pulsatile condition.
Particle image velocimetry results
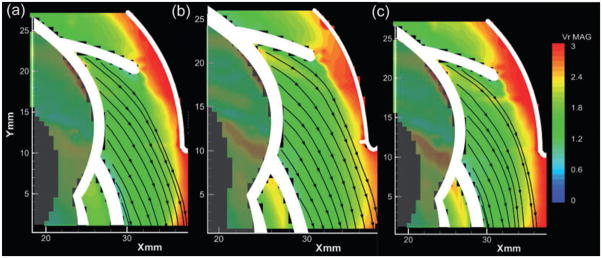
To evaluate the influence of pulsatility, the velocity fields in the outlet diffuser of steady state and pulsatile conditions were compared at the same flow rate (2.5 L/min) but different flow accelerations (dQ/dt). Figure 4 provides the velocity field (colored according to velocity magnitude) within the outlet diffuser of the pump for three values of acceleration, 35 mL/min/s, 0, and −35 mL/min/s. The positive acceleration corresponded to left ventriclular systole, the negative acceleration to diastole, and the nonaccelerating flow to the steady state condition. Without loss of generality, the velocity fields within the pump outlet were observed to be well aligned and attached during the accelerating (systolic) phases of the cardiac cycle (Fig. 4a). By comparison, the corresponding flow field for the steady state condition (dQ/dt = 0) exhibited an asymmetric velocity profile, skewed to the outer side of the diffuser, although not separated. The flow field during the diastolic, deceleration portions of the pulsatile flow conditions were fully separated (Fig. 4c).
FIG. 4.
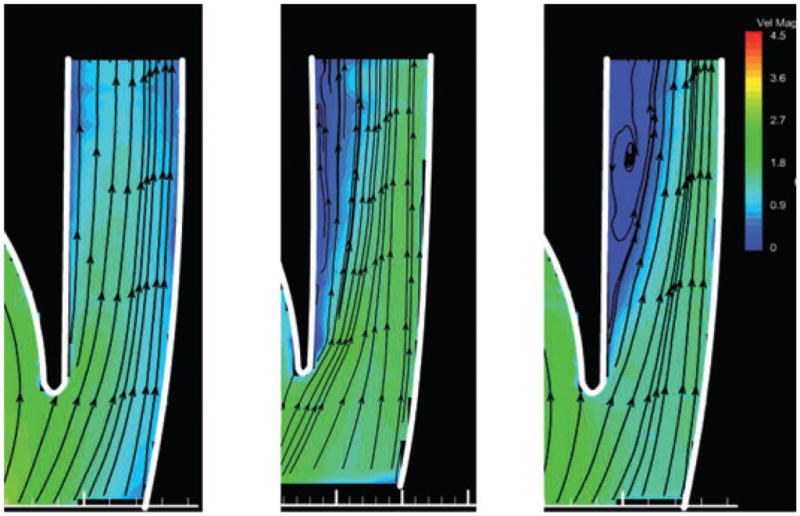
Velocity fields within the outlet diffuser at 1500 rpm and 2.5 L/min. Panel (b) corresponds to the velocity field at steady state condition; panels (a) and (c) show pulsatile flow corresponding to line (a) and (c) in Fig. 3 with the same instantaneous flow as (b), but with flow acceleration of +35 and −35 L/(min·s), respectively.
The velocity fields acquired within the blade-blade region was post processed by subtracting the impeller rotation velocity (ω→ × r→) to visualize the velocity field in the relative (impeller) frame of reference. The flow fields corresponding to the same conditions as Fig. 4 are provided in Fig. 5. Well-attached flow was observed for all three conditions, indicating that the influence of pulsatility within the blade-blade region under these specific conditions is not as pronounced as in the outlet region.
FIG. 5.
Relative velocity fields within the blade-blade region. Conditions (a), (b), and (c) are the same as described in Fig. 4.
Similar results were observed for other pulsatile conditions. In general, the flow field within the pump at a given impeller speed was found to be determined by both the flow rate and its first time derivative (flow acceleration). Decelerating flow promotes the occurrence of flow separation within the outlet diffuser, while accelerating flow stabilized the velocity field. For high-pulsatile flow, recirculation was also observed within the blade-blade region (which is not shown in this article).
During LV diastole, flow through the pump is considerably low and flow recirculation could occur within the blade-blade region. Flow deceleration only slightly promotes the occurrence of this recirculation. This is easy to understand: the time scale within the blade-blade region (1/ω ) is much less than the time scale of the pulsatility (60/HR), therefore the flow within the blade-blade region is quasi-steady.
DISCUSSION
Knowledge of the detailed hemodynamics within a blood-wetted device is an important consideration for estimating biocompatibility. Coupled with models of blood trauma and deposition, the characteristic velocity vector fields can estimate the risk of hemolysis and thrombosis. In service, the hemodynamics within these devices is not constant, but variable on three primary time scales. Over the course of minutes to hours, the volumetric flow rate may vary; accordingly it is necessary to consider multiple operating points. Within the time frame of one cardiac cycle, the unsteadiness of the flow, hence the inertial terms in the equations of motion become relevant. This is illustrated by the dramatic deviation of the time-varying pressure-flow trajectory from the quasi-static H-Q characteristics of a given TBP (see Fig. 2). The third and shortest relevant time scale relates to small fluctuations arising from turbulence, which is beyond the scope of this report.
The studies reported herein illustrate that the unsteady flow fields in a turbodynamic blood pump at a given time are the impeller speed (ω ), the instantaneous flow rate (Q), and the time derivative of the flow rate (dQ/dt). Pressure is not an independent determinant of the flow field as it is uniquely determined by these other two variables through the fluid dynamic physics. (The same is not necessarily true for a pulsatile pump, in which the pressure field would influence the motion of the boundaries, and vice versa.)
In the current series of experiments, the effect of acceleration was more pronounced in the outlet diffuser versus the impeller. This is understandable in terms of the relative time scale within these regions. Time scale within the blade-blade region (1/ω ) is much less than the time scale of the pulsatility (60/HR), therefore the flow within the blade-blade region is more like quasi-steady. Although these experiments did not explicitly visualize the flow in the other regions of the pump, such as the inlet volute, exit volute scroll, or back clearances, it is reasonable to anticipate similar results based on this argument.
Computational fluid dynamics is a valuable tool for quantitatively examining the minute details of the flow fields within these devices. However, unsteady flows are highly computationally intensive, and prohibitively so in some cases. Understandably, the preponderance of simulations reported previously is limited to steady flow.
Similarly, previous flow visualization studies with TBPs have been primarily focused on steady flow conditions due to the complexity of both the experimental setup and the analysis of data. This may be appropriate for some applications of TBPs, such as cardiopulmonary bypass, in which the flow is relatively constant. However, when used as ventricular assist devices, the contribution of the native ventricle may introduce significant modulation to the volumetric flow, which according to the results from this study, are not properly represented by steady state conditions.
Although it would be impossible to simulate all of the possible combinations of preload, and afterload, heart rate, stroke volume, contractility, arterial compliance, inertance, etc. it is likely that the flow fields may be classified, or categorized, according to the three independent variables identified above: ω, Q, and dQ/dt. By so collapsing the experimental variables, it should be possible to incorporate pulsatile flow conditions into the design validation without prohibitive cost.
Our findings are also important for in vivo evaluation of TBPs, more specifically for animal model selection. If a device intended for pediatric use is tested in a large animal, the different cannulation approach will change the system inertia, which in combination with the much lower heart rate may yield combinations of Q and dQ/dt that are outside of the range that the device would be exposed to in clinical practice. Consequently, a model mismatch may yield biocompatibility data with lower predictive power.
CONCLUSION
We have experimentally demonstrated that the time derivative of flow is a very important determinant of the flow field in artificial organs and a big difference was found between fluid acceleration and deceleration. Consequently, results obtained with a steady flow approximation of nonsteady flow phenomena may be incorrect in some regions and could lead to wrong conclusions. Previously reported CFD and flow visualization studies discussing TBPs should be reviewed with care if steady or quasi-pulsatile conditions were used.
Acknowledgments
The authors acknowledge Worldheart, Inc. for providing the transparent pump and supporting the research.
Footnotes
Presented in part at the 16th Congress of the International Society for Rotary Blood Pumps held Oct. 2–4, 2008 in Houston, TX, USA.
References
- 1.Ramstack J, Zuckerman L, Mockros L. Shear induced activation of platelets. J Biomech. 1979;12:113–25. doi: 10.1016/0021-9290(79)90150-7. [DOI] [PubMed] [Google Scholar]
- 2.Anderson GH, Hellums JD, Moake JL, Alfrey CP., Jr Platelet lysis and aggregation in shear fields. Blood Cells. 1978;4:499–511. [PubMed] [Google Scholar]
- 3.Yeleswarapu KK, Antaki JF, Kameneva MV, Rajagopal KR. A mathematical model for shear-induced hemolysis. Artif Organs. 1995;19:576–82. doi: 10.1111/j.1525-1594.1995.tb02384.x. [DOI] [PubMed] [Google Scholar]
- 4.Mohandas J, Hochmuth R, Spaeth E. Adhesion of red cells to foreign surfaces in the presence of flow. J Biomed Mater Res. 1974;8:119–36. doi: 10.1002/jbm.820080203. [DOI] [PubMed] [Google Scholar]
- 5.Ferrans V, Boyce S, Billingham M, Jones M, Ishihara T, Roberts W. Calcific deposits in porcine bioprosthesis: structure and pathogenesis. Am J Cardiol. 1980;46:721–34. doi: 10.1016/0002-9149(80)90421-x. [DOI] [PubMed] [Google Scholar]
- 6.Burgreen G, Antaki JF. CFD-Based Design Optimization of a Three-Dimensional Rotary Blood Pumps. Bellevue, WA. Proc 6th Symp on Multidisciplinary Analysis and Optimization; 1996. [Google Scholar]
- 7.Burgreen GW, Antaki JF, Wu ZJ, Holmes AJ. Computational fluid dynamics as a development tool for rotary blood pumps. Artif Organs. 2001;25:336–40. doi: 10.1046/j.1525-1594.2001.025005336.x. [DOI] [PubMed] [Google Scholar]
- 8.Arvand A, Hahn N, Hormes M, Akdis M, Martin M, Reul H. Comparison of hydraulic and hemolytic properties of different impeller designs of an implantable rotary blood pump by computational fluid dynamics. Artif Organs. 2004;28:892–8. doi: 10.1111/j.1525-1594.2004.07379.x. [DOI] [PubMed] [Google Scholar]
- 9.Wu J, Antaki JF, Wagner WR, Snyder TA, Paden BE, Borovetz HS. Elimination of adverse leakage flow in a miniature pediatric centrifugal blood pump by computational fluid dynamics-based design optimization. ASAIO J. 2005;51:636–43. doi: 10.1097/01.mat.0000178966.79876.3d. [DOI] [PubMed] [Google Scholar]
- 10.Wu ZJ, Antaki JF, Burgreen GW, Butler KC, Thomas DC, Griffith BP. Fluid dynamic characterization of operating conditions for continuous flow blood pumps. ASAIO J. 1999;45:442–9. doi: 10.1097/00002480-199909000-00015. [DOI] [PubMed] [Google Scholar]
- 11.Wu ZJ, Gottlieb RK, Burgreen GB, et al. Investigation of fluid dynamics within a miniature mixed flow blood pump. Exp Fluids. 2001;31:615–29. [Google Scholar]
- 12.Day SW, McDaniel JC. PIV measurements of flow in a centrifugal blood pump: time-varying flow. J Biomed Eng. 2005;127:254–63. doi: 10.1115/1.1865190. [DOI] [PubMed] [Google Scholar]
- 13.Day SW, McDaniel JC. PIV measurements of flow in a centrifugal blood pump: steady flow. J Biomed Eng. 2005;127:244–53. doi: 10.1115/1.1865189. [DOI] [PubMed] [Google Scholar]
- 14.Amin DV, Antaki JF, Litwak P, et al. Controller for an axial-flow blood pump. Biomed Instrum Technol. 1997;31:483–7. [PubMed] [Google Scholar]


