Abstract
The purpose of this study was to prospectively compare noninvasive, quantitative measures of vascularity obtained from 4 contrast enhanced ultrasound (US) techniques to 4 invasive immunohistochemical markers of tumor angiogenesis in a large group of murine xenografts. Glioma (C6) or breast cancer (NMU) cells were implanted in 144 rats. The contrast agent Optison (GE Healthcare, Princeton, NJ) was injected in a tail vein (dose: 0.4ml/kg). Power Doppler imaging (PDI), pulse-subtraction harmonic imaging (PSHI), flash-echo imaging (FEI), and Microflow imaging (MFI; a technique creating maximum intensity projection images over time) was performed with an Aplio scanner (Toshiba America Medical Systems, Tustin, CA) and a 7.5 MHz linear array. Fractional tumor neovascularity was calculated from digital clips of contrast US, while the relative area stained was calculated from specimens. Results were compared using a factorial, repeated measures ANOVA, linear regression and z-tests. The tortuous morphology of tumor neovessels was visualized better with MFI than with the other US modes. Cell line, implantation method and contrast US imaging technique were significant parameters in the ANOVA model (p<0.05). The strongest correlation determined by linear regression in the C6 model was between PSHI and percent area stained with CD31 (r=0.37, p<0.0001). In the NMU model the strongest correlation was between FEI and COX-2 (r=0.46, p<0.0001). There were no statistically significant differences between correlations obtained with the various US methods (p>0.05). In conclusion, the largest study of contrast US of murine xenografts to date has been conducted and quantitative contrast enhanced US measures of tumor neovascularity in glioma and breast cancer xenograft models appear to provide a noninvasive marker for angiogenesis; although the best method for monitoring angiogenesis was not conclusively established.
Keywords: Ultrasound contrast agent, glioma, breast cancer, tumor angiogenesis, maximum intensity projection imaging, murine xenografts
1. Introduction
The purpose of this study was to prospectively compare noninvasive, quantitative measures of vascularity obtained from different contrast enhanced ultrasound imaging (US) modes to invasive immunohistochemical measures of tumor angiogenesis in a large group of murine xenografts. Angiogenesis is the development of new blood vessels from pre-existing vessels and, while a normal physiological process, it has also been recognized as an essential component in the progression of solid tumors [1–3]. Tumor angiogenesis is a prerequisite for masses growing beyond 1–2 mm3 and is also a key factor of metastasis by allowing the ingrowth of vessels into a tumor, thus providing a pathway for systemic dissemination of cancer cells via the blood or lymph system [1–4]. Consequently, tumor angiogenesis is a very important target for therapeutics as well as imaging [3–6].
US is an ideal modality for assessing both structural and functional features of tumor angiogenesis by measuring tumor flow and vascular volume over time; especially when combined with microbubble-based US contrast agents. Such agents produce 15 to 25 dB increases in the echo intensities of blood flow signals, thus, markedly improving the sensitivity of US flow imaging [5–8]. Conventional Doppler imaging techniques cannot visualize vessel smaller than approximately 100 µm [7–8]. However, results from our group indicate that contrast enhanced US signals, obtained in a typical clinical setting (i.e., breast imaging at 7.5 MHz) and converted to a quantitative parameter, correspond mainly to vessels 20 to 39 µm in diameter [9] and, therefore, provides a better assessment of the extent of angiogenesis. The feasibility of monitoring tumor angiogenesis with contrast enhanced US has been studied most extensively in murine xenograft models (e.g., [10–25]). However, these studies typically involved a single imaging mode in a limited number of animals (less than 40), and there is therefore a need to compare the capabilities of various contrast US techniques in a larger cohort of animals.
Flash replenishment techniques have been shown to increase the enhancement provided by US contrast agents and can be used to estimate flow parameters, such as perfusion [6–7,10–12]. In order to visualize the tortuous morphology of tumor angiogenesis in greater detail, the combination of flash-replenishment and maximum intensity projection (MIP) techniques were recently proposed [25–29]. Following a bubble destruction pulse (or pulses) the MIP technique selects maximum pixel values throughout consecutive, low power grayscale images (typically < 50 kPa) as the bubbles replenish the imaging plane (typically depicting the contrast in harmonic mode). A composite image showing the vascular architecture is constructed and displayed. Such MIP techniques are now making their way in to human clinical applications (breast, prostate and liver; [26–29]), but have yet to be directly compared to more established nonlinear contrast imaging techniques in xenograft models.
2. Materials and Methods
The two tumor lines chosen for this study, C6 glioma and NMU mammary gland adenocarcinoma (common brain and breast tumor cell lines, respectively), were obtained from American Type Culture Collection (ATCC, Manassas, VA). The glial cell strain, C6, was cloned from a rat glial tumor induced by the carcinogen N-nitrosomethylurea by Brenda and colleagues [30] after a series of alternate culture and animal passages. NMU was derived from a tumor that arose in a Sprague Dawley rat that had been injected in the tail vein with N-nitrosomethylurea [31]. These cell lines were selected, because they are able to upregulate intracellular pH to near normal levels and, therefore, have a higher likelihood of remaining viable under the adverse (low pH) conditions that are typical of the tumor microenvironment [32–33]. Cells in such an environment are the most stimulatory in terms of inducing tumor angiogenesis. The C6 tumor cell line was cultured in Ham’s F-12 media (Media Inc., Herndon, VA) and the NMU tumor cell line was cultured in Eagle’s Minimum Essential medium alpha modification (alpha MEM; Sigma-Aldrich Co., St. Louis, MO). Both cell lines were cultured in an incubator at 37 ° C with a 5 % CO2 in air atmosphere.
Female, outbred, albino Sprague Dawley rats (Taconic Inc., Hudson, NY), weighing between 200 and 250 g, were injected subcutaneously with approximately 2 × 10⁶ tumor cells from either the C6 or the NMU cell line into the abdomen or a thigh. Contrast enhanced US evaluation of the tumors were performed 6, 8 or 10 days after tumor inoculation, since our prior studies indicate that these time points ensured enough difference in tumor volume and tumor vasculature for effectively monitoring the progression of angiogenesis [25]. Twelve (12) rats were included in each group for a total of 144 rats (2 tumor cell lines × 2 implantation areas × 3 time points × 12 rats per group). The animal studies were carried out in an ethical and humane fashion under supervision of a veterinarian, and Thomas Jefferson University’s Institutional Animal Care and Use Committee approved all protocols. It should be noted, that while this project was supported in part by GE Healthcare and by Toshiba America Medical Systems, the authors of this article had sole control of the data generated.
2.1 Acquisition of US and Pathology Data
For the imaging studies the rats were anesthetized and a lateral tail vein catheterized using a 24-gauge needle. The US contrast agent Optison (GE Healthcare, Princeton, NJ) was injected (dose: 0.4 ml/kg). Optison is approved for use in echocardiography by the United States Food and Drug Administration and consists of a suspension of perfluoropropane-filled human albumin microspheres [34]. The average bubble diameter is 3.0 to 4.5 µm with 95 % of the microbubble suspension being less than 10 µm (permitting the bubbles to pass through the lung capillaries). A total of four injections of contrast were administered per rat (i.e., one for each contrast US imaging mode studied). The time between injections was 3 to 5 min to allow the agent to clear the blood pool.
Contrast enhanced US imaging was performed with an Aplio scanner (Toshiba America Medical Systems, Tustin, CA) and a 7.5 MHz linear array transducer (PLT-704AT). US coupling gel was liberally applied on the tumor site thereby creating a standoff pad to minimize pressure on the tumor from the ensuing placement of the transducer. The tumors of all rats were initially imaged in conventional B-mode (grayscale) and their width, depth and height were measured. The transducer was then positioned, by the sonographer, to image the largest transverse cross section for each individual tumor, and this imaging plane was held constant for subsequent contrast specific US imaging techniques. Power Doppler imaging (PDI) was performed first (at PRFs between 20.7 and 25.3 kHz), followed by grayscale, pulse-subtraction harmonic imaging (PSHI). The latter is a form of pulse inversion imaging, which cancels first harmonic (and other odd) signals by transmitting a pulse sequence where each pulse is an inverted copy of the previous pulse, and then summing the returned echoes (resulting in zero for linear scattering) [35–36]. Hence, echoes from stationary tissue will be suppressed. However, nonlinear echoes associated with contrast microbubbles will not cancel out and, thus, can be preferentially detected and displayed [35–36].
Then images from two flash replenishment techniques - Flash Echo Imaging (FEI) and Microflow Imaging (MFI) - were acquired. The former is a particular combination of regular and intermittent harmonic grayscale imaging techniques [37], consisting of low power monitor pulses (with a mechanical index or MI ≤ 0.2) transmitted continuously, while bubble destruction is achieved with intermittent high power (MI > 1.3) flash pulses (in these experiments 4 flash pulses every 5 s). The MI was established to predict the likelihood of transient cavitation resulting from diagnostic US fields, and is defined as the peak pressure (in MPa) divided by the square root of the center frequency (in MHz) [38]. The MI is intended to assist users in limiting the potential for mechanical bioeffects when exposing patients to US fields. In spite of not being particularly suitable for predicting contrast microbubble destruction [39], the MI is nonetheless the de facto indicator of field strength used by clinicians in US contrast examinations. Likewise, MFI is a flash-replenishment technique where 5 high power flash pulses are used to destroy bubbles followed by 6 s of low power pulses demonstrating contrast replenishment. A composite image depicting vascular architecture and blood flow is then constructed through MIP capture of temporal data in consecutive low power images [25–29]. All imaging parameters were kept constant before and after contrast administration (in particular an MI < 0.4 to limit bubble destruction) and 35 s digital clips were stored for each US contrast injection.
Upon completion of the US study, rats were euthanized by placing them in a gas chamber and saturating the air with CO2. Tumors were surgically removed and scanned ex vivo to identify the US imaging plane studied in vivo. Careful attention was paid to the labeling of each specimen by specimen-ink marking the true front, back, right and left [9]. Then specimens were placed in 10 % formalin phosphate (Fisher Scientific, Houston, TX) for 12 to 24 hours to fix all angiogenic markers, dehydrated in graded alcohols, cleaned in xylene, and embedded in paraffin using standard methods. The process of angiogenesis involves the activation, migration, and proliferation of endothelial cells [1–3]. Vascular endothelial growth factor (VEGF) is regarded as a major regulator of tumor-associated angiogenesis, since it promotes tumor growth, invasion, and metastasis [2–3,40–41]. Cyclooxygenase-2 (COX-2) is another positive regulator of angiogenesis, which is expressed in response to growth factors, tumor promoters, or cytokines [42–43]. Platelet endothelial cell adhesion molecule (PECAM or CD31) is a potent endothelial cell marker, since its expression is restricted to vascular system platelets and endothelium [44]. Each specimen was immunohistochemical stained using a polyclonal antibody against basic fibroblast growth factor (bFGF; Santa Cruz Biotechnology, Santa Cruz, CA), a monoclonal antibody against PECAM (anti-CD31; Dako Corporation, Carpinteria, CA), a polyclonal antibody against COX-2 (Santa Cruz Biotechnology, Santa Cruz, CA), and a monoclonal antibody against VEGF (Oncogene Research Products, San Diego, CA) as reference standards. Finally, the sections were mounted onto glass slides for analysis. For the convenience of the reader a list of acronyms is provided in the Appendix.
2.2 Image Analysis
A semi-automated histomorphometry system incorporating a DXC-970MD color CCD camera (Sony Corporation, Tokyo, Japan) connected to an SMZ-10A microscope (Nikon, Melville, NJ, USA) was used to analyze both US images and specimens. Moreover, data from the same animal were analyzed on separate occasions at least 6 weeks apart to reduce or eliminate operator bias. The histomorphometry system employed a 4× objective and 10× ocular magnification (total magnification: 40×) to provide a digital view of each histological slide on a desktop computer [9]. Area measurements of stains and flow relative to the total tumor area were obtained using ImagePro Plus software (Media Cybernetics, Silver Spring, MD). Briefly, the tumor was manually outlined on the images and the RGB channels used to automatically segment and count the number of color or stained pixels as well as the total number of pixels within 3 mm regions of interest (ROI) covering the lesion [9,14,25,45]. Fractional tumor vascularity (FV) was calculated (in percent) as the number of color pixels (ci) relative to the total number of pixels (ci + xi) within each ROI [9–10,13–14]:
| (1) |
Given the heterogenic nature of tumor vasculature [2–3,25] small 3 mm ROIs were chosen to more accurately align the ultrasound and immunohistochemical results (instead of averaging over the entire tumor area).
2.3 Statistical Analysis
Data were analyzed on a per rat as well as a per ROI basis. This study was designed as a 4 × 2 × 2 factorial repeated measures ANOVA over groups of animals, since there were 4 US imaging techniques being evaluated in 2 tumor cell lines using 2 implantation methods (i.e., the independent variables). Each of these factors was then assessed at three different time points (the repeated measures) with p-values less than 0.05 considered significant. The median value of the FV measurements was calculated as the result for each tumor and the dependent variable in the ANOVA. Least squares linear regression analysis was also performed to compare the US measures of FV (the key quantitative parameter) and the histologically derived stained markers of angiogenesis on a per ROI basis using Stata 9.0 (Stata Corporation, College Station, TX, USA) and determine correlation coefficients (r-values). To examine differences among the highest significant correlations obtained between contrast US techniques and histological markers, the r-values were converted to z-scores, according to [46]:
| (2) |
Differences were then tested with a Fischer z-test [46] for each of the groups (i.e., for each cell line, implantation technique and imaging method).
3. Results
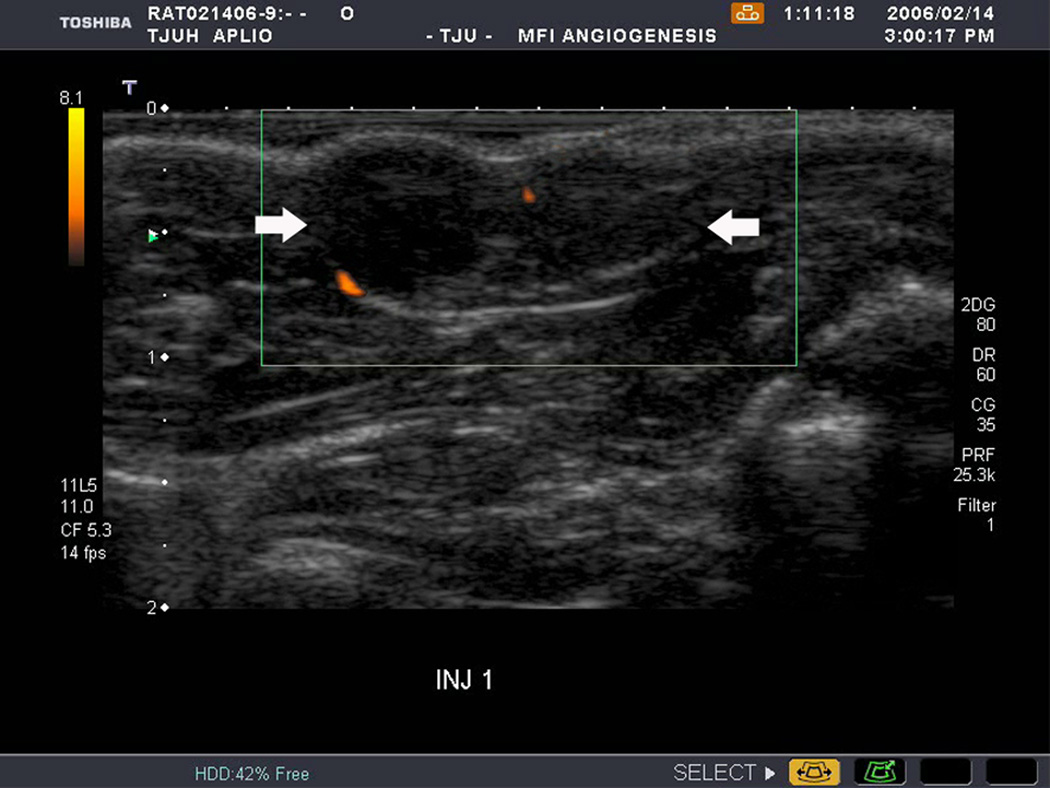
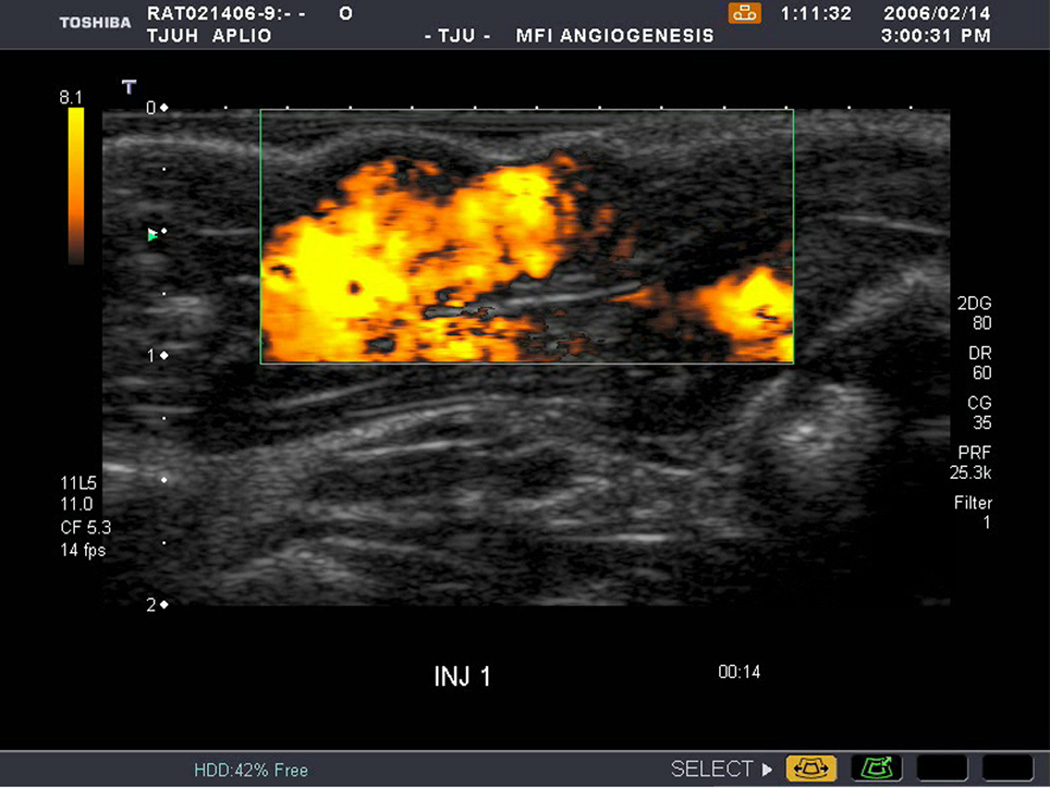
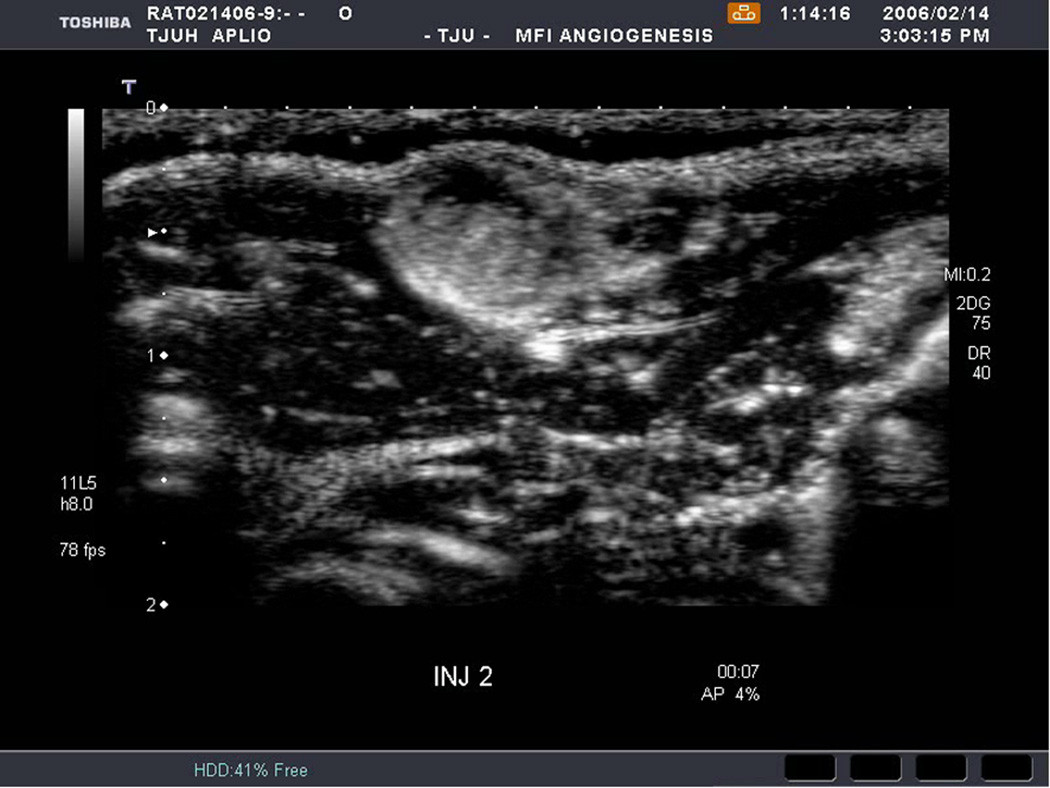
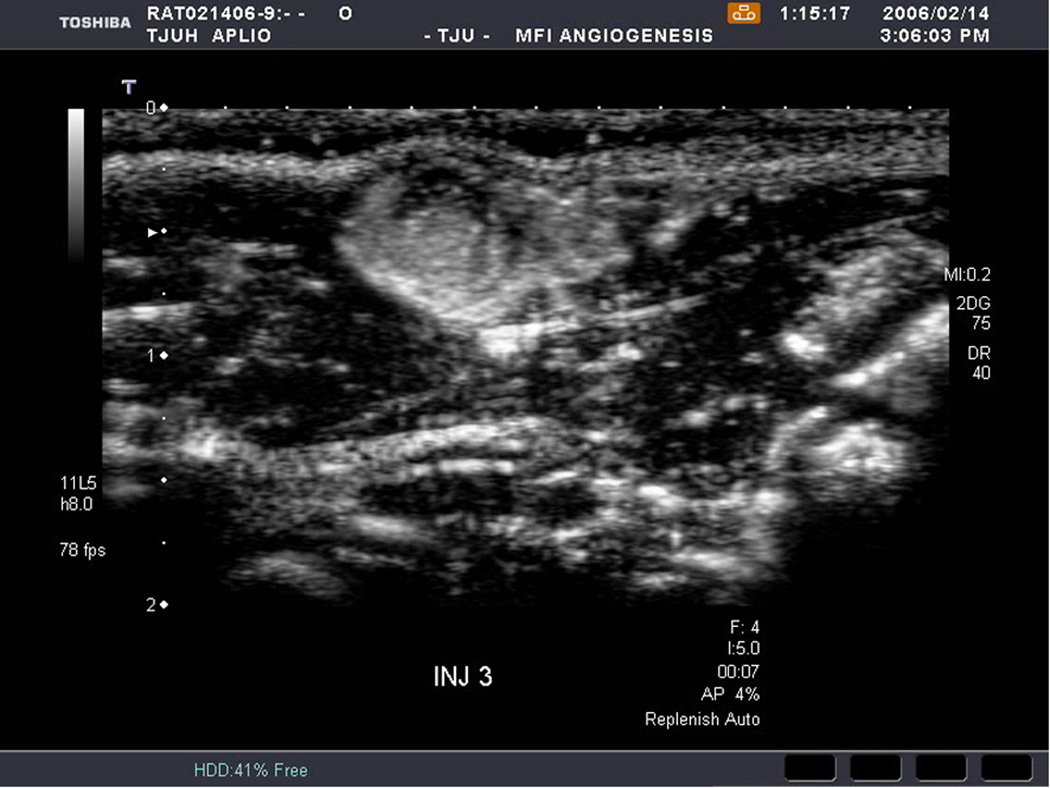
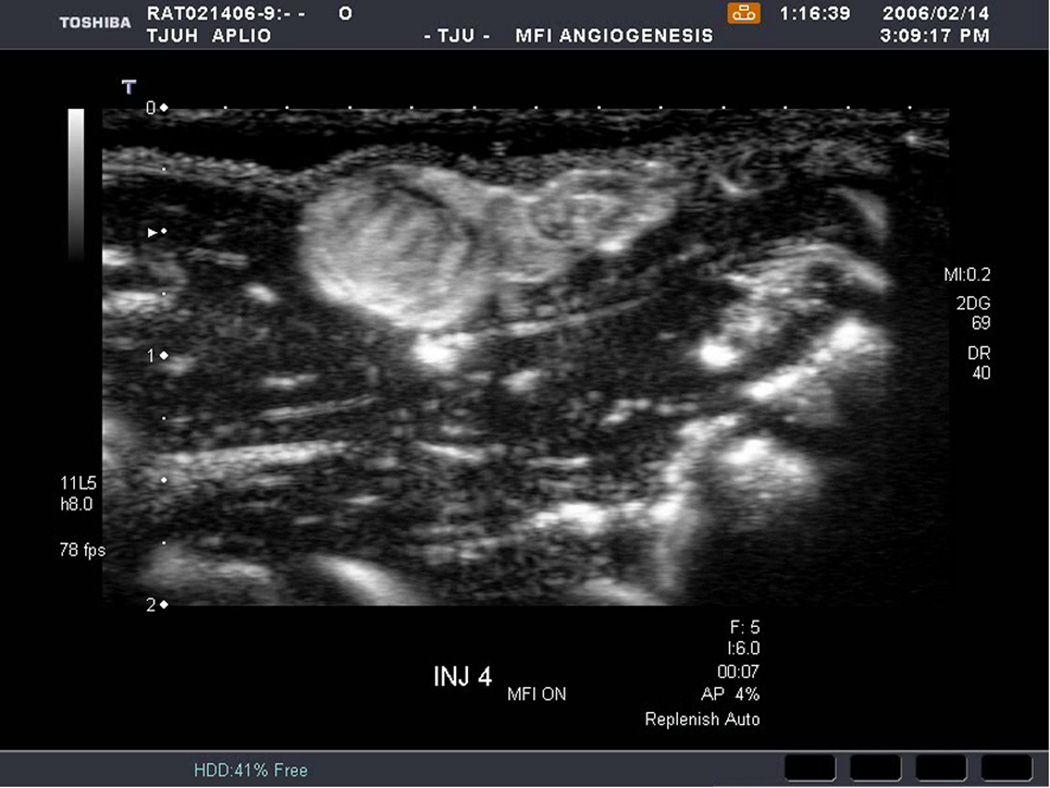
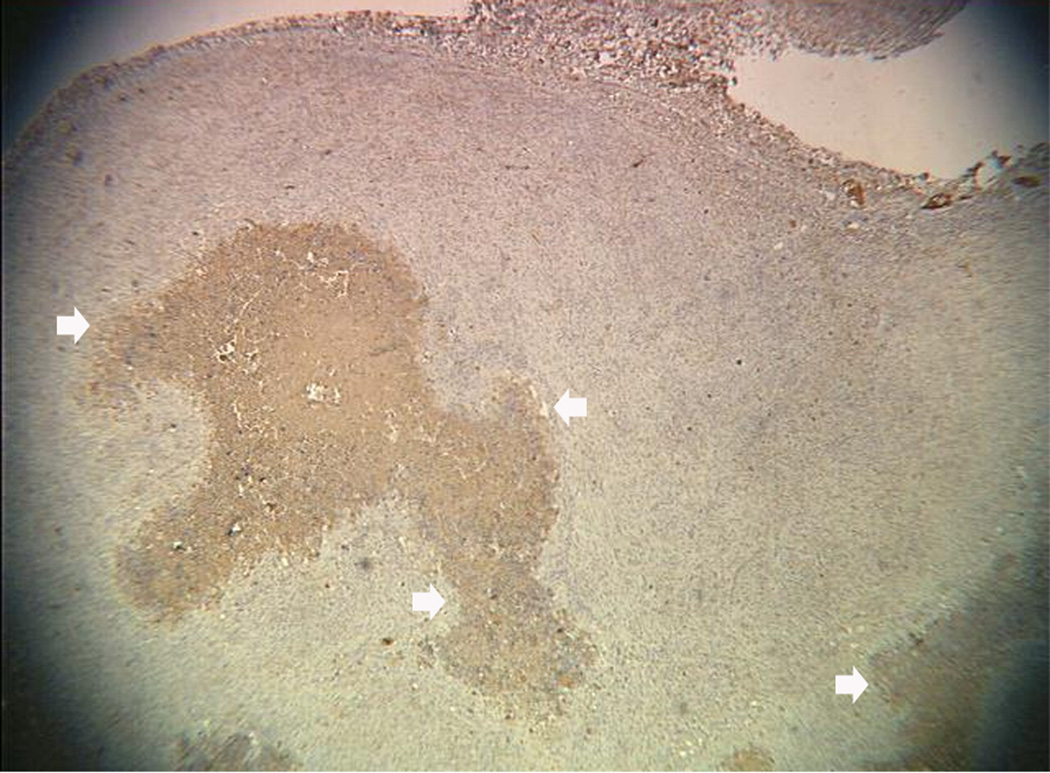
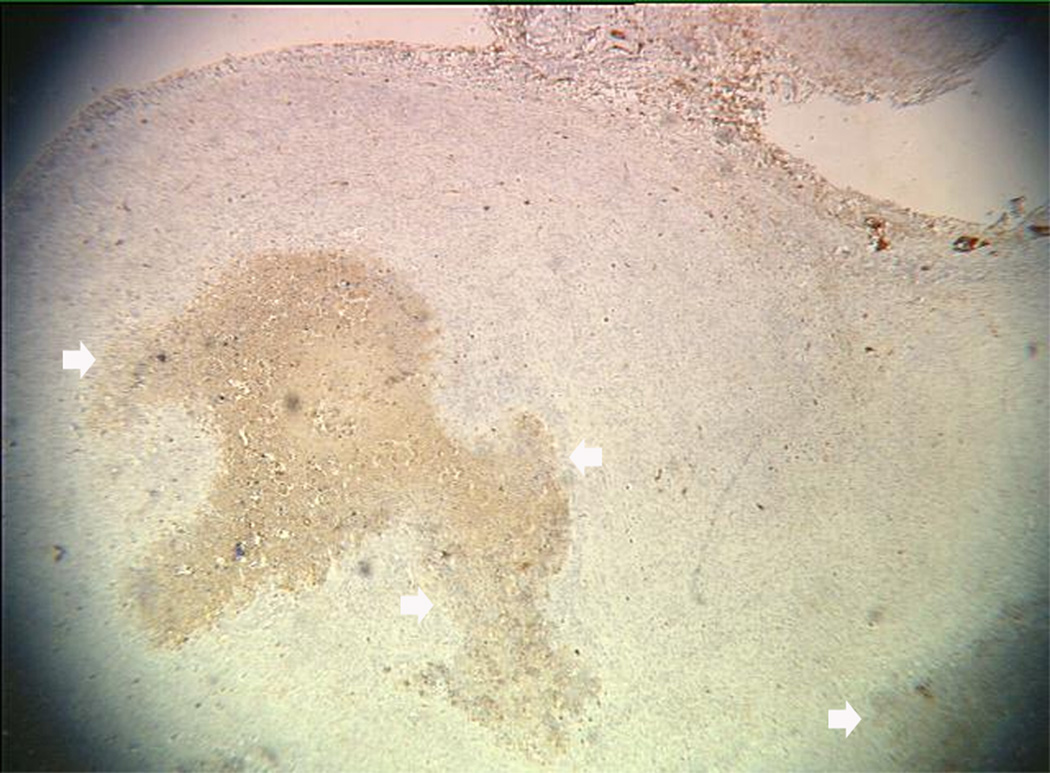
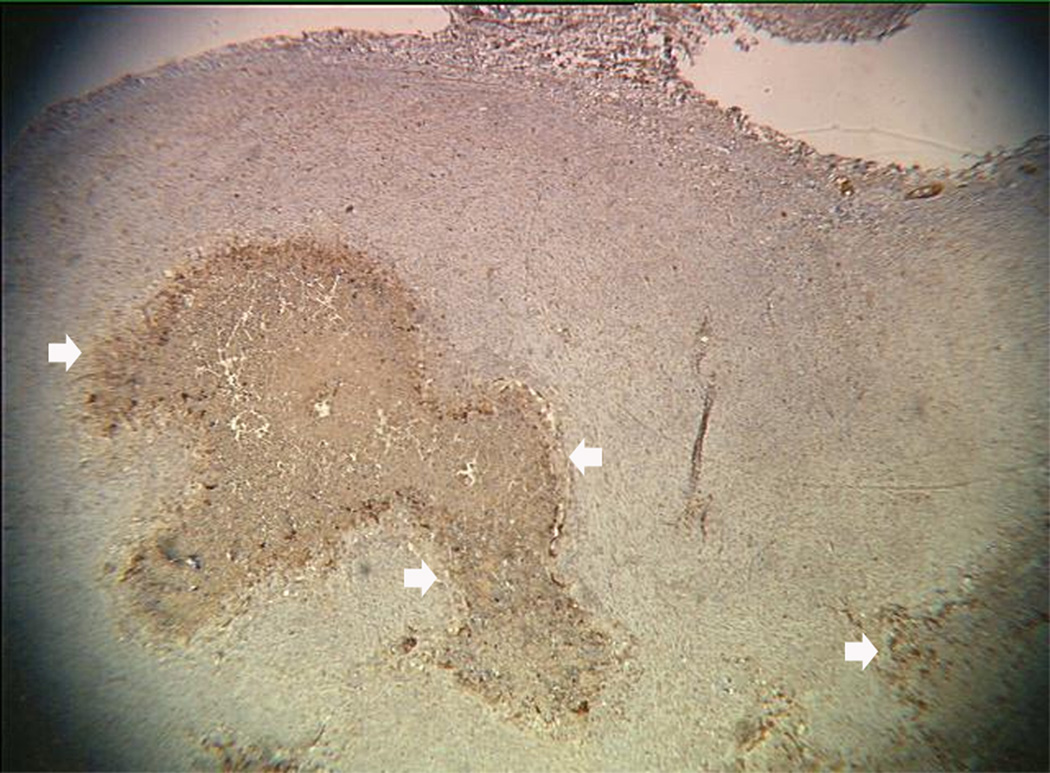
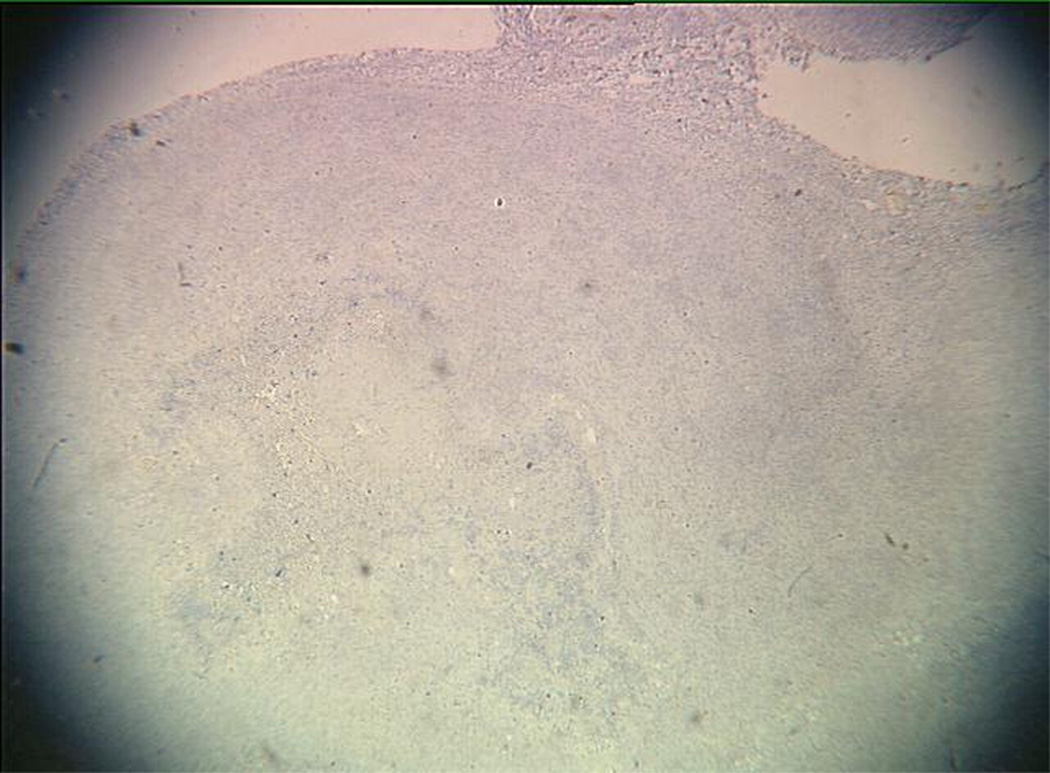
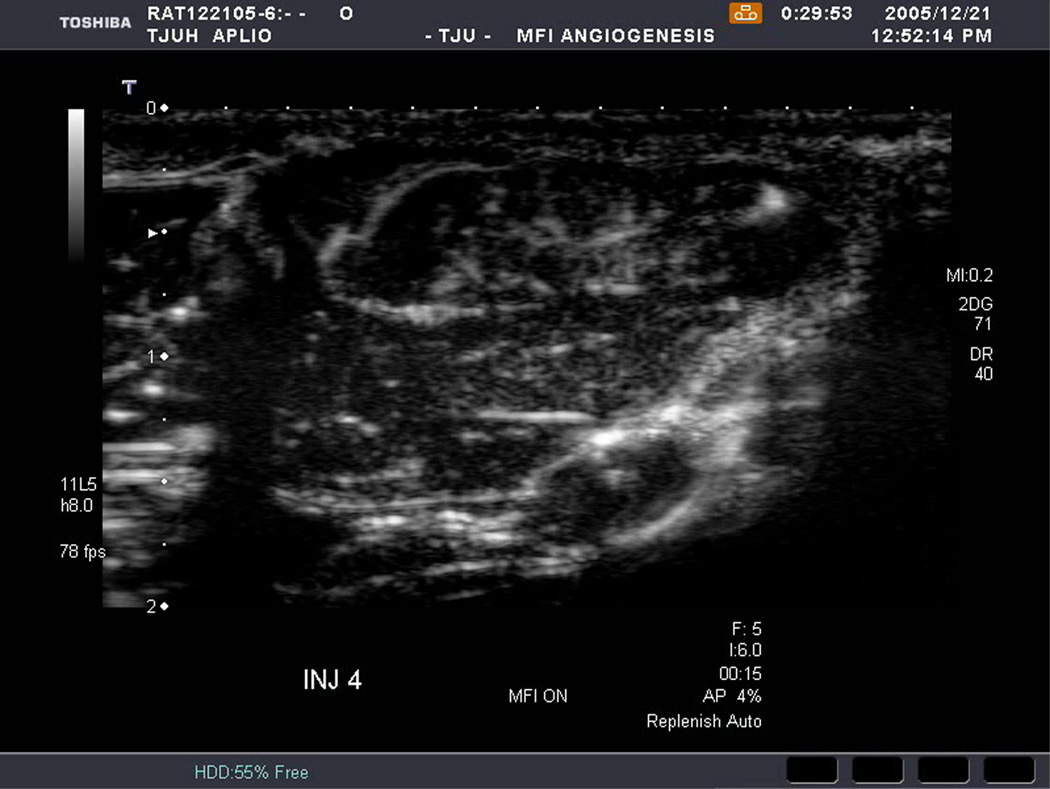
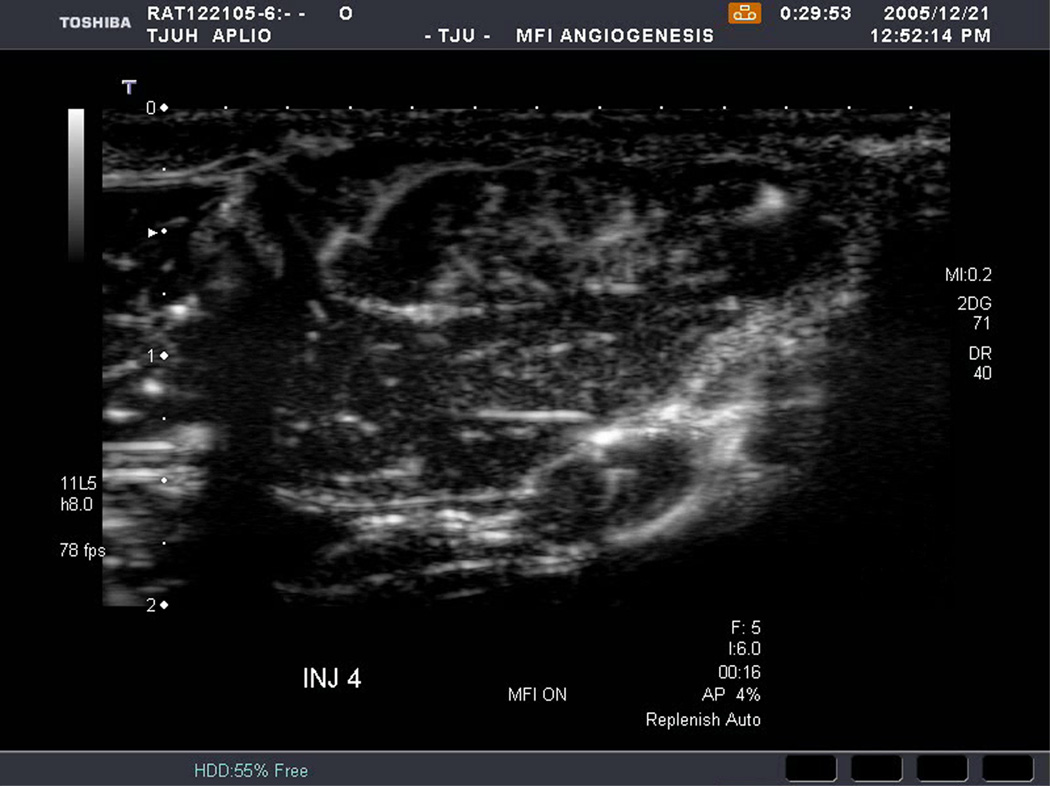
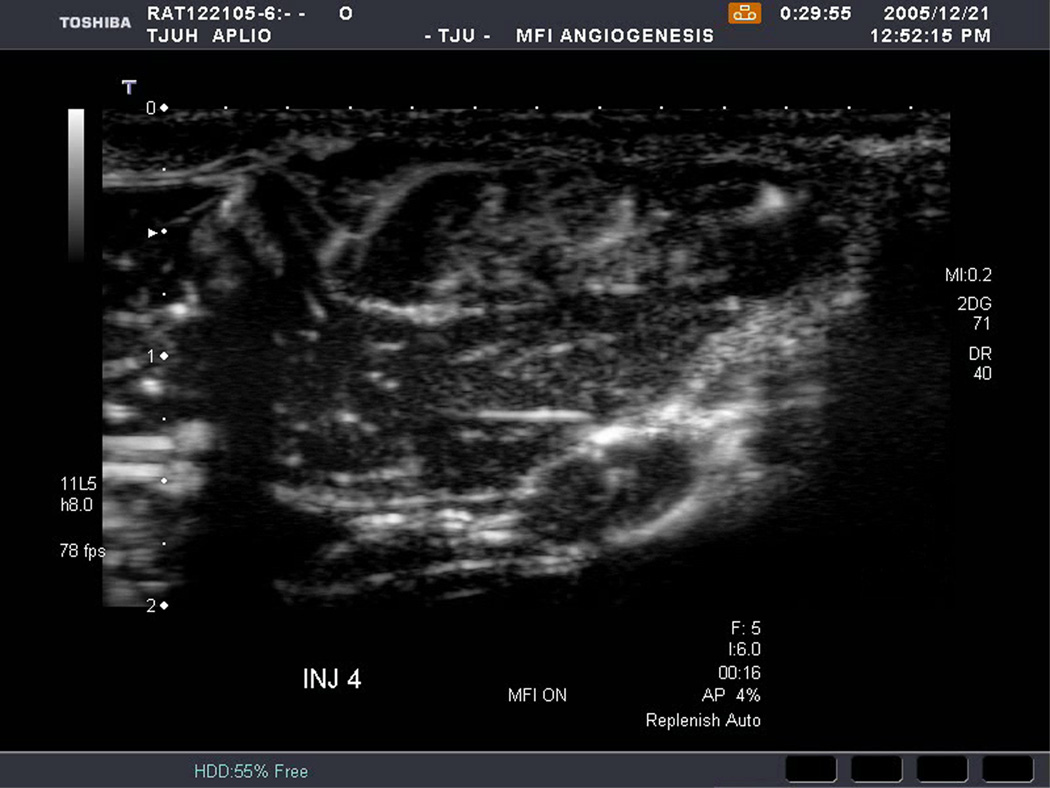
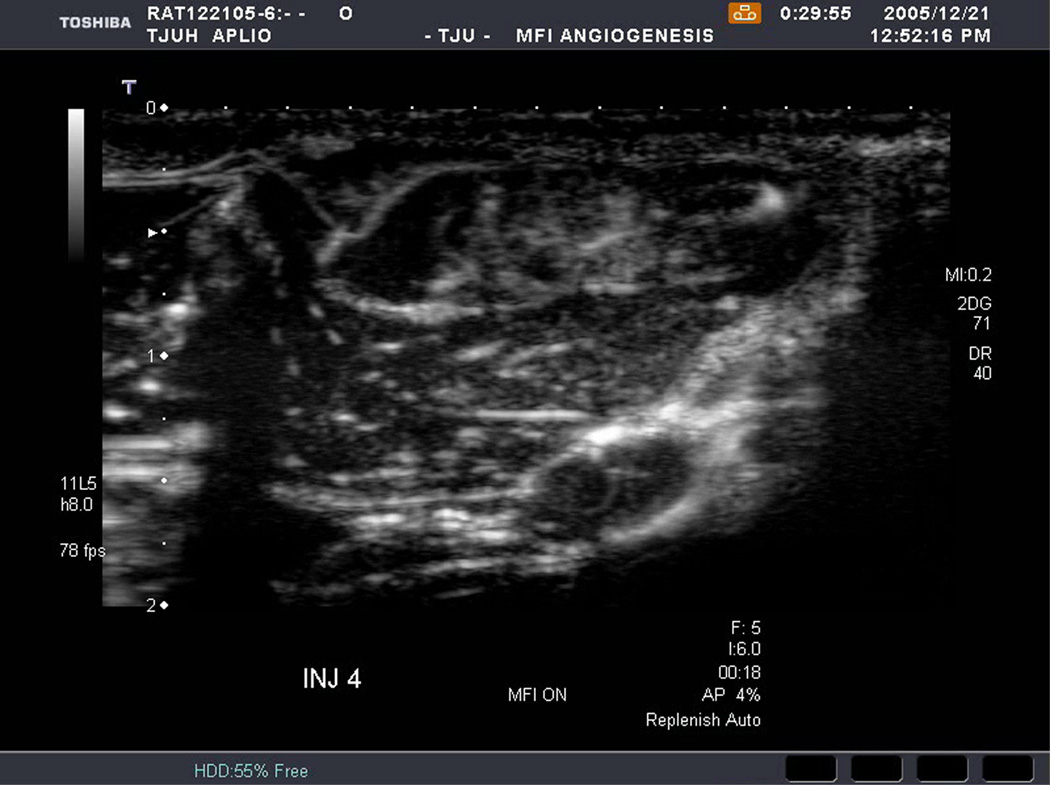
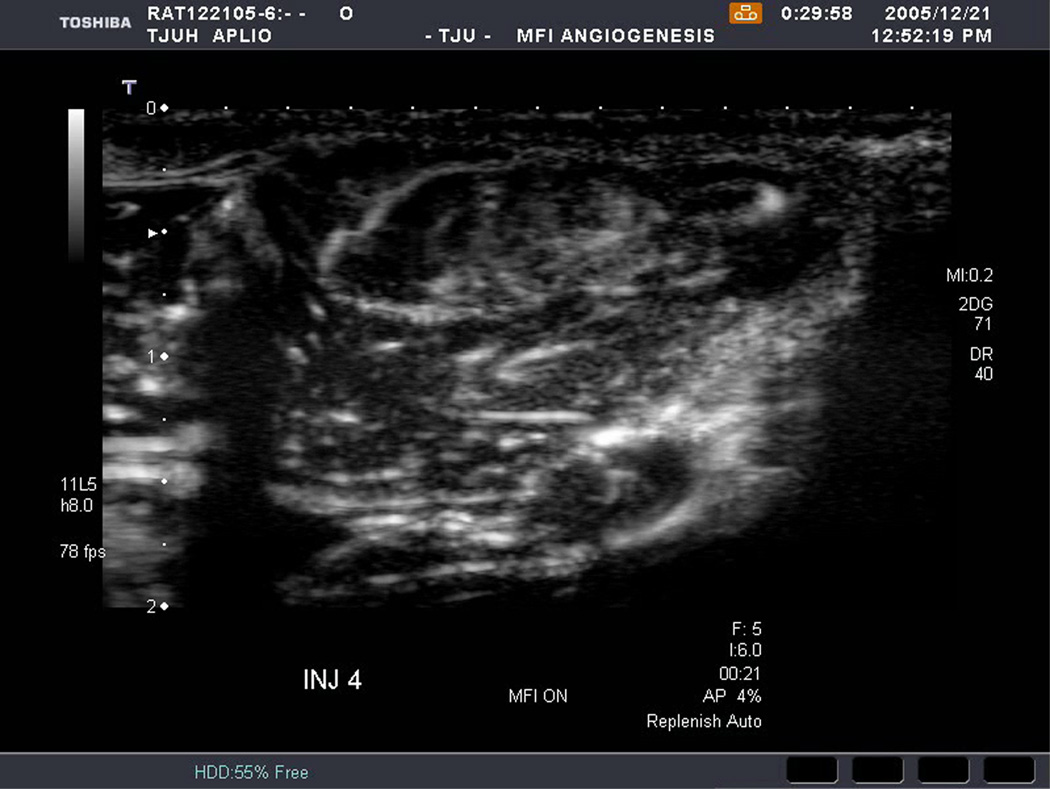
An example of US imaging of a glioma (i.e., the C6 cell line) 8 days following implantation in the thigh before and after contrast administration is presented in Figure 1. Grayscale MFI demonstrates more flow and smaller neovessels compared to PDI, PSHI as well as FEI (cf., Figs. 1B, 1C and 1D to 1E). This is due to the improved resolution of grayscale contrast US imaging modes relative to Doppler flow modes and to the composite nature of MFI (i.e., the final image contains information from many previous images). The tortuous morphology of tumor angiogenesis was also better visualized with MFI than with FEI (i.e., even when reduced framerates were used; Fig. 1D versus 1E). The corresponding immunohistochemical stains (i.e., from the same C6 tumor) are shown in Figure 2. Marked staining was seen for bFGF and COX-2 with more diffuse expression of CD31 and no VEGF stain. In Figure 3 MFI of an NMU breast tumor 6 days post-implantation (in the thigh) is presented. Following the high power flash pulses designed for bubble destruction (Fig. 3A), the vessels within the image are gradually filled with contrast bubbles over the next 5 seconds (Fig. 3B–H). Notice the mix of hyper- and hypo-vascular areas within the tumor itself demonstrating the heterogeneous nature of tumor angiogenesis in this xenograft model and the ability of MFI to depict tumor angiogenesis in detail.
Figure 1.
Example of a C6 glioma (arrows) imaged 8 days post implantation in the thigh in (A) baseline, (B) PDI; (C) PSHI, (D) FEI and (E) MFI modes. Notice the progressive increase in the depiction of tumor vascularity from (B) to (E).
Figure 2.
Immunohistochemical staining of the C6 tumor from Fig 1 showing (A) central brown staining with bFGF (arrows), (B) a more diffuse CD31 stain in the same location (arrows), (C) marked expression of COX-2 (arrows) and (D) no staining with VEGF.
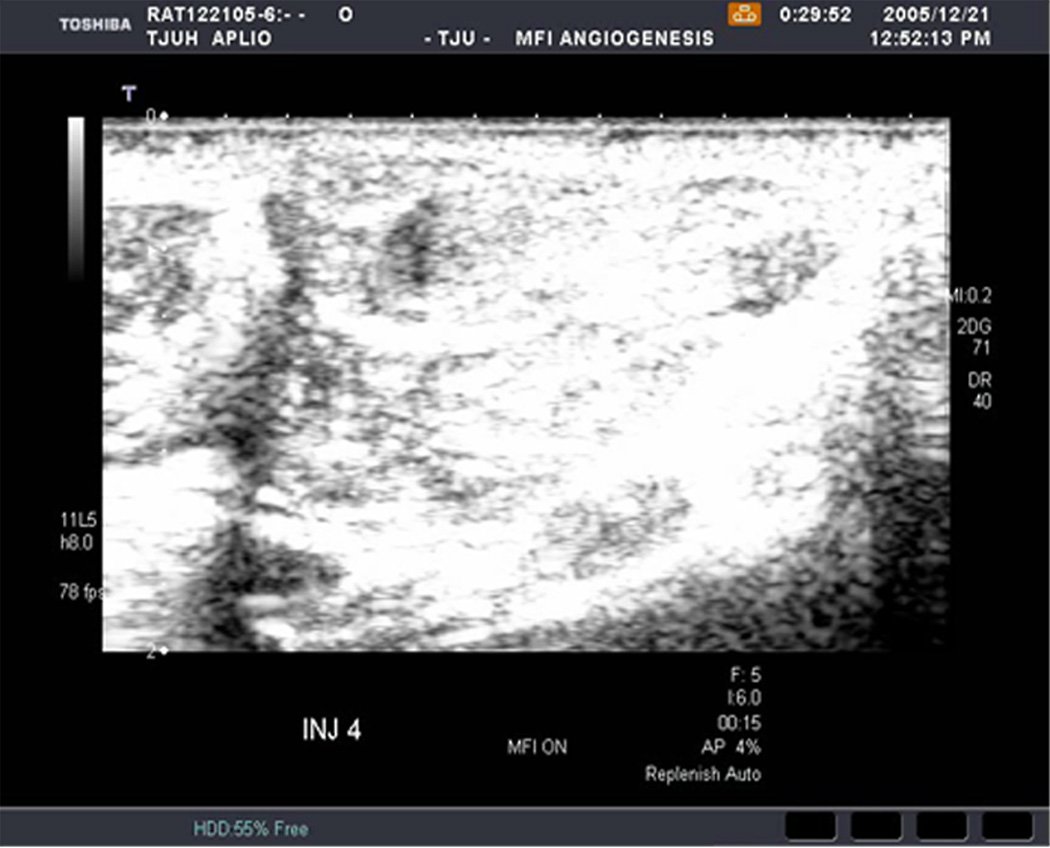
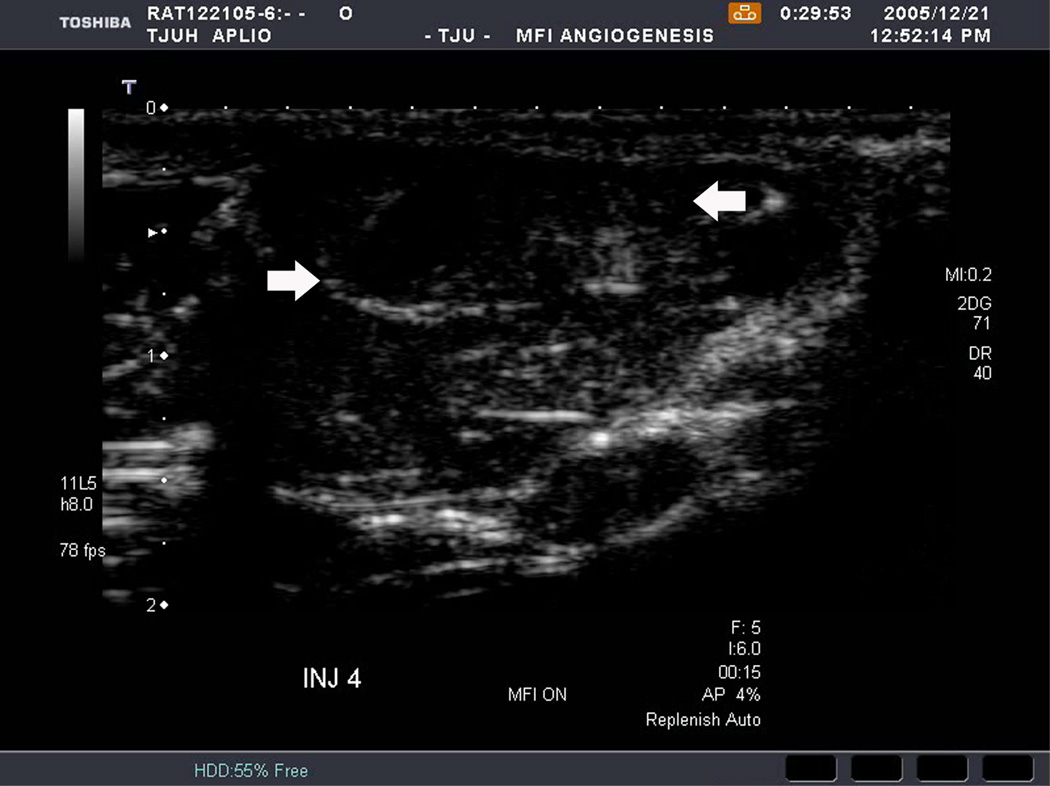
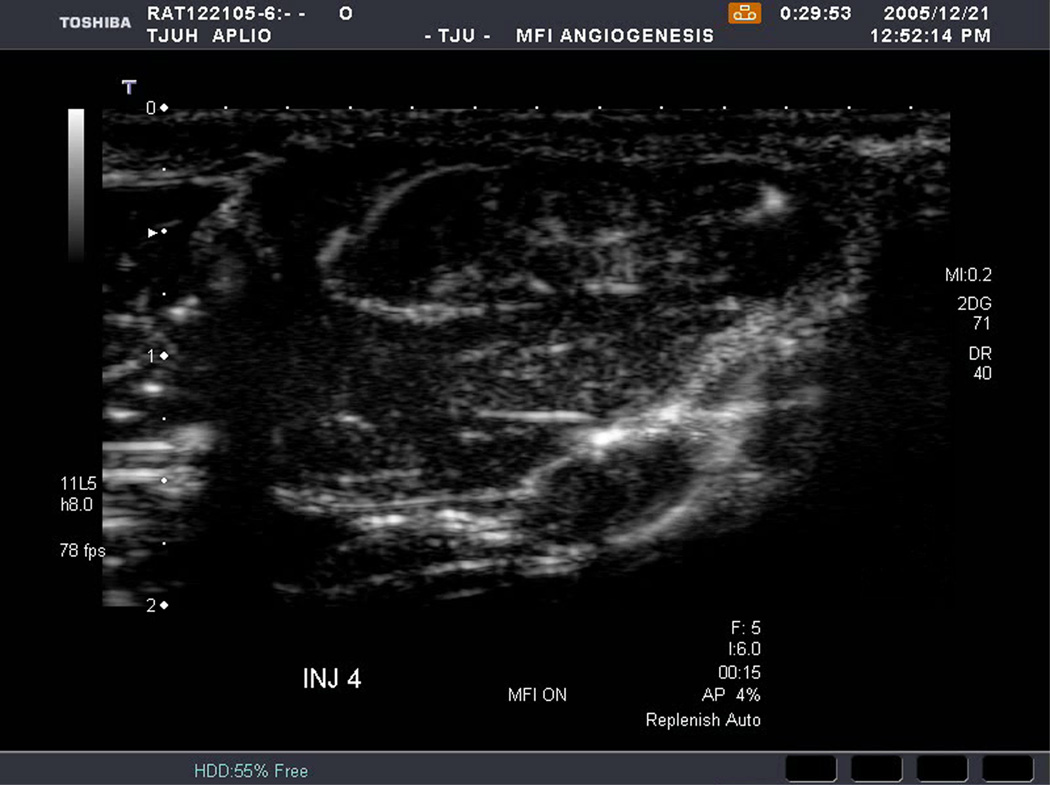
Figure 3.
Rat implanted with an NMU breast tumor in the thigh 6 days prior imaged in MFI mode and shown (A) with flash pulses on, (B) 56 ms later i.e., at baseline with the tumor marked by arrows, (C) after 222 ms, (D) after 444 ms, (E) after 667 ms, (F) after 1.11 s, (G) after 2.44 s, and (H) after 4.67 s. The gradual inflow of contrast bubbles delineates the vasculature (normal as well as angiogenic).
All three assessed parameters (i.e., cell line, implantation method and contrast US imaging technique) were significant in the factorial repeated measures ANOVA model (p < 0.05). There was also significant interaction between cell line and implantation method (p < 0.0001). No other factors were significant (p > 0.06). On average MFI achieved the highest median FV (0.58 ± 0.266) among the US imaging techniques (p < 0.03), as expected given Figure 1. However, this result does not address any correlation between the US measures of FV and the results of the immunohistochemical stains (the reference standards).
Linear regression analysis (performed on ROIs) yielded a correlation between tumor vascularity depicted with PSHI and the percent area stained with VEGF (r = 0.24, p = 0.0043) in abdominal C6 tumors (Table 1). Significant correlation was also shown between PDI as well as FEI and VEGF (r-values of 0.21 to 0.24; p < 0.02). Finally, MFI and bFGF correlated significantly (r = 0.21; p = 0.011) in the C6 tumors implanted in the abdomen. The strongest correlation found by linear regression in the C6 thigh model was between PSHI and percent area stained with CD31 (r = 0.37; p < 0.0001; Table 2). This US contrast imaging modality also correlated with bFGF and VEGF with r-values of 0.34 and 0.21, respectively (p < 0.01). Apart from PSHI, the area stained with CD31 also correlated with FEI and MFI (r equal to 0.23 and 0.24, respectively; p < 0.01). All other comparisons were not statistically significant (p > 0.10). Specifically, no correlations were found between any contrast enhanced US technique and the COX-2 staining of specimens.
Table 1.
Linear regression r-values obtained for C6 tumors implanted in the abdomen (N = 134).
| BFGF | CD31 | COX-2 | VEGF | |
|---|---|---|---|---|
| PDI | 0.03 | 0.02 | 0.02 | 0.21 * |
| PSHI | 0.02 | 0.13 | 0.05 | 0.24 ** |
| FEI | 0.04 | 0.17 | 0.10 | 0.23 ** |
| MFI | 0.20 * | 0.02 | 0.16 | 0.00 |
p < 0.05;
p < 0.01
Table 2.
Linear regression r-values obtained for C6 tumors implanted in the thigh (N = 150).
| BFGF | CD31 | COX-2 | VEGF | |
|---|---|---|---|---|
| PDI | 0.07 | 0.09 | 0.05 | 0.10 |
| PSHI | 0.34 *** | 0.37 *** | 0.06 | 0.21 ** |
| FEI | 0.10 | 0.23 ** | 0.13 | 0.03 |
| MFI | 0.04 | 0.24 ** | 0.07 | 0.03 |
p < 0.05;
p < 0.01;
p < 0.001
In the NMU model the strongest correlation was between FEI and COX-2 when the breast cancer cell line was implanted in the abdomen (r = 0.46, p < 0.0001; Table 3). Both PSHI and FEI were found to correlate with bFGF, CD31 and COX-2 (r > 0.31; p ≤ 0.005). There were no correlations between any contrast enhanced US technique and the immunohistochemical staining for VEGF in this particular model. When the NMU breast tumors were implanted in the thigh linear regression analysis demonstrated no correlations between any contrast US technique with the histological staining of CD31 (Table 4). However, all the US methods did correlate with both the bFGF and the COX-2 stains (r ≥ 0.23; p < 0.04). Moreover, PSHI and FEI also correlated with VEGF with r-values of 0.34 and 0.28, respectively (p < 0.009).
Table 3.
Linear regression r-values obtained for NMU tumors implanted in the abdomen (N = 83).
| BFGF | CD31 | COX-2 | VEGF | |
|---|---|---|---|---|
| PDI | 0.19 | 0.09 | 0.07 | 0.03 |
| PSHI | 0.31 ** | 0.37 *** | 0.38 *** | 0.17 |
| FEI | 0.38 *** | 0.35 **8 | 0.46 *** | 0.19 |
| MFI | 0.00 | 0.01 | 0.02 | 0.02 |
p < 0.01;
p < 0.001
Table 4.
Linear regression r-values obtained for NMU tumors implanted in the thigh (N = 88).
| BFGF | CD31 | COX-2 | VEGF | |
|---|---|---|---|---|
| PDI | 0.23 * | 0.12 | 0.34 ** | 0.12 |
| PSHI | 0.41 *** | 0.09 | 0.42 *** | 0.34 ** |
| FEI | 0.37 *** | 0.10 | 0.45 *** | 0.28 ** |
| MFI | 0.40 *** | 0.12 | 0.36 *** | 0.17 |
p < 0.05;
p < 0.01;
p < 0.001
When testing the highest correlation coefficient within a given group (e.g., 0.46 in Table 3) versus the other significant correlations in the same group, there were no significant differences (p > 0.10). There was a trend towards significance when r-values from the C6 and NMU tumors implanted in the abdomen were compared (p = 0.075) as well as among the FEI and PSHI correlations (p equal to 0.059 and 0.085, respectively). Otherwise results indicated no statistically significant differences between correlations obtainned for a given cell line, implantation technique or contrast US imaging mode (p > 0.11).
4. Discussion
To the best of our knowledge, this study of 144 rats is the largest study of contrast US of murine xenografts conducted to date, with previous investigations examining from 5 to 37 animals (e.g., [10–25]). More tumor blood flow and smaller neovessels were depicted with MFI than with PDI, PSHI or FEI (p < 0.03; Figs. 1 and 3), which is most likely due to the composite nature of MFI (i.e., information from many previous contrast US images are contained in the final MFI image) and indicates MFI should be the method of choice for imaging tumor blood flow with contrast enhanced US. Multiple significant correlations were found between the US modes and the immunohistochemical markers of angiogenesis (p < 0.04) with the strongest correlation obtained between FEI and COX-2 in the NMU breast cancer model (r = 0.46, p < 0.0001; Table 3). Thus, contrast US of tumor neovascularity appears to provide noninvasive markers of angiogenesis, but somewhat disappointingly there were no statistically significant differences between correlations obtained with the various US techniques (p > 0.05).
Early results evaluating tumor angiogenesis in murine xenografts with contrast US were mixed with Iordanescu et al. [16] finding no correlation between vascularity seen with contrast enhanced US and that of histologic examination, and also no significant differences in the post-contrast pattern of tumor vascularity between treated and control prostate tumors in 35 mice (p > 0.1). This was similar to the results obtained by Schroeder and colleagues [17] in 37 mice with B16-F1 melanoma tumors implanted. Conversely, a smaller study of 10 mice with human squamous tumors [18] showed correlation between CD31 staining and vascularity measured by contrast enhanced PDI (p < 0.01), while our group [10] demonstrated that COX-2 staining of specimens from the WM-9 human melanoma xenograft model correlated with contrast PDI and intermittent PSHI (which is similar to FEI; p < 0.05).
Recent results have been more positive with significant correlations (p < 0.01) seen between contrast US and CT, MRI as well as PET in 5 to 31 murines [19–21]. When PSHI was employed by our group [14], US measures of tumor vascularity correlated significantly with the expression of VEGF in the DB-1 melanoma model (p < 0.01). Likewise, Stieger and co-workers [22] used low-power multipulse contrast US in combination with contrast bubbles targeted to endothelial cells and reported a correlation with microvessel density in a rat Matrigel model (N = 22; p < 0.05). Guibal et al. [15] demonstrated in 32 mice that contrast US-derived parameters clearly separated tumors that were constantly (controls) or rapidly progressive from tumors with a slower progression (p < 0.05), providing a noninvasive measure of tumor angiogenesis and, in particular, of the re-vascularization occurring after discontinuation of an anti-VEGF therapy. Our group studied the use of a decoy VEGF-receptor agent, which blocks VEGF from reaching its natural receptor, in the DB-1 xenograft model [23]. Preliminary results indicate that contrast enhanced US allowed monitoring of the effects of this decoy VEGF-receptor in vivo (N = 9; p ≤ 0.04). However, even though contrast US appears to provide a noninvasive marker for angiogenesis in murine xenografts, the specific markers seem to vary with individual cell lines complicating the use of contrast enhanced US in these animal models. Nonetheless, monitoring changes in tumor angiogenesis following treatment with vascular targeted drugs have met with some success in human clinical trials [6,47]. This indicates that dynamic changes in blood flow over time (where each patient acts as their own control) may be used to differentiate between responders and non-responders [6].
There are a number of limitations to the present study, which must be considered. The elevation thickness of the US beam is orders of magnitude larger than the thickness of the specimen slides (mm vs. µm) indicating that a perfect match cannot be achieved (even though great care was taken to align US images and specimens). Moreover, the imaging took place in the near field, which may have resulted in pressure variations and, hence, variations in bubble destruction across the imaging plane [25]. Finally, a statistical limitation of this study is the multiple comparisons being conducted. To account for the statistically significant results in light of this, a Bonferroni correction may be applied, which assigns the traditional 0.05 p-value divided by the number of comparisons (here 16 per implantation method and tumor cell line) to be the p-value of significance [48]. On the other hand, there are also problems associated with Bonferroni correction. By controlling the group-wise error rate, each individual test is held to an unreasonably high standard and makes it likely that legitimately significant results will not be detected [49]. Hence, we chose not to adopt Bonferroni correction in this study. It should be noted, however, that even if Bonferroni correction was applied a dozen of the comparisons between contrast US and histopathology would still produce a significant correlation (since 0.05/16 = 0.003 cf., Tables 1–4).
In summary, in this study the tortuous morphology of tumor angiogenesis was better visualized with MFI than with the other US methods (as confirmed by the quantitative results). Moreover, the quantitative parameter – the fractional tumor vascularity – derived from contrast enhanced US images has been shown to provide a noninvasive measure of glioma and breast tumor neovascularity in rat xenograft models (corresponding in particular to the expression of bFGF and COX-2). However, the best contrast US method for monitoring angiogenesis was not conclusively established.
Research Highlights
The largest contrast US study to date of 144 murine xenografts has been conducted.
The best visualization of tumor blood flow was achieved with MFI (p < 0.03).
Contrast US appears to provide noninvasive, quantitative markers of angiogenesis.
A single best contrast US mode for monitoring angiogenesis could not be determined.
Acknowledgments
This work was supported by NIH CA093907. The contrast agent was provided by GE Healthcare, Princeton, NJ, while Toshiba America Medical Systems, Tustin, CA provided the ultrasound scanner.
Appendix
List of Acronyms
ANOVA – analysis of variance
bFGF – basic fibroblast growth factor
CCD – charge-coupled device
CD31 (or PECAM) – platelet endothelial cell adhesion molecule
COX-2 – Cyclooxygenase-2
CT – computed tomography
FEI – Flash echo imaging
FV – Fractional tumor vascularity
MFI – Microflow imaging
MI – Mechanical index
MIP – maximum intensity projection
MRI – magnetic resonance imaging
PDI – Power Doppler imaging
PET – positron emission tomography
PRF – pulse repetition frequency
PSHI – pulse subtraction harmonic imaging
ROI – region of interest
US – ultrasound imaging
VEGF – vascular endothelial growth factor
Footnotes
Publisher's Disclaimer: This is a PDF file of an unedited manuscript that has been accepted for publication. As a service to our customers we are providing this early version of the manuscript. The manuscript will undergo copyediting, typesetting, and review of the resulting proof before it is published in its final citable form. Please note that during the production process errors may be discovered which could affect the content, and all legal disclaimers that apply to the journal pertain.
References
- 1.Folkman J. What is the evidence that tumors are angiogenesis dependent? J Natl Canc Inst. 1990;82:4–6. doi: 10.1093/jnci/82.1.4. [DOI] [PubMed] [Google Scholar]
- 2.Makrilia N, Lappa T, Xyla V, Nikolaidis I, Syrigos K. The role of angiogenesis in solid tumours: an overview. Eur J Intern Med. 2009;20:663–671. doi: 10.1016/j.ejim.2009.07.009. [DOI] [PubMed] [Google Scholar]
- 3.Li WW. Tumor angiogenesis: molecular pathology, therapeutic targeting, and imaging. Acad Radiol. 2000;7:800–811. doi: 10.1016/s1076-6332(00)80629-7. [DOI] [PubMed] [Google Scholar]
- 4.Perini R, Choe R, Yodh AG, Sehgal C, Divgi CR, Rosen MA. Non-invasive assessment of tumor neovasculature: techniques and clinical applications. Cancer Metastasis Rev. 2008;27:615–630. doi: 10.1007/s10555-008-9147-6. [DOI] [PubMed] [Google Scholar]
- 5.Eisenbrey JR, Forsberg F. Contrast enhanced ultrasound for molecular imaging of angiogenesis. Eur J Nucl Med Mol Imaging. 2010;37:S138–S146. doi: 10.1007/s00259-010-1449-6. [DOI] [PubMed] [Google Scholar]
- 6.Cosgrove D, Lassau N. Imaging of perfusion using ultrasound. Eur J Nucl Med Mol Imaging. 2010;37:S65–S85. doi: 10.1007/s00259-010-1537-7. [DOI] [PubMed] [Google Scholar]
- 7.Goldberg BB, Raichlen JS, Forsberg F. Ultrasound Contrast Agents: Basic Principles and Clinical Applications. 2nd Ed. London, England: Martin Dunitz Ltd.; 2001. [Google Scholar]
- 8.Ferrara KF, Merritt CRB, Burns PN, Foster S, Mattrey RF, Wickline SA. Evaluation of tumor angiogenesis with US: imaging, Doppler and contrast agents. Acad Radiol. 2000;7:824–839. doi: 10.1016/s1076-6332(00)80631-5. [DOI] [PubMed] [Google Scholar]
- 9.Forsberg F, Kuruvilla B, Pascua MB, Chaudhari MH, Merton DA, Palazzo JP, Goldberg BB. Comparing contrast-enhanced color flow imaging and pathological measures of breast lesion vascularity. Ultrasound Med Biol. 2008;34:1365–1372. doi: 10.1016/j.ultrasmedbio.2008.02.010. [DOI] [PMC free article] [PubMed] [Google Scholar]
- 10.Forsberg F, Dicker AP, Thakur ML, Rawool NM, Liu JB, Shi WT, Nazarian LN. Comparing contrast enhanced ultrasound to immunohistochemical markers of angiogenesis in a human melanoma xenograft model: preliminary results. Ultrasound Med Biol. 2002;28:445–451. doi: 10.1016/s0301-5629(02)00482-9. [DOI] [PubMed] [Google Scholar]
- 11.Leong-Poi H, Christiansen J, Klibanov AL, Kaul S, Lindner JR. Noninvasive assessment of angiogenesis by ultrasound and microbubbles targeted to alpha(v)-integrins. Circulation. 2003;107:455–460. doi: 10.1161/01.cir.0000044916.05919.8b. [DOI] [PubMed] [Google Scholar]
- 12.Lucidarme O, Kono Y, Corbeil J, Choi SH, Golmard JL, Varner J, Mattrey RF. Angiogenesis: noninvasive quantitative assessment with contrast-enhanced functional US in murine model. Radiology. 2006;239:730–739. doi: 10.1148/radiol.2392040986. [DOI] [PubMed] [Google Scholar]
- 13.Fleischer AC. Sonographic depiction of tumor vascularity and flow from in vivo models to clinical applications. J Ultrasound Med. 2000;19:55–61. doi: 10.7863/jum.2000.19.1.55. [DOI] [PubMed] [Google Scholar]
- 14.Forsberg F, Ro RJ, Liu JB, Lipcan KJ, Potoczek M, Nazarian LN. Monitoring angiogenesis in a human melanoma xenograft model using contrast enhanced ultrasound imaging. Ultrasonic Imaging. 2008;30:237–246. doi: 10.1177/016173460803000407. [DOI] [PubMed] [Google Scholar]
- 15.Guibal A, Taillade L, Mulé S, Comperat E, Badachia Y, Golmard JL, Le Guillou-Buffello D, Rixe O, Bridal SL, Lucidarme O. Noninvasive contrast-enhanced ultrasound imaging quantitative assessment of tumor microcirculation in a murine model: effect of discontinuing anti-VEGF therapy. Radiology. 2010;254:420–429. doi: 10.1148/radiol.09090728. [DOI] [PubMed] [Google Scholar]
- 16.Iordanescu I, Becker C, Zetter B, Dunning P, Taylor GA. Tumor vascularity: evaluation in a murine model with contrast-enhanced color Doppler US—effect of angiogenesis inhibitors. Radiology. 2002;222:460–467. doi: 10.1148/radiol.2222010660. [DOI] [PubMed] [Google Scholar]
- 17.Schroeder RJ, Hauff P, Bartels T, Vogel K, Jeschke J, Hidajat N, Maeurer J. Tumor vascularization in experimental melanomas: correlation between unenhanced and contrast enhanced power Doppler imaging and histological grading. Ultrasound Med Biol. 2001;27:761–771. doi: 10.1016/s0301-5629(01)00363-5. [DOI] [PubMed] [Google Scholar]
- 18.Krix M, Kiessling F, Vosseler S, Kiessling I, Le-Huu M, Fusenig NE, Delorme S. Comparison of intermittent-bolus contrast imaging with conventional power Doppler sonography: quantification of tumor perfusion in small animals. Ultrasound Med Biol. 2003;29:1093–1103. doi: 10.1016/s0301-5629(03)00060-7. [DOI] [PubMed] [Google Scholar]
- 19.Niermann KJ, Fleischer AC, Huamani J, Yankeelov TE, Kim DW, Wilson WD, Hallahan DE. Measuring tumor perfusion in control and treated murine tumors: correlation of microbubble contrast-enhanced sonography to dynamic contrast-enhanced magnetic resonance imaging and fluorodeoxyglucose positron emission tomography. J Ultrasound Med. 2007;26:749–756. doi: 10.7863/jum.2007.26.6.749. [DOI] [PubMed] [Google Scholar]
- 20.Pollard RE, Broumas AR, Wisner ER, Vekich SV, Ferrara KW. Quantitative contrast enhanced ultrasound and CT assessment of tumor response to antiangiogenic therapy in rats. Ultrasound Med Biol. 2007;33:235–245. doi: 10.1016/j.ultrasmedbio.2006.07.036. [DOI] [PubMed] [Google Scholar]
- 21.Lee DJ, Lyshchik A, Huamani J, Hallahan DE, Fleischer AC. Relationship between retention of a vascular endothelial growth factor receptor 2 (VEGFR2)-targeted ultrasonographic contrast agent and the level of VEGFR2 expression in an in vivo breast cancer model. J Ultrasound Med. 2008;27:855–866. doi: 10.7863/jum.2008.27.6.855. [DOI] [PubMed] [Google Scholar]
- 22.Stieger SM, Dayton PA, Borden MA, Caskey CF, Griffey SM, Wisner ER, Ferrara KW. Imaging of angiogenesis using Cadence contrast pulse sequencing and targeted contrast agents. Contrast Media Mol Imaging. 2008;3:9–18. doi: 10.1002/cmmi.224. [DOI] [PubMed] [Google Scholar]
- 23.Ro RJ, Forsberg F, Liu JB, et al. Contrast enhanced US for monitoring the effect of VEGF Trap on melanoma tumor vascularity; Proc IEEE Ultrason Symp; 2007. pp. 1977–1980. [Google Scholar]
- 24.Stieger SM, Bloch SH, Foreman O, Wisner ER, Ferrara KW, Dayton PA. Ultrasound assessment of angiogenesis in a matrigel model in rats. Ultrasound Med Biol. 2006;32:673–681. doi: 10.1016/j.ultrasmedbio.2005.12.008. [DOI] [PMC free article] [PubMed] [Google Scholar]
- 25.Ro RJ, Forsberg F, Liu JB, Lipcan KJ, Potoczek M, Lewin PA, Goldberg BB. Comparing contrast-enhanced US to markers of angiogensis in a murine glioma model; Proc. IEEE Ultrason Symp; 2005. pp. 365–368. [Google Scholar]
- 26.Du J, Li FH, Fang H, Xia JG, Zhu CX. Microvascular architecture of breast lesions: evaluation with contrast-enhanced ultrasonographic micro flow imaging. J Ultrasound Med. 2008;27:833–842. doi: 10.7863/jum.2008.27.6.833. [DOI] [PubMed] [Google Scholar]
- 27.Linden RA, Trabulsi EJ, Forsberg F, Gittens PR, Gomella LG, Halpern EJ. Contrast enhanced ultrasound flash replenishment method for directed prostate biopsies. J Urol. 2007;178:2354–2358. doi: 10.1016/j.juro.2007.08.022. [DOI] [PubMed] [Google Scholar]
- 28.Sugimoto K, Moriyasu F, Kamiyama N, Metoki R, Yamada M, Ymai I, Iijima H. Analysis of morphological vascular changes of hepatocellular carcinoma by microflow imaging using contrast-enhanced sonography. Hepatol Res. 2008;38:790–799. doi: 10.1111/j.1872-034X.2008.00331.x. [DOI] [PubMed] [Google Scholar]
- 29.Wilson SR, Jang HJ, Kim TK, Iijima H, Kamiyama N, Burns PN. Real-time temporal maximum-intensity-projection imaging of hepatic lesions with contrast-enhanced sonography. AJR Am J Roentgenol. 2008;190:691–695. doi: 10.2214/AJR.07.3116. [DOI] [PubMed] [Google Scholar]
- 30.Brenda P, Lightbody J, Sato G, et al. Differentiated rat glial cell strain in tissue culture. Science. 1968;161:370–371. doi: 10.1126/science.161.3839.370. [DOI] [PubMed] [Google Scholar]
- 31.Cohen LA. Isolation and characterization of a serially cultivated, neoplastic, epithelial cell line from the N-nitrosomethylurea induced rat mammary adenocarcinoma. In Vitro. 1982;18:565–575. doi: 10.1007/BF02810080. [DOI] [PubMed] [Google Scholar]
- 32.Ackermann E. Proteinase activity in malignant human breast cancers and NMU mammary tumours of the rat. Anticancer Res. 1988;8:483–487. [PubMed] [Google Scholar]
- 33.Kitai R, Kabuto M, Kubota T, et al. Sensitization to hyperthermia by intracellular acidification of C6 glioma cells. J Neurooncol. 1998;39:197–203. doi: 10.1023/a:1005996816453. [DOI] [PubMed] [Google Scholar]
- 34.Cohen JL, Cheirif J, Segar DS, et al. Improved left ventricular endocardial border delineation and opacification with OPTISON (FS069), a new echocardiographic contrast agent: results of a phase III multicenter trial. J. Am. Coll. Cardiol. 1998;32:746–752. doi: 10.1016/s0735-1097(98)00311-8. [DOI] [PubMed] [Google Scholar]
- 35.Simpson DH, Chin CT, Burns PN. Pulse inversion Doppler: a new method for detecting nonlinear echoes from microbubble contrast agents. IEEE Trans Ultrason Ferroelec Freq Contr. 1999;46:372–382. doi: 10.1109/58.753026. [DOI] [PubMed] [Google Scholar]
- 36.Forsberg F, Liu JB, Chiou HJ, Rawool NM, Parker L, Goldberg BB. Comparison of fundamental and wideband harmonic contrast imaging of liver tumors. Ultrasonics. 2000;38:110–113. doi: 10.1016/s0041-624x(99)00149-3. [DOI] [PubMed] [Google Scholar]
- 37.Kamiyama N, Moriyasu F, Mine Y, Goto Y. Analysis of flash echo from contrast agent for designing optimal ultrasound diagnostic systems. Ultrasound Med. Biol. 1998;25:411–420. doi: 10.1016/s0301-5629(98)00182-3. [DOI] [PubMed] [Google Scholar]
- 38.Apfel RE, Holland CK. Gauging the likelihood of cavitation from short-pulse, low-duty cycle diagnostic ultrasound. Ultrasound Med Biol. 1991;17:179–185. doi: 10.1016/0301-5629(91)90125-g. [DOI] [PubMed] [Google Scholar]
- 39.Forsberg F, Shi WT, Merritt CRB, Dai Q, Solcova M, Goldberg BB. On the usefulness of the mechanical index displayed on clinical ultrasound scanners for predicting contrast microbubble destruction. J Ultrasound Med. 2005;24:443–450. doi: 10.7863/jum.2005.24.4.443. [DOI] [PubMed] [Google Scholar]
- 40.Bremnes RM, Camps C, Sirera R. Angiogenesis in non-small cell lung cancer: The prognostic impact of neoangiogenesis and the cytokines VEGF and bFGF in tumours and blood. Lung Canc. 2006;51:143–158. doi: 10.1016/j.lungcan.2005.09.005. [DOI] [PubMed] [Google Scholar]
- 41.Ferrara N. Role of vascular endothelial growth factor in the regulation of angiogenesis. Kidney Intl. 1999;56:794–814. doi: 10.1046/j.1523-1755.1999.00610.x. [DOI] [PubMed] [Google Scholar]
- 42.Denkert C, Köbel M, Berger S, Siegert A, Leclere A, Trefzer U, Hauptmann S. Expression of cyclooxygenase 2 in human malignant melanoma. Cancer Res. 2001;61:303–308. [PubMed] [Google Scholar]
- 43.Xu XC. COX-2 inhibitors in cancer treatment and prevention, a recent development. Anti-Cancer Drugs. 2002;13:127–137. doi: 10.1097/00001813-200202000-00003. [DOI] [PubMed] [Google Scholar]
- 44.Newman PJ. The biology of PECAM-1. J Clin Invest. 1997;99:3–8. doi: 10.1172/JCI119129. [DOI] [PMC free article] [PubMed] [Google Scholar]
- 45.Bell DS, Bamber JC, Eckersley RJ. Segmentation and analysis of colour Doppler images of tumour vasculature. Ultrasound Med Biol. 1995;21:635–637. doi: 10.1016/0301-5629(95)00006-d. [DOI] [PubMed] [Google Scholar]
- 46.Rosner B. Fundamentals of Biostatistics. 3rd Ed. Boston, MA: PWS-Kent Publishing Co.; 1990. [Google Scholar]
- 47.Lassau N, Lacroix J, Aziza R, Vilgrain V, Taieb S, Koscielny S. French multicentric prospective evaluation of dynamic contrast enhanced ultrasound (DCE-US) for the evaluation of antiangiogenic treatments. Chicago, USA: 95th Ann Meet Radiological Society of North America (RSNA); 2009:408.
- 48.Bland JM, Altman DG. Multiple significance tests: the Bonferroni method. Br Med J. 1995;310:170. doi: 10.1136/bmj.310.6973.170. [DOI] [PMC free article] [PubMed] [Google Scholar]
- 49.Perneger TV. What’s wrong with Bonferroni adjustments. Br Med J. 1998;316:1236–1238. doi: 10.1136/bmj.316.7139.1236. [DOI] [PMC free article] [PubMed] [Google Scholar]


