

Abstract
The gap junction and voltage-gated Na+ channel play an important role in the action potential propagation. The purpose of this study was to elucidate the roles of subcellular Na+ channel distribution in action potential propagation. To achieve this, we constructed the myocardial strand model, which can calculate the current via intercellular cleft (electric-field mechanism) together with gap-junctional current (gap-junctional mechanism). We conducted simulations of action potential propagation in a myofiber model where cardiomyocytes were electrically coupled with gap junctions alone or with both the gap junctions and the electric field mechanism. Then we found that the action potential propagation was greatly affected by the subcellular distribution of Na+ channels in the presence of the electric field mechanism. The presence of Na+ channels in the lateral membrane was important to ensure the stability of propagation under conditions of reduced gap-junctional coupling. In the poorly coupled tissue with sufficient Na+ channels in the lateral membrane, the slowing of action potential propagation resulted from the periodic and intermittent dysfunction of the electric field mechanism. The changes in the subcellular Na+ channel distribution might be in part responsible for the homeostatic excitation propagation in the diseased heart.
Introduction
The coordinated propagation of electrical excitation is crucial for normal contractile function in the heart. The abnormalities in action potential (AP) propagation, such as slow conduction and unidirectional block that underlie conduction heterogeneities in cardiac tissue, are involved in cardiac arrhythmias.
The electrical excitation in cardiac myocytes is known to propagate from cell to cell through gap junctions between adjacent cells. The electrical conductance between cells can be changed by altering the gap-junctional conductance (Gg) due to the effect of drugs (1,2), myocardial ischemia (3,4), or by changing the expression of connexins (5,6) (gap-junction channel-forming proteins (7)). In fact, gap-junctional coupling is attenuated by an alteration of the pattern of connexin expression in the cell membrane under various pathophysiological conditions (8–10). Experimental (11) and numerical (12,13) studies have shown that a reduced gap-junctional coupling leads to the slowing of conduction velocity (CV). However, in several studies using genetically engineered murine models such as connexin (Cx) 43 knockout mice, Cx43 heterozygotes, and cardiac-restricted Cx43 conditional knockout (CKO) mice (14–17), it has been pointed out that the relationship between gap-junctional coupling and CV might be complex. In particular, despite the fact that the Gg in Cx43 CKO mice was decreased to <10% of the one in wild-type mice (17), the actual CV in the Cx43 CKO mice measured by Gutstein et al. (16) was as much as 50% of that in wild-type.
Such experimental observations are not fully reproduced in numerical models of AP propagation via gap junctions (12,13). Therefore, it is probable that other propagating mechanisms contribute to AP propagation. In previous theoretical studies (18,19), a propagating mechanism responsible for a large negative extracellular potential in the narrow cleft space of intercellular junctions, the so-called electric field (EF) mechanism, was proposed as an alternative to the gap-junctional mechanism. The EF mechanism postulates that during AP propagation from cell to cell, the large inward Na+ channel (NaCh) current on the proximal side of an intercellular cleft generates the large negative extracellular potential within the cleft, which, in turn, activates the inward NaCh current in the adjacent cell on the distal side of the cleft.
Voltage-gated NaCh current is responsible for the onset of AP and the AP propagation in the myocardium, and therefore, modulating the NaCh function has an important impact on membrane excitability. It has been reported that cardiac-type NaChs together with gap junctions are intensively expressed at junctional membrane (JM) facing intercellular cleft (i.e., intercalated disk), but are also slightly expressed in the lateral part of the cell membrane (LM) of the myocyte (20–23). The distribution of NaChs may change under pathophysiological cardiac remodeling (23). A recent simulation study (24) incorporating both the gap-junctional mechanism and the EF mechanism revealed that the localization of NaChs at the JM could maintain AP propagation even if gap-junctional coupling was greatly reduced. Nevertheless, the physiological significance of the distribution of NaChs at LM on AP propagation is not yet fully understood.
In this study, we conducted simulations of AP propagation along a myocardial fiber electrically coupled with gap-junctional mechanism alone or with both the gap-junctional mechanism and the EF mechanism at each cell junction. The purpose of this study was to elucidate how the NaChs, expressed at both JM and LM, play roles in AP propagation. In this article, we confirmed that both the gap-junctional mechanism and the EF mechanism contribute to the AP propagation in ventricles as reported previously (18,19,24), and showed that the property of AP propagation is greatly changed by the different subcellular distribution of NaChs if the EF mechanism is the case.
We found that the presence of NaChs in the LM was important to ensure the stability of AP propagation under conditions of decreased gap-junctional coupling, and that during the AP propagation in the poorly coupled tissue with sufficient NaChs in the LM, the slowing of AP propagation resulted from the periodic and intermittent dysfunction of the EF mechanism. In addition, without NaChs distribution to the LM, AP propagation based on the EF mechanism was unstable, and the morphology of the propagating AP was greatly affected, suggesting that changes in the subcellular NaCh distribution might be in part responsible for the homeostatic excitation propagation in the diseased heart.
Methods
Myofiber model
To study the effect of subcellular distribution of NaChs on AP propagation, we used a one-dimensional myofiber consisting of serially arranged ventricular cells shown in Fig. 1 A. In this model, all cells had the same length (100 μm) and width (22 μm) (13), to prevent the effects of heterogeneity of cell size and shape on AP propagation (25).
Figure 1.
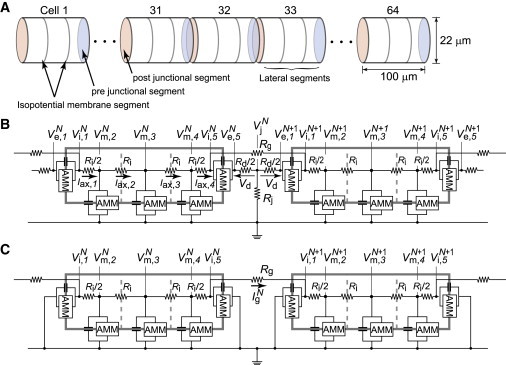
Schematic of strand model and equivalent circuits. (A) The strand model consists of myocardial cells with a cylindrical shape. The length and radius of the myocardial cell are 100 μm and 11 μm, respectively. (B and C) The equivalent circuit of the cleft and noncleft models, respectively. Each membrane segment is composed of an active membrane model (AMM) and a membrane capacitance. represents extracellular cleft potential just after the Nth cell. The values , , and represent transmembrane, intracellular, and extracellular potentials, respectively, of nth segment of the Nth cell. The values n = 1 and 5 denote junctional segments, and . The values Rg and Rj represent the gap-junctional resistance and the cleft resistance, respectively.
The intercellular clefts facing at JMs were very narrow (5 ∼25 nm) (5,7,26), and the resistance of the extracellular cleft space was thought to be higher than that of the bulk medium. Thus, an inward NaCh current generated at the JM induced a large negative extracellular potential within the narrow cleft space (18,19,24). We assumed that the adjacent cells are electrically coupled with the current through the gap junction at JM and with the change in the cleft potential (cleft model, Fig. 1 B). We also constructed a model coupled only with gap junctions (noncleft model, Fig. 1 C) to compare with the cleft model.
The whole cell membrane of each myocyte was divided into five segments; three segments of LM and two segments of JM (Fig. 1, B and C). In Fig. 1, B and C, the myoplasmic resistance (Ri) in between nodes in a myocyte was defined by
where ρmyo is the myoplasmic resistivity (150 Ω⋅cm) (13), la is the length of the LM segment (33.3 μm), and r is the radius of the myocardial cell (11 μm). A value of 395 kΩ was chosen for the gap-junctional resistance (Rg) as the control value as it was identical to the myoplasmic resistance in an entire myocardial cell (13), i.e., the gap-junctional conductance (Gg) was 2.534 μS. The radial cleft resistance (Rj) was given by
according to Katz (27), while the series axial resistance (Rd) was assumed to be
where ρext is the extracellular resistivity (150 Ω cm) (24), and w is the cleft width, which is the distance between the pre- and postjunctional membranes (pre- and post-JMs). The cleft conductance (Gj) was given by
Frequently used abbreviations and acronyms are listed in Table 1.
Table 1.
Frequently used abbreviations and acronyms
| Abbreviation | Definition |
|---|---|
| CV | Conduction velocity |
| Cx | Connexin |
| CKO | Conditional knockout |
| AP | Action potential |
| EF | Electrical field |
| NaCh | Na+ channel |
| JM | Junctional membrane facing intracellular cleft |
| LM | Lateral part of the cell membrane |
| AMM | Active membrane model |
| gNa | Control value of the entire NaCh conductance of each cell |
| %gNa,JM | NaCh conductance of JM |
| %gNa,LM | NaCh conductance of LM |
| %gNa,JM+LM | Total NaCh conductance (%gNa,JM+%gNa,LM) |
| Gg | Gap-junctional conductance |
| Gj | Cleft conductance |
| Ig | Gap-junctional current |
| Vj | Cleft potential |
Membrane model
Each segment of the cell membrane consisted of a membrane capacitance and an active membrane model (AMM) as shown in Fig. 1, B and C. The membrane dynamics was described with the AMM proposed by our group (28,29), in which the L-type calcium channel current and the values of the maximum conductance related to the potassium currents, IKr, IKs, IKp, and Ito were modified from the Luo-Rudy dynamic model (30,31) to reproduce intrinsic AP properties in the feline epicardial myocyte (32). Furthermore, the initial values of [Na]i and [Na]o were set to 12.1 and 140 mM, respectively, in this study to establish a more realistic situation (31). Specific parameters in the myofiber consisting of the AMM and initial conditions can be found in Table S1 in the Supporting Material.
The maximum conductance of NaChs per unit area was set to 16 mS/cm2 and therefore the entire NaCh conductance of each cell corresponded to ∼1.23 μS (30,31), which we defined as the control value (gNa). This value is just a standard value (16 mS/cm2) in the computer model, and this value might be larger or smaller in the pathological conditions. In this study, to investigate what effect the subcellular NaCh distribution had on AP propagation, we varied the gNa in the range around the control value, and we used two conditions, i.e.,
-
1.
All NaChs were distributed only in the JM and there were no NaChs along the LM.
-
2.
NaChs were distributed to both JM and LM.
Throughout the article, the NaCh conductances of JM and LM were expressed as a percentage of the gNa, i.e., %gNa,JM and %gNa,LM, respectively. The myofiber model with 100%gNa,JM and 50%gNa,LM, for instance, indicates that each cell had altogether an increased number (150%) of NaChs relative to the control case.
Numerical calculations
From the equivalent circuits in Fig. 1, B and C, we could derive a circuit equation (details of the derivation of the circuit equation are given in the Supporting Material). The transmembrane potential in each segment is represented by
for where Cm is the membrane capacitance with specific capacitance 1 μF/cm2, Iion (μA/μF) is the total ionic current in the AMM, and is the transmembrane current. For an arbitrary time t, all the transmembrane currents, , were obtained by solving the circuit equation with the transmembrane potentials, as an initial condition. Thereby, we could calculate all membrane potentials at time t + Δt in each segment, where Δt corresponds to the time step in the Euler method. The time step, Δt, was fixed at the value of 0.5 μs to compensate for the reduced size of the discretized space and for the acute change in the membrane potential due to the occurrence of the cleft potential. Transmembrane stimuli with a basic cycle length of 400 ms were applied to the middle lateral segment of the cell located at the fiber end. Each transmembrane stimulus had duration of 0.5 ms and strength of 300 μA/cm2, which was threefold higher than the diastolic threshold.
We defined the activation time of each cell as the time when the cell membrane depolarized and reached –30 mV from the resting potential. Then, the CV was calculated based on the activation times of the 21st and 42nd cells.
Results
Effects of subcellular NaCh distribution on AP waveform
Fig. 2, A and B, shows examples of the APs observed in the middle LM segment of the 32nd cell in the noncleft and cleft models, respectively, assuming that NaChs are only localized at the pre- and post-JMs, i.e., 100%gNa,JM and 0%gNa,LM. The noncleft model exhibited typical AP waveform for ventricular myocytes (Fig. 2 A). The AP in the cleft model, on the other hand, had smaller amplitude of phase-0 and a larger phase-2 dome (Fig. 2 B). Details on the phase-0 of the regional membrane potentials in each segment are shown in Fig. S1.
Figure 2.
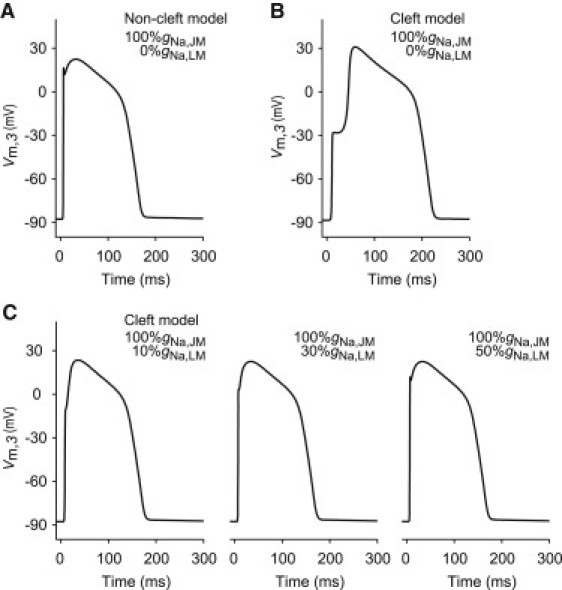
AP waveforms observed at a myocardial cell in the strand model. (A and B) AP waveforms in the noncleft and cleft models, respectively, in the case of 100%gNa,JM with 0%gNa,LM. (C) AP waveforms in the cleft models where the NaChs are fixed at 100%gNa,JM with either 10%gNa,LM (left), 30%gNa,LM (middle), or 50%gNa,LM (right). In the strand model, we employed 2.534 μS for the gap-junctional conductance (Gg) and 0.25 μS for the cleft conductance (Gj). The values %gNa,JM and %gNa,LM indicate the NaCh conductances of junctional membrane (JM) and lateral membrane (LM), respectively.
To investigate what effect the NaChs expressed in LM had on the AP waveforms, we further conducted simulations of AP propagation where NaChs were added to LM (Fig. 2 C). Then, we found that as the %gNa,LM increased step-by-step from 0% to 50% of the gNa, the APs became similar to that in the noncleft model (compare to Fig. 2 A).
Modulations of CV by subcellular NaCh distribution
The relationships between CV and the total NaCh conductance (%gNa,JM+LM = %gNa,JM + %gNa,LM) of the cell membrane in the noncleft and cleft models are shown in Fig. 3. This figure shows CV as a function of the %gNa,JM+LM when the %gNa,LM varied independently. Intriguingly, CV in the noncleft model (Fig. 3 A) was only determined by %gNa,JM+LM per cell, regardless of the subcellular NaCh distribution, whereas CV in the cleft model was largely influenced by both %gNa,JM+LM and %gNa,LM. For instance, the noncleft model with 0%gNa,LM still maintained AP propagation when %gNa,JM+LM (equal to %gNa,JM in this case) was reduced to 20%.
Figure 3.
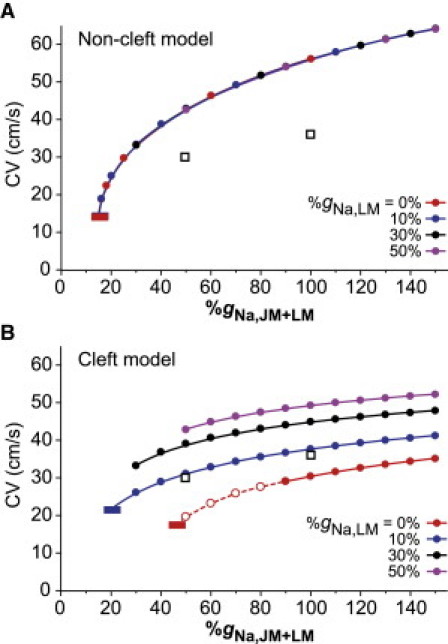
Conduction velocity (CV) as a function of total NaCh conductance (%gNa,JM+LM) by changing NaCh distribution within the cell in the noncleft (A) and cleft (B) strand models. (Dashed line with the open circles) AP propagation with a triangular AP waveform. For purpose of comparison, experimental data (36) are plotted as open squares on panels A and B. (Red and blue short horizontal bars) Threshold for conduction block. In the models, we employed 2.534 μS for the gap-junctional conductance (Gg) and 0.25 μS for the cleft conductance (Gj).
The critical CV just before conduction block was 14.0 cm/s in the case of 15%gNa,JM+LM, corresponding to one-fourth of the CV in normal condition (56.2 cm/s with 100%gNa,JM+LM). In contrast, the cleft model with 0%gNa,LM failed to propagate AP if %gNa,JM+LM (equal to %gNa,JM) was reduced to <45% (Fig. 3 B), indicating that the safety of AP propagation was more sensitive to the changes in %gNa,JM than previously thought. Moreover, the addition of NaChs to LM (compare 0%gNa,LM and 10%gNa,LM in Fig. 3 B) led to an increase in CV and a decrease in the critical value of %gNa,JM+LM causing the conduction block. These results suggest that NaChs in the LM are important to keep the CV and to ensure the robustness of AP propagation in the reduced %gNa,JM condition.
Effects of cleft conductance change on AP propagation
We first confirmed a relationship between the CV and the Gj in the cleft model with the condition that NaChs are only localized in JM as reported previously (24). (Fig. 4 A, left). If the Gg was sufficiently large, the CV decreased monotonically as the Gj was reduced. By gradually reducing the Gg, the relationship between the CV and the Gj shifted from the monophasic to biphasic behavior. An increase in the CV could be observed when the Gg was reduced to <10% of normal Gg (<0.253 μS) and the Gj was reduced to 0.5 μS, corresponding to the cleft width of ∼30 nm. Further decrease in the Gj from 0.32 to 0.125 μS caused the reduction in CV from 14 to 7 cm/s. This result agreed well with the simulation results shown by Kucera et al. (24). In addition, we found that the AP resulted in an all-or-none repolarization and loss of the AP plateau or dome (Fig. 4 A, right) when the Gj was highly reduced (dashed line with open circles in Fig. 4 A, left). Thus, in the cleft model without NaChs in LM, an excessive reduction in the Gj resulted in the marked abbreviation of the AP duration as well as in the conduction block.
Figure 4.
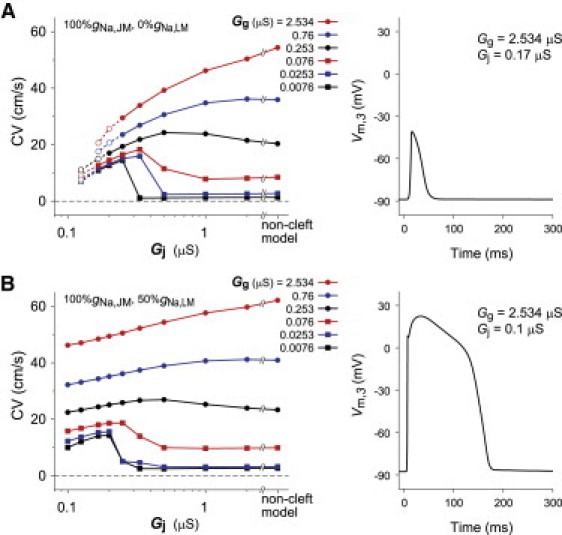
Conduction velocity (CV) as a function of cleft conductance (Gj) and AP waveforms in the case of 100%gNa,JM with 0%gNa,LM (A) and in the case of 100%gNa,JM with 50%gNa,LM (B) in the cleft model. AP waveform observed in the third segment of the 32nd cell where the cleft conductance (Gj) was set to 0.17 μS (cleft width, w = 10 nm) (A) and 0.1 μS (w = 6 nm) (B), respectively, and the gap-junctional conductance (Gg) was fixed at 2.534 μS.
In another series of simulation, the number of NaChs in LM was gradually increased to examine what impact the NaChs in LM had on AP propagation when the Gj was varied. Fig. 4 B (left) shows CV as a function of Gj in the cleft model with 100%gNa,JM and 0%gNa,LM. An almost constant CV was maintained when the Gg was relatively large and the Gj was decreased. Moreover, even if the Gj was 0.1 μS, corresponding to the cleft width of 6 nm, the propagation with the appropriate AP waveform could be maintained in the cleft model with 100%gNa,JM and 50%gNa,LM (Fig. 4 B, right). These results also suggest that the NaChs in LM increase the robustness of AP propagation under a variety of the Gj values.
AP propagation and gap-junctional conductance
Fig. 5 shows CV as a function of Gg between myocytes. As expected, the CV in the noncleft model gradually diminished with the decrease in the Gg independent of the subcellular NaCh distributions (Fig. 5 A). The critical value of Gg just before conduction block was ∼0.3% of the normal Gg, at which the Gg was the same value as the intracellular axial conductance (2.534 μS); thus, the critical CV was 0.36 cm/s. Similar to the case in the noncleft model, a monotonic decrease in the CV was observed in the cleft model with 100%gNa,JM and 0%gNa,LM as the Gg was decreased. However, the slope of the CV-Gg curve of the 100%gNa,JM case in the cleft model was more gentle and the CV at low Gg was higher (∼15 cm/s) than in the noncleft model (compare the solid red line and the gray dashed line in Fig. 5 B).
Figure 5.
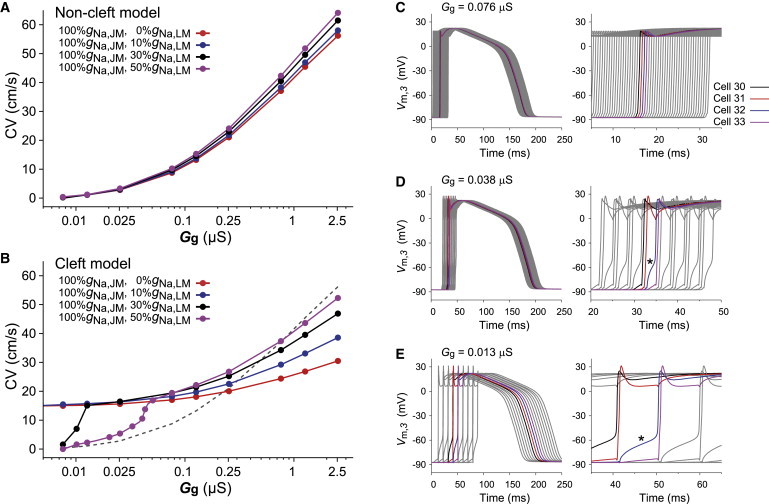
Conduction velocity (CV) as a function of gap-junctional conductance (Gg) in the noncleft (A) and cleft (B) strand models and change in qualitative properties of AP propagation observed in the case of 100%gNa,JM with 50%gNa,LM in the cleft model when the gap-junctional conductance (Gg) is decreased (C–E). For comparison, the dashed line in panel B represents the CV in the case of 100%gNa,JM with 0%gNa,LM in the noncleft model (red line in panel A). (C–E) The AP waveforms (left) and the enlarged diagrams at the phase-0 of APs (right), respectively. In the cleft model, we fixed the cleft conductance (Gj) at 0.25 μS, corresponding to the cleft width of 15 nm.
Furthermore, we confirmed that even in the absence of gap-junctional coupling, the CV was maintained at 14.7 cm/s. For comparison, we investigated the effect of the subcellular NaCh distribution on CV under the condition that the total number of NaChs per cell was kept constant at the control value of gNa. As shown in Fig. S2, not a decrease in %gNa,JM but an increase in %gNa,LM resulted in the steeper slope of the CV-Gg curve at low Gg. These results indicate that localizing sufficient NaChs to JM is required to maintain CV when Gg is highly reduced.
In the cleft model with 100%gNa,JM and 0%gNa,LM, the CV for normal Gg was no more than a half of that in the noncleft model. Adding NaChs to the LM increased the CV under normal Gg. By increasing the NaChs to 50%gNa,LM, the CV came close to the physiological range in the longitudinal direction of ventricular myofiber (50–60 cm/s). A reduction in Gg under the condition with 100%gNa,JM and 50%gNa,LM also resulted in decreased CV, but an abrupt reduction in CV was observed when Gg was highly reduced (black and purple lines, Fig. 5 B). In the case of the abrupt reduction in CV, we observed the alternating pattern of long and short conduction delays (Fig. 5, C–E), suggesting the gap-junctional mechanism with the periodic and intermittent dysfunction of the EF mechanism contributed to this phenomenon.
To understand the mechanism of the slowing of AP propagation, how the reduced Gg influences the cleft potential between adjacent cells should be clarified. The amplitude of the gap-junctional current (Ig) reduced monotonically as the Gg decreased (Fig. S3 A). In the cases of 100%gNa,JM with 0–10%gNa,LM in the cleft model (red and blue lines in Fig. S3 B), the minimal value of the cleft potential (Vj) shifted more negatively as the Gg decreased. We confirmed in this study that such the marked negative cleft potential resulted in the activation of NaChs of the post-JM and thus resulted in the prevention of significant conduction delay (CV was kept at ∼15 cm/s, as shown in Fig. 5 B) due to the EF mechanism. In contrast, when the NaCh in LM sufficiently increased (≥30%gNa,LM), the cleft potential showed a significant increase under the condition of low Gg (see black and purple lines in Fig. S3 B) (this mechanism is also discussed in the Supporting Material). Such high cleft potential caused the reduction of the NaCh current in the post-JM (see black and purple lines in Fig. S3 C) and the slow depolarization of the cell membrane (see asterisks in Fig. 5, D and E), resulting in the slowing of AP propagation.
Finally, we additionally conducted similar simulations with larger cell size ( in width and in length), of which surface membrane area was twice that of the control cell. Then we found in the noncleft model with 100%gNa,JM and 0%gNa,LM that the larger cell size led to the increase in CV (compare the dashed line and the solid line in Fig. 6 A). In contrast, the CV in the cleft model with 100%gNa,JM and 0%gNa,LM was reduced by the increase in the cell size because the AP propagation via EF mechanism was markedly influenced by the subcellular NaCh distribution (Fig. 6 B). However, by adding the NaChs to the LM in the cleft model with 100%gNa,JM and 50%gNa,LM (Fig. 6 C), the relationship between the CV and the cell size was quite similar to that in the noncleft model (compare to Fig. 6 A).
Figure 6.
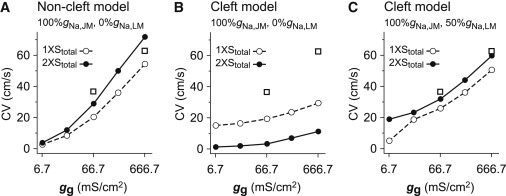
Effect of cell size on conduction velocity (CV) in the noncleft (A) and cleft (B and C) myofiber models. CV as a function of gap junctional conductance (gg) in the noncleft (A) and cleft (B) models with 100%gNa,JM and 0%gNa,LM, and in the cleft model (C) with 100%gNa,JM and 50%gNa,LM. (Dashed and solid lines) gg-CV relationship curve in the normal cell size case (100 μm in length and 22 μm in width) and that in the larger cell size case ( in length and in width), respectively. In the larger cell, the total surface membrane area in a cell, Stotal, was twice that of the normal cell. In this simulation, we assumed that the gg at the JM in the larger cell was equal to that in the normal cell. For purpose of comparison, experimental data (16) are plotted as open squares on panels A–C.
Discussion
A number of theoretical studies previously investigated the nature of AP propagation in myofiber. For example, Sperelakis and co-workers (18,19) proposed the EF mechanism as a mechanism of AP propagation without gap-junctional coupling, and they demonstrated that the AP could propagate from cell to cell via the EF mechanism alone. Kucera et al. (24) raised the possibility that when NaChs were localized at JM, the EF mechanism contributes to AP propagation together with gap-junctional mechanism. Mori et al. (33) evaluated the effect of the intercellular cleft conductance on CV.
These theoretical studies mainly focused on the microstructural characteristics of intercellular cleft in the myofiber, and on the role of EF mechanism under physiological condition. On the other hand, our objective of this study was to clarify the roles of the subcellular NaCh distribution in AP propagation. In particular, we focused on the role of NaChs of the LM in AP propagation under the existence of EF mechanism. Then we found that the NaChs in the LM were responsible for both increasing CV and ensuring the robustness of AP propagation under conditions of low gap-junctional coupling. Based on these results, we concluded that the NaChs in the LM might be important for the homeostatic excitation propagation in both the physiological and pathological conditions.
AP propagation based on EF mechanism
To elucidate whether AP propagation depends only on the gap-junctional mechanism (Fig. 1 C), we first investigated the relationship between the subcellular NaCh distribution and the CV. Fig. 3 A demonstrates that the CV in the noncleft model is only determined by the total number of NaChs per cell independent of the number of NaChs expressed in LM. Spach et al. (25) also numerically confirmed that the alteration of subcellular NaCh distribution had no significant effect on the CV. However, in this study, when we incorporated the detailed microstructures of myofiber (such as cleft between cells and intercalated disk) into the model (Fig. 1 B), the subcellular NaCh distribution had surprising effects on AP propagation. The roles of such microstructures on AP propagation can be explained by the EF mechanism (18,19), together with the gap-junctional mechanism.
Subcellular NaCh distribution and AP waveform
The subcellular NaCh distribution in the cleft model altered the AP waveform (Figs. 2 and 4). When all NaChs were localized to JM, the AP waveform differed from the typically observed one in the ventricular epicardial single myocyte (34,35). The reason for this might be explained as follows. The alteration of the cleft potential based on the EF mechanism gave rise to the decrease in the driving force of the NaCh current in the post-JM (24). The decrease in the potential difference between the pre- and post-JMs due to the simultaneous supra-threshold depolarization of their JMs (see Fig. S1 A) reduced the current flowing through the gap junction. The intracellular axial current, consisting of both the gap-junctional current and the inward NaCh current in the post-JM, commonly depolarizes the local membrane (i.e., the LM segments) and generates an axial current to act on the pre-JM of the adjacent cell. Therefore, the intracellular axial current was reduced and this could not provide sufficient current to depolarize the adjacent cell.
Another reason for the reduction in the intracellular axial current is the high cleft resistance, resulting from the extremely narrow clefts. Such high cleft resistance induced the large negative extracellular potential and at the same time prevented the influx of NaCh current from the extracellular cleft space. Therefore, the phase-0 amplitude in AP decreased (Figs. 2 B and 4 A, right). On the other hand, the inward NaCh current at the LM boosted the local current and increased the intracellular axial current, causing the sufficient depolarization of the LM. Thereby, the normal AP in ventricular myocyte was formed (Figs. 2 C and 4 B, right).
Modulation of AP propagation by subcellular NaCh distribution
A previous experimental study (36) reported that the CV in the Scn5a heterozygous young mice, of which NaCh conductance was 50% of the control value (37), led to the decrease in CV by 16.9% (from 36.2 to 30.1 cm/s). As shown in Fig. 3 A, the half-NaCh conductance (50%gNa,JM+LM) in the noncleft model caused the decrease in CV by 23.4% (from 54.3 to 41.6 cm/s), of which value was much larger than that in the experimental study (36). Such discrepancy between the experimental and simulation studies can be reduced by the use of the cleft model, which can reproduce the realistic AP propagation through both the gap-junctional and EF mechanisms. As shown in Fig. 3 B, when 10% of the gNa was expressed at LM, the half-NaCh conductance resulted in the decrease in CV by 17.2% (from 37.7 to 31.2 cm/s), corresponding to the aforementioned experimental data (36).
The changes in CV in response to Gg suggest that the NaChs located at JM and LM play different roles in the modulation of CV. As shown in Fig. 5, A and B, the CV in the cleft model was less sensitive to Gg than in the noncleft model. Furthermore, we found that the addition of NaChs to LM increased the sensitivity of the CV to Gg in the cleft model. To confirm whether this characteristic response resulted from the increase in total NaCh number or the change in NaCh distribution itself, we conducted additional simulations, Fig. S2, and found that the tendency was essentially the same as Fig. 5 B. Therefore, we can conclude that the NaChs in LM compensate for the slowing CV by a decrease in Gg via the EF mechanism. Comparing with Fig. 5 B and Fig. S2, we additionally found that this compensation was stronger when the NaChs were abundant in JM (intercalated disk). This result was in agreement with the simulation results obtained by Kucera et al. (24).
Our results may explain the reduced CV in Cx43 CKO mice. Because the Gg in Cx43 CKO mice is decreased to <10% of the Gg in wild-type (17), the CV is expected to be approximately one-third of the wild-type, according to the cable theory (38). However, the actual CV measured by Gutstein et al. (16) was approximately half of that of wild-type within either the longitudinal or the transversal directions of the myofiber. In fact, in this study, the CV was decreased to approximately one-half and approximately one-third of the control value in the cleft and noncleft models, respectively (Fig. 5 B). Therefore, in an actual myocardial tissue, the EF mechanism could serve to prevent the reduction of the CV by the decrease in Gg.
If all NaChs locating in JM is the case, the CV would be kept at 15 cm/s even without gap-junctional current, i.e., Gg = 0 μS (Fig. 5 B). However, Beauchamp et al. (39) demonstrated that the conduction block occurred by both the knockout of Cx43 and the pharmacological block of Cx45, and they concluded that the EF mechanism does not contribute to the mechanism of AP propagation. As shown in this simulation study, when sufficient NaChs are expressed in LM (>30%gNa,LM) in the cleft model, the contribution of EF mechanism decreased due to a reduction of the cleft potential amplitude (Fig. S3 B) and thus the conduction block could be reproduced (black and purple lines in Fig. 5 B). Therefore, the results of our study suggest the possibility, without conflicting with Beauchamp et al. (39), that the EF mechanism can contribute to the AP propagation.
Effect of cell size on AP propagation
Previous studies (25,40–42) have shown that AP propagation in cardiac tissues under the physiological and/or pathophysiological conditions was highly influenced by both size and shape of the myocardial cells. As shown in Fig. 6 B, the localization of NaCh to the JM in the cleft model led to an inverse effect of the increase in cell size on the CV in contrast with the noncleft model. This is due to both the reduction in the number of NaChs of JM and the reduction in LM excitability. However, in the same cleft model but with the addition of NaChs to LM, the CV in the myofiber composed of larger cells was higher than that in the case of normal cell size (Fig. 6 C). This result further supports our finding that the presence of NaChs in LM plays an important role in the AP propagation. Nevertheless, further studies will be required because the effect of the cell size on AP propagation in the cleft model is far more complicated than that in the noncleft model.
Limitations of the model
In addition to the localization of NaCh to the JM, other ion channel and transporter proteins are also distributed in the JM, such as voltage-gated K+ channels (43,44), Na+ pump (Na+/K+-ATPase) (45), and Na+-Ca2+ exchanger (46). However, we did not take into account the localization of their ion channels and transporters to the JM. Such ion channels and transporters might have some effects on CV via the change of ion concentration in the intercellular cleft space (33).
Physiological implications
The existence of NaCh at LM was experimentally confirmed by several studies (20–23). However, the role of NaChs at LM is still controversial. Maier et al. (21) stated the possibility that the NaChs at transverse tubule (LM segment) make the myocyte more excitable, thereby strengthening the contraction via excitation-contraction coupling. On the other hand, Brette and Orchard (47) reported that NaChs at transverse tubule did not change the calcium transient and therefore the NaChs had no effect on excitation-contraction coupling. In this study, we found, to our knowledge, a novel role of NaChs at LM in increasing the robustness of the AP propagation. Our simulations clearly showed that the NaChs in the LM act as a booster for the intracellular axial current. Furthermore, in order for the EF mechanism (cleft model) to coexist with a normal prediction of the physiological AP waveform (compare Fig. 2, B and C), the existence of NaChs at LM is indispensable. From the point of view of CV, the NaChs at LM are necessary for the cleft model to reproduce the physiological CV at ∼60 cm/s in the longitudinal direction of the myofiber.
Clinical implications
The APs with insufficient depolarization from phase-0 to phase-2 of the AP (Fig. 2 B) and with a marked abbreviation of the AP duration (Fig. 4 A, right) by the decrease of NaChs in the LM evoke the change of AP morphology commonly observed in patients with the Brugada syndrome (48,49). In fact, Mohler et al. (22) and Lowe et al. (50) have suggested the possibility that gene mutation in ankyrin-binding motif of the NaCh causing the decrease of NaChs at cell membrane in ventricular myocytes was associated with Brugada syndrome.
Furthermore, immunohistochemical staining by Baba et al. (23) revealed that NaChs of myocytes in the infarct-border zone are localized in intercalated disk (JM) rather than in LM, whereas those in the normal zone are homogeneously distributed throughout the entire cell membrane. Based on the results of this study, such inhomogeneous change in NaCh distribution (the decrease of NaChs in LM) could avoid conduction block at low Gg condition produced by ischemia (compare purple line and red line in Fig. 5 B), resulting in the homeostasis of AP propagation. This also implies that the NaCh blockade (class I antiarrhythmic drug) in the ischemic myocardium might cause conduction block (Fig. 3 B), leading to a more arrhythmogenic condition.
Acknowledgments
The authors thank Dr. Rachid Ait-Haddou and Prof. Taishin Nomura for their useful comments.
This study was supported by the Global COE Program “in silico medicine” at Osaka University; the Institute of Seizon and Life Science; and Ministry of Education, Culture, Sports, Science and Technology of Japan (Grant-in-Aid for Scientific Research on Innovative Areas No. 22136002).
Footnotes
This is an Open Access article distributed under the terms of the Creative Commons-Attribution Noncommercial License (http://creativecommons.org/licenses/by-nc/2.0/), which permits unrestricted noncommercial use, distribution, and reproduction in any medium, provided the original work is properly cited.
Contributor Information
Kunichika Tsumoto, Email: tsumoto@pharma2.med.osaka-u.ac.jp.
Yoshihisa Kurachi, Email: ykurachi@pharma2.med.osaka-u.ac.jp.
Supporting Material
References
- 1.Rüdisüli A., Weingart R. Electrical properties of gap junction channels in guinea-pig ventricular cell pairs revealed by exposure to heptanol. Pflugers Arch. 1989;415:12–21. doi: 10.1007/BF00373136. [DOI] [PubMed] [Google Scholar]
- 2.de Groot J.R., Veenstra T., Verheijck E.E. Conduction slowing by the gap junctional uncoupler carbenoxolone. Cardiovasc. Res. 2003;60:288–297. doi: 10.1016/j.cardiores.2003.07.004. [DOI] [PubMed] [Google Scholar]
- 3.Kléber A.G., Riegger C.B., Janse M.J. Electrical uncoupling and increase of extracellular resistance after induction of ischemia in isolated, arterially perfused rabbit papillary muscle. Circ. Res. 1987;61:271–279. doi: 10.1161/01.res.61.2.271. [DOI] [PubMed] [Google Scholar]
- 4.Kieval R.S., Spear J.F., Moore E.N. Gap junctional conductance in ventricular myocyte pairs isolated from postischemic rabbit myocardium. Circ. Res. 1992;71:127–136. doi: 10.1161/01.res.71.1.127. [DOI] [PubMed] [Google Scholar]
- 5.Hoyt R.H., Cohen M.L., Saffitz J.E. Distribution and three-dimensional structure of intercellular junctions in canine myocardium. Circ. Res. 1989;64:563–574. doi: 10.1161/01.res.64.3.563. [DOI] [PubMed] [Google Scholar]
- 6.Smith J.H., Green C.R., Severs N.J. Altered patterns of gap junction distribution in ischemic heart disease. An immunohistochemical study of human myocardium using laser scanning confocal microscopy. Am. J. Pathol. 1991;139:801–821. [PMC free article] [PubMed] [Google Scholar]
- 7.Yeager M. Structure of cardiac gap junction intercellular channels. J. Struct. Biol. 1998;121:231–245. doi: 10.1006/jsbi.1998.3972. [DOI] [PubMed] [Google Scholar]
- 8.Cooklin M., Wallis W.R.J., Fry C.H. Changes in cell-to-cell electrical coupling associated with left ventricular hypertrophy. Circ. Res. 1997;80:765–771. doi: 10.1161/01.res.80.6.765. [DOI] [PubMed] [Google Scholar]
- 9.Poelzing S., Rosenbaum D.S. Altered connexin43 expression produces arrhythmia substrate in heart failure. Am. J. Physiol. Heart Circ. Physiol. 2004;287:H1762–H1770. doi: 10.1152/ajpheart.00346.2004. [DOI] [PubMed] [Google Scholar]
- 10.Spragg D.D., Akar F.G., Kass D.A. Abnormal conduction and repolarization in late-activated myocardium of dyssynchronously contracting hearts. Cardiovasc. Res. 2005;67:77–86. doi: 10.1016/j.cardiores.2005.03.008. [DOI] [PubMed] [Google Scholar]
- 11.Spach M.S., Miller W.T., 3rd, Johnson E.A. The discontinuous nature of propagation in normal canine cardiac muscle. Evidence for recurrent discontinuities of intracellular resistance that affect the membrane currents. Circ. Res. 1981;48:39–54. doi: 10.1161/01.res.48.1.39. [DOI] [PubMed] [Google Scholar]
- 12.Rudy Y., Quan W.L. A model study of the effects of the discrete cellular structure on electrical propagation in cardiac tissue. Circ. Res. 1987;61:815–823. doi: 10.1161/01.res.61.6.815. [DOI] [PubMed] [Google Scholar]
- 13.Shaw R.M., Rudy Y. Ionic mechanisms of propagation in cardiac tissue. Roles of the sodium and L-type calcium currents during reduced excitability and decreased gap junction coupling. Circ. Res. 1997;81:727–741. doi: 10.1161/01.res.81.5.727. [DOI] [PubMed] [Google Scholar]
- 14.Ya J., Erdtsieck-Ernste E.B., Lamers W.H. Heart defects in connexin43-deficient mice. Circ. Res. 1998;82:360–366. doi: 10.1161/01.res.82.3.360. [DOI] [PubMed] [Google Scholar]
- 15.Morley G.E., Vaidya D., Jalife J. Characterization of conduction in the ventricles of normal and heterozygous Cx43 knockout mice using optical mapping. J. Cardiovasc. Electrophysiol. 1999;10:1361–1375. doi: 10.1111/j.1540-8167.1999.tb00192.x. [DOI] [PubMed] [Google Scholar]
- 16.Gutstein D.E., Morley G.E., Fishman G.I. Conduction slowing and sudden arrhythmic death in mice with cardiac-restricted inactivation of connexin43. Circ. Res. 2001;88:333–339. doi: 10.1161/01.res.88.3.333. [DOI] [PMC free article] [PubMed] [Google Scholar]
- 17.Yao J.A., Gutstein D.E., Wit A.L. Cell coupling between ventricular myocyte pairs from connexin43-deficient murine hearts. Circ. Res. 2003;93:736–743. doi: 10.1161/01.RES.0000095977.66660.86. [DOI] [PubMed] [Google Scholar]
- 18.Sperelakis N., Mann J.E., Jr. Evaluation of electric field changes in the cleft between excitable cells. J. Theor. Biol. 1977;64:71–96. doi: 10.1016/0022-5193(77)90114-x. [DOI] [PubMed] [Google Scholar]
- 19.Sperelakis N., McConnell K. Electric field interactions between closely abutting excitable cells. IEEE Eng. Med. Biol. Mag. 2002;21:77–89. doi: 10.1109/51.993199. [DOI] [PubMed] [Google Scholar]
- 20.Cohen S.A. Immunocytochemical localization of rH1 sodium channel in adult rat heart atria and ventricle. Presence in terminal intercalated disks. Circulation. 1996;94:3083–3086. doi: 10.1161/01.cir.94.12.3083. [DOI] [PubMed] [Google Scholar]
- 21.Maier S.K.G., Westenbroek R.E., Catterall W.A. An unexpected role for brain-type sodium channels in coupling of cell surface depolarization to contraction in the heart. Proc. Natl. Acad. Sci. USA. 2002;99:4073–4078. doi: 10.1073/pnas.261705699. [DOI] [PMC free article] [PubMed] [Google Scholar]
- 22.Mohler P.J., Rivolta I., Bennett V. Nav1.5 E1053K mutation causing Brugada syndrome blocks binding to ankyrin-G and expression of Nav1.5 on the surface of cardiomyocytes. Proc. Natl. Acad. Sci. USA. 2004;101:17533–17538. doi: 10.1073/pnas.0403711101. [DOI] [PMC free article] [PubMed] [Google Scholar]
- 23.Baba S., Dun W., Boyden P.A. Remodeling in cells from different regions of the reentrant circuit during ventricular tachycardia. Circulation. 2005;112:2386–2396. doi: 10.1161/CIRCULATIONAHA.105.534784. [DOI] [PMC free article] [PubMed] [Google Scholar]
- 24.Kucera J.P., Rohr S., Rudy Y. Localization of sodium channels in intercalated disks modulates cardiac conduction. Circ. Res. 2002;91:1176–1182. doi: 10.1161/01.res.0000046237.54156.0a. [DOI] [PMC free article] [PubMed] [Google Scholar]
- 25.Spach M.S., Heidlage J.F., Barr R.C. Electrophysiological effects of remodeling cardiac gap junctions and cell size: experimental and model studies of normal cardiac growth. Circ. Res. 2000;86:302–311. doi: 10.1161/01.res.86.3.302. [DOI] [PubMed] [Google Scholar]
- 26.Severs N.J. Cardiac muscle cell interaction: from microanatomy to the molecular make-up of the gap junction. Histol. Histopathol. 1995;10:481–501. [PubMed] [Google Scholar]
- 27.Katz B. McGraw-Hill; New York: 1966. Nerve, Muscle and Synapse. [Google Scholar]
- 28.Suzuki S., Murakami S., Kurachi Y. In silico risk assessment for drug-induction of cardiac arrhythmia. Prog. Biophys. Mol. Biol. 2008;98:52–60. doi: 10.1016/j.pbiomolbio.2008.05.003. [DOI] [PubMed] [Google Scholar]
- 29.Findlay I., Suzuki S., Kurachi Y. Physiological modulation of voltage-dependent inactivation in the cardiac muscle L-type calcium channel: a modeling study. Prog. Biophys. Mol. Biol. 2008;96:482–498. doi: 10.1016/j.pbiomolbio.2007.07.002. [DOI] [PubMed] [Google Scholar]
- 30.Luo C.H., Rudy Y. A dynamic model of the cardiac ventricular action potential. I. Simulations of ionic currents and concentration changes. Circ. Res. 1994;74:1071–1096. doi: 10.1161/01.res.74.6.1071. [DOI] [PubMed] [Google Scholar]
- 31.Faber G.M., Rudy Y. Action potential and contractility changes in [Na+]i overloaded cardiac myocytes: a simulation study. Biophys. J. 2000;78:2392–2404. doi: 10.1016/S0006-3495(00)76783-X. [DOI] [PMC free article] [PubMed] [Google Scholar]
- 32.Aiba T., Shimizu W., Sunagawa K. Cellular and ionic mechanism for drug-induced long QT syndrome and effectiveness of verapamil. J. Am. Coll. Cardiol. 2005;45:300–307. doi: 10.1016/j.jacc.2004.09.069. [DOI] [PubMed] [Google Scholar]
- 33.Mori Y., Fishman G.I., Peskin C.S. Ephaptic conduction in a cardiac strand model with 3D electrodiffusion. Proc. Natl. Acad. Sci. USA. 2008;105:6463–6468. doi: 10.1073/pnas.0801089105. [DOI] [PMC free article] [PubMed] [Google Scholar]
- 34.Osaka T., Kodama I., Yamada K. Effects of activation sequence and anisotropic cellular geometry on the repolarization phase of action potential of dog ventricular muscles. Circulation. 1987;76:226–236. doi: 10.1161/01.cir.76.1.226. [DOI] [PubMed] [Google Scholar]
- 35.Aiba T., Shimizu W., Sunagawa K. Transmural heterogeneity of the action potential configuration in the feline left ventricle. Circ. J. 2003;67:449–454. doi: 10.1253/circj.67.449. [DOI] [PubMed] [Google Scholar]
- 36.van Veen T.A.B., Stein M., van Rijen H.V. Impaired impulse propagation in Scn5a-knockout mice: combined contribution of excitability, connexin expression, and tissue architecture in relation to aging. Circulation. 2005;112:1927–1935. doi: 10.1161/CIRCULATIONAHA.105.539072. [DOI] [PubMed] [Google Scholar]
- 37.Papadatos G.A., Wallerstein P.M.R., Grace A.A. Slowed conduction and ventricular tachycardia after targeted disruption of the cardiac sodium channel gene Scn5a. Proc. Natl. Acad. Sci. USA. 2002;99:6210–6215. doi: 10.1073/pnas.082121299. [DOI] [PMC free article] [PubMed] [Google Scholar]
- 38.Arnsdorf M.F., Makielski J.C. Excitability and impulse propagation. In: Kurachi Y., Terzic A., Cohen M.V., Sperelakis N., editors. Heart Physiology and Pathophysiology. 4th Ed. California Academic Press; Millbrae, CA: 2001. pp. 99–132. [Google Scholar]
- 39.Beauchamp P., Choby C., Kléber A.G. Electrical propagation in synthetic ventricular myocyte strands from germline connexin43 knockout mice. Circ. Res. 2004;95:170–178. doi: 10.1161/01.RES.0000134923.05174.2f. [DOI] [PubMed] [Google Scholar]
- 40.Joyner R.W. Effects of the discrete pattern of electrical coupling on propagation through an electrical syncytium. Circ. Res. 1982;50:192–200. doi: 10.1161/01.res.50.2.192. [DOI] [PubMed] [Google Scholar]
- 41.Kucera J.P., Rudy Y. Mechanistic insights into very slow conduction in branching cardiac tissue: a model study. Circ. Res. 2001;89:799–806. doi: 10.1161/hh2101.098442. [DOI] [PubMed] [Google Scholar]
- 42.Satoh H., Delbridge L.M.D., Bers D.M. Surface/volume relationship in cardiac myocytes studied with confocal microscopy and membrane capacitance measurements: species-dependence and developmental effects. Biophys. J. 1996;70:1494–1504. doi: 10.1016/S0006-3495(96)79711-4. [DOI] [PMC free article] [PubMed] [Google Scholar]
- 43.Barry D.M., Trimmer J.S., Nerbonne J.M. Differential expression of voltage-gated K+ channel subunits in adult rat heart. Relation to functional K+ channels? Circ. Res. 1995;77:361–369. doi: 10.1161/01.res.77.2.361. [DOI] [PubMed] [Google Scholar]
- 44.Mays D.J., Foose J.M., Tamkun M.M. Localization of the Kv1.5 K+ channel protein in explanted cardiac tissue. J. Clin. Invest. 1995;96:282–292. doi: 10.1172/JCI118032. [DOI] [PMC free article] [PubMed] [Google Scholar]
- 45.McDonough A.A., Zhang Y., Frank J.S. Subcellular distribution of sodium pump isoform subunits in mammalian cardiac myocytes. Am. J. Physiol. 1996;270:C1221–C1227. doi: 10.1152/ajpcell.1996.270.4.C1221. [DOI] [PubMed] [Google Scholar]
- 46.Kieval R.S., Bloch R.J., Lederer W.J. Immunofluorescence localization of the Na-Ca exchanger in heart cells. Am. J. Physiol. 1992;263:C545–C550. doi: 10.1152/ajpcell.1992.263.2.C545. [DOI] [PubMed] [Google Scholar]
- 47.Brette F., Orchard C.H. No apparent requirement for neuronal sodium channels in excitation-contraction coupling in rat ventricular myocytes. Circ. Res. 2006;98:667–674. doi: 10.1161/01.RES.0000209963.02720.70. [DOI] [PubMed] [Google Scholar]
- 48.Brugada P., Brugada J. Right bundle branch block, persistent ST segment elevation and sudden cardiac death: a distinct clinical and electrocardiographic syndrome. A multicenter report. J. Am. Coll. Cardiol. 1992;20:1391–1396. doi: 10.1016/0735-1097(92)90253-j. [DOI] [PubMed] [Google Scholar]
- 49.Kurita T., Shimizu W., Kosakai Y. The electrophysiologic mechanism of ST-segment elevation in Brugada syndrome. J. Am. Coll. Cardiol. 2002;40:330–334. doi: 10.1016/s0735-1097(02)01964-2. [DOI] [PubMed] [Google Scholar]
- 50.Lowe J.S., Palygin O., Mohler P.J. Voltage-gated Nav channel targeting in the heart requires an ankyrin-G dependent cellular pathway. J. Cell Biol. 2008;180:173–186. doi: 10.1083/jcb.200710107. [DOI] [PMC free article] [PubMed] [Google Scholar]
Associated Data
This section collects any data citations, data availability statements, or supplementary materials included in this article.