

Abstract
Endophilin, which participates in membrane vesiculation during receptor-mediated endocytosis, is a ∼40 kDa SH3 domain-containing protein that binds to the proline/arginine-rich domain of dynamin, a ∼100 kDa GTPase that is essential for endocytic membrane scission. It has been suggested that endophilin is monomeric in the cytoplasm and dimerizes only after it binds to membranes (or perhaps to dimers or tetramers of dynamin). To clarify this issue, we studied the oligomeric state of endophilin both in vitro using analytical ultracentrifugation and fluorescence anisotropy, and in living cells using two-photon fluorescence fluctuation spectroscopy. We analyzed the fluctuation data using the Q-analysis method, which allowed us to determine the intrinsic brightness of the labeled protein complexes and hence its aggregation state in the cytoplasmic regions of the cell. Although a relatively high Kd (∼5–15 μM) was observed in vitro, the cell measurements indicate that endophilin is dimeric in the cytoplasm, even at submicromolar concentrations. We also demonstrate that endophilin significantly enhances the assembly of dynamin, and that this enhancement is proportional to the fraction of dimeric endophilin that is present. Moreover, there is correlation between the concentrations of endophilin that promote dynamin self-assembly and those that stimulate dynamin GTPase activity. These findings support the view that endophilin-dynamin interactions play an important role in endocytosis.
Introduction
Endophilins are a family of proteins that are believed to induce and/or stabilize membrane curvature in the endocytic pathway. There are two classes of endophilins: class A and class B (1). Class A comprises endophilin A1 (neuronal), A2 (ubiquitously expressed), and A3 (enriched in neurons and testes). Two endophilin class B proteins, B1 and B2, have also been identified. All forms of endophilin contain N-BAR domains, which consist of an N-terminal amphipathic α-helix, also termed helix 0 (residues 1–26 in endophilin A2) followed by a Bin/Amphiphysin/Rvs-homology (BAR) domain (residues 27–246 in endophilin A2) that dimerizes into a crescent-shaped structure (2) (see Fig. 1). Helix 0 penetrates the membrane and is required for initial membrane binding of endophilin (3–5). BAR domains may then stabilize this curvature, as they form positively charged surfaces upon dimerization that interact with negatively charged lipids (6,7). Endophilins also contain C-terminal src homology 3 (SH3) domains that are connected to the BAR domains by variable-length linker regions. Recently, Wang et al. (8) presented a model based on small-angle x-ray scattering (SAXS) that placed the SH3 domains at the extreme ends of the full-length endophilin A1 dimer (Fig. 1 B).
Figure 1.
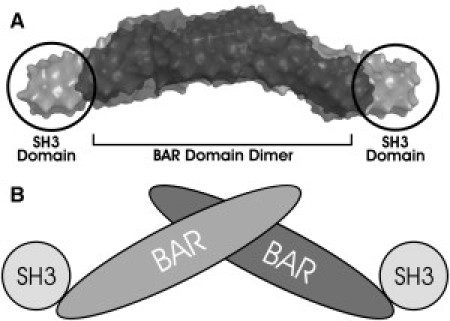
(A) SAXS reconstruction of endophilin A1 dimer showing BAR and SH3 domains. (B) Cartoon of dimer endophilin A1 structure. Modified from Wang et al. (8).
The SH3 domains of endophilin bind to the C-terminal pro/arg-rich domains (PRDs) of dynamins, a family of large (∼100 kDa) GTPases that assemble around the necks of vesiculating membranes and promote their scission (9). Mammalian cells express three forms of dynamins: dynamin 1, which is expressed primarily in neurons and has been shown to be important in rapid synaptic vesicle recycling (10); dynamin 2, which is ubiquitously expressed and functions in receptor-mediated endocytosis, Golgi budding, and cytoskeletal organization; and dynamin 3, which is enriched in testes and lungs, and also participates in postsynaptic remodeling during neuronal activity (11,12). The similar tissue distributions of dynamin 1 and endophilin A1, dynamin 2 and endophilin A2, and dynamin 3 and endophilin A3 prompted the suggestion that these isoform pairs function together in the cell (13).
Assembly of dynamins is essential not only for their mechanical function in membrane constriction and scission but also for expression of their GTPase activity. Upon dilution into low-salt (<50 mM) buffers, dynamins self-associate in a concentration-dependent manner into rings and coils that are similar in appearance to structures that form around the necks of budding vesicles (14,15). Dynamin 2 has a much greater propensity to self-assemble than dynamin 1, and does so at lower protein concentrations and higher ionic strengths (16). Assembly of both forms of dynamin is facilitated by binding to microtubules (17) or anionic liposomes (18), which serve as scaffolds to concentrate the dynamins on their surface. Molecules that cross-link dynamins, including antidynamin antibodies (19) and dimeric glutathione-S-transferases (GST)-SH3 fusion proteins (20–22), also promote dynamin assembly, but to a lesser extent than do multimeric scaffolds.
In this investigation, we focused on the interaction of endophilin A2 with dynamin 2 and sought to determine whether endophilin can facilitate dynamin assembly and thereby enhance dynamin GTPase activity. Previous studies suggested that endophilin A1 is a weak inhibitor of the concentration-dependent GTPase activity of dynamin 1 (23). Amphiphysin, another dynamin-binding protein that contains both N-BAR and SH3 domains, has essentially no effect on dynamin 1 GTPase activity in the absence of a scaffold, and stimulates or inhibits dynamin 1 GTPase activity in the presence of large or small unilamellar vesicles, respectively (23). Here, we used sedimentation, turbidity, and GTPase assays to examine the effects of endophilin A2 on dynamin 2 assembly. To better understand the underlying mechanism for these effects, we also characterized endophilin A2 dimerization in vitro using analytical ultracentrifugation (AUC) and fluorescence anisotropy, and in living cells using fluorescence fluctuation spectroscopy (FFS).
Materials and Methods
Expression and purification of dynamin 2
The procedures used for construction of the cDNA encoding carboxyl-terminal His6-tagged dynamin 2 (rat, isoform 2ba), generation of recombinant viruses in Sf9 cells, and purification of recombinant dynamin from infected Sf9 cells were described previously (24).
Cells
CV-1 cells were obtained from the American Type Culture Collection (Manassas, VA) and maintained in 10% fetal bovine serum (Invitrogen, Carlsbad, CA) and Dulbecco's modified Eagle's medium (Biowhittaker, Walkersville, MD). The cells were subcultured into eight-well coverglass chamber slides (Nalgene Nunc International, Rochester, NY) and then transiently transfected with Transfectin (Bio-Rad, Hercules, CA) according to the manufacturer's instructions. Before measurements were obtained, the growth media were removed and replaced with Leibovitz L15 (Invitrogen). All measurements were performed in the cell cytoplasm.
GTPase measurements
Dynamin GTPase activities were measured by release of 32Pi from [γ-32P]GTP after incubation at 22°C or 37°C in a solution containing 20 mM HEPES, pH 7.5, 75 mM NaCl, 2 mM MgCl2, and 1 mM GTP in a total volume of 50 μL in the presence of various concentrations of endophilins A1 or A2 or the endophilin A2 BAR domain. Reactions were terminated by addition of 750 μL of 5% (w/v) activated charcoal in 50 mM NaH2PO4 (4°C) as described previously (25). Charcoal was removed by centrifugation, and the radioactivity of the 600 μL supernatant was measured by scintillation counting. To prepare liposomes, phosphatidylcholine (PC) and phosphatidylinositol 4,5-bisphosphate (PIP2) in chloroform were mixed at a 9:1 molar ratio, dried under N2, and resuspended in 20 mM HEPES pH 7.5 to obtain final concentrations of 180 and 20 μM PC and PIP2, respectively. The suspension was sonicated in a water bath sonicator (model W185; Heat Systems Ultrasonics, Farmingdale, NY).
Stimulation of dynamin assembly by endophilin
Dynamin 2 stock solution in 300 mM NaCl, 20 mM HEPES pH 7.5, 5 mM MgCl2 was centrifuged at 100,000 × g for 20 min at 4°C before turbidity measurements were performed. The dynamin was then diluted into buffer containing 20 mM HEPES, 5 mM MgCl2, and sufficient NaCl to achieve the required final NaCl concentrations. When appropriate, endophilin A2 in 100 mM NaCl, 20 mM HEPES pH 7.5 was added before addition of dynamin. Turbidity measurements were performed in a Shimadzu UV2401-PC at 330 nm in a 10 mm pathlength quartz cuvette at room temperature (22°C).
Cosedimentation assays
Before each cosedimentation measurement was performed, dynamin in 300 mM NaCl, 20 mM HEPES pH 7.5, 5 mM MgCl2, and 0.5 mM DTT was centrifuged at 4°C for 15 min at 213,000 × g to remove potential aggregates. The dynamin (1 μM) was then incubated for 15 min with various concentrations of endophilin or endophilin BAR domain in 20 mM HEPES pH 7.5, 75 mM NaCl, 2 mM MgCl2, and 0.5 mM DTT. The mixtures were then centrifuged at 213,000 × g for 15 min. The supernatants were removed and pellets were resuspended in the original volume. Aliquots of the supernatants and pellets were subjected to sodium dodecyl sulfate polyacrylamide gel electrophoresis (SDS-PAGE), and the amounts of dynamin and endophilin were estimated by scanning Coomassie blue-stained gels with a ScanJet 5300C followed by analysis with ImageJ (National Institutes of Health, Bethesda, MD).
In vitro fluorescence correlation spectroscopy
We conducted in vitro single-point fluorescence correlation spectroscopy (FCS) measurements using an Alba fluorescence correlation spectrometer (ISS, Champaign, IL) connected to a TE2000-U inverted microscope (Nikon, Melville, NY) with a PlanApo VC 60×1.2 NA water objective lens. Data were collected for two sequential 8 min runs with sampling rates of 100 kHz or 64 kHz. Two-photon excitation of enhanced green fluorescent protein (EGFP)-endophilin A1 was provided by a Chameleon Ultra (Coherent, Santa Clara, CA) tuned to 800 nm. Fluorescence emission was spectrally filtered through a 680 nm short-pass filter (FF01-680; Semrock, Rochester, NY) and dichroic mirror (700dcxru; Chroma, Bellows Falls, VT). Dilution of dynamin 2 into buffer containing 75 mM NaCl was conducted as described for the turbidity measurements except that the sample was put in a chambered coverglass (Labtek, Thermo Fisher Scientific, Rochester, NY). FCS of 100 nM EGFP-endophilin was conducted in 20 mM HEPES pH 7.5 and 100 mM NaCl. Data were analyzed using a custom script written in MATLAB (The MathWorks, Natick, MA) and SimFCS (www.lfd.uci.edu). The focal spot volume was calibrated using Rhodamine 110 in water with a diffusion constant of 430 μm2/s (26).
FFS in living cells
The instrument used for two-photon fluorescence fluctuation experiments in cells has been described elsewhere (27). All experiments were performed with an excitation wavelength of 905 nm. The sampling frequency was 20 kHz for all cellular measurements, and the data acquisition time was 1 min. The single-channel brightness was obtained by Q-analysis (28).
Endophilin labeling for in vitro experiments
For in vitro experiments, 500 μL of 4 μM endophilin A2 in 20 mM HEPES buffer pH 7.5 containing 100 mM NaCl were reacted with 10 μL of 6 mM Alexa Fluor 488 succinimidyl ester dissolved in DMSO overnight at 4°C. The reaction mixture was dialyzed (MWCO 6-8000; SpectraPor, Rancho Dominguez, CA) against the same buffer until free dye was no longer detectable. This procedure resulted in a labeling ratio of 2:1 protein/label. The anisotropy of the highest endophilin concentration was determined by seeding unlabeled protein with labeled protein. The steady-state fluorescence anisotropy was measured on an ISS PC1 photon counting spectrofluorimeter using 471 nm excitation, and emission was viewed through a 525 nm long-pass filter (No. 3484; Pyrex, Corning, Lowell, MA). Time-resolved experiments were conducted on an ISS Chronos spectrofluorometer using a 471 nm LED with a 482/18 nm excitation bandpass filter (Semrock), and emission was viewed through a 525 nm long-pass filter (No. 3484; Pyrex).
Electron microscopy
Dynamin 2 in 300 mM NaCl, 20 mM HEPES pH 7.5, 5 mM MgCl2, and 0.5mM DTT was diluted to 80 mM NaCl, 20 mM HEPES pH 7.5 buffer in the presence or absence of endophilin to a final concentration of 2.5 μM of each and allowed to incubate at room temperature for 2 min. Then 5 μL of this mixture were placed on a 200 mesh Formvar-coated copper grid for 1 min. The solution was then removed with the use of filter paper, washed once with H2O, and stained with uranyl acetate for 1 min before it was air-dried. The sample was viewed on an LEO 912 (Zeiss, Thornwood, NY) transmission electron microscope at an accelerating voltage of 100 kV. Images were captured with a Proscan 1K × 1K slow-scan frame-transfer camera.
Other methods
The protein concentration was determined as described by Bradford (29), with bovine serum albumin used as a standard. SDS-PAGE was carried out according to the method of Laemmli (30) as modified by Matsudaira and Burgess (31). Details of the endophilin constructs, purification of recombinant endophilin, and AUC analysis are described in the Supporting Material.
Results
Binding of endophilin A2 to dynamin 2
A cosedimentation assay was used to estimate the maximal stoichiometry of endophilin binding to dynamin. Under our experimental conditions (1 μM dynamin 2 at 22°C in 75 mM NaCl), ∼65% of dynamin self-associated into structures that sedimented upon centrifugation at 213,000 × g for 15 min (Fig. 2, A and D). Under the same conditions, endophilin A2 distributed largely to the supernatant, although concentration-dependent aggregation was observed. Aggregation of endophilin A1 was previously reported by Gallop et al. (5), who speculated that interactions between the endophilin SH3 domain and its central proline-rich segment lead to assembly. Endophilin A2 cosedimented with assembled dynamin to a stoichiometry of ∼1 mol/mol, and with a submicromolar dissociation constant (Fig. 2 C). In contrast, the endophilin A2 BAR domain did not bind to dynamin (Fig. 2 B), suggesting that the C-terminal SH3 domain of endophilin A2 is its sole dynamin-binding site.
Figure 2.
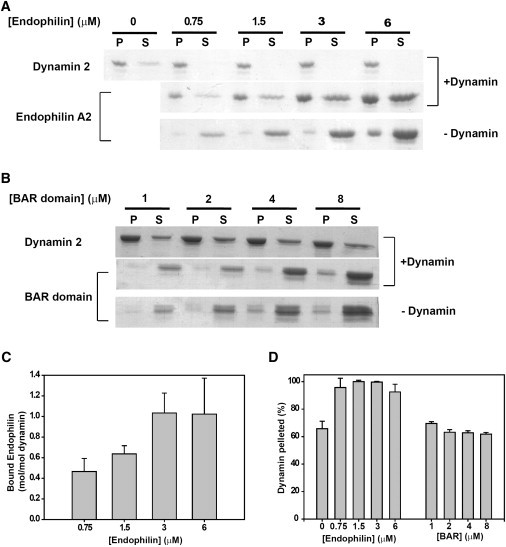
Binding of full-length endophilin A2 and the endophilin A2 BAR domain to dynamin 2. (A and B) Coomassie blue-stained SDS gels of the pellets (P) and supernatants (S) of endophilin A2 (A) or the endophilin A2 BAR domain (B) centrifuged at 213,000 × g for 15 min in the absence or presence of 1 μM dynamin 2. Pelleting assays were performed at 22°C in 20 mM HEPES pH 7.5, 75 mM NaCl, and 2 mM MgCl2. (C) Quantification of the stoichiometry of binding of endophilin A2 to dynamin 2 as a function of endophilin concentration. The amount of endophilin bound to dynamin was calculated as the difference between the amount of endophilin pelleted in the presence or absence of dynamin. (D) Quantification of dynamin 2 pelleting in the absence or presence of endophilin A2 or the endophilin A2 BAR domain. Conditions were identical to those used in panels A and B. Panels A and B represent a typical experiment, and the data in panels C and D represent the mean ± SE of results from gel scans of three separate experiments.
Enhancement of dynamin 2 assembly by endophilin A2
Although endophilins contain a single dynamin interacting site, they have the potential to promote dynamin assembly by virtue of their abilities to dimerize (Fig. 1), and to further associate into higher-order oligomers (see above). Thus, endophilins may function as cross-linkers of dynamin in the dimeric state, and as scaffolds in the multimeric state. Because these functions may be critical for dynamin targeting, assembly, and activation during endocytosis, we analyzed the effects of endophilin A2 on dynamin 2 polymerization. The cosedimentation assays discussed above provided the first indication that endophilin can enhance dynamin self-association, as the amount of pelleted dynamin 2 increased from ∼65% to ∼100% in the presence of 1.5 μM endophilin A2 (Fig. 2 D). We used a turbidity assay to determine the rate and extent of endophilin-stimulated dynamin polymerization. In all experiments, assembly was initiated by reducing the NaCl concentration from 300 mM to 75 mM. At 22°C, the turbidity of solutions containing 1 μM dynamin 2 increased very slightly upon dilution into 75 mM NaCl buffer. However, as shown in Fig. 3, turbidity increased dramatically in the presence of endophilin; moreover, increasing the endophilin concentration increased the rate of turbidity increase and also led to higher turbidity plateau levels. However, addition of the endophilin BAR domain had no effect on the sample turbidity.
Figure 3.
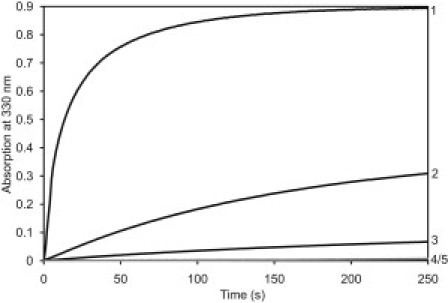
Turbidity of solutions containing 1 μM dynamin 2 and 0 μM (curve 5), 1 μM (curve 3), 2 μM (curve 2), or 7 μM (curve 1) endophilin A2, as designated in the figure. To initiate assembly, dynamin in 300 mM NaCl was diluted into buffer (± endophilin) to achieve a final NaCl concentration of 75 mM. Also shown is the turbidity of a solution containing dynamin 2 with 2 μM endophilin A2 BAR domain (curve 4, gray line).
Stimulation of dynamin 2 GTPase activity by endophilin A2
Warnock et al. (16) showed that the GTPase activity of dynamin 2 is stimulated upon dilution into low ionic strength buffers (42 mM), which induces the assembly of dynamin into rings and stacks of rings. The potent enhancement of dynamin 2 assembly by endophilin A2 prompted us to examine the effect of endophilin on dynamin 2 GTPase activity. As shown in Fig. 4 A, endophilin A2 stimulated the GTPase activity of 1 μM dynamin 2 in a concentration-dependent manner, achieving ∼10-fold activation in the presence of 3 μM endophilin. The endophilin A2 BAR domain had no effect on activity up to the highest concentration tested (14 μM).
Figure 4.
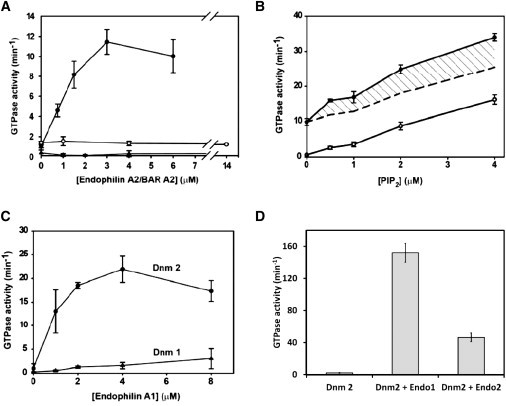
Activation of dynamin GTPase activity by endophilins. (A) GTPase activity of 1 μM dynamin 2 (●) or dynamin 1 (▴) measured at 22°C in buffer containing 75 mM NaCl as a function of the concentration of endophilin A2, and of dynamin 2 measured as a function of the endophilin A2 BAR domain (○). Results represent the mean ± SE of data from three experiments, each performed in triplicate. (B) GTPase activity of dynamin 2 as a function of PIP2 concentration measured at 22°C in buffer containing 75 mM NaCl in the absence (○) or presence (●) of 2 μM endophilin A2. The hatched area represents the activity that exceeds the calculated additive activities elicited by PIP2 and endophilin individually (dashed line). The data represent the averages of three measurements from a single experiment. (C) GTPase activities of dynamin 1 (▴) and dynamin 2 (●) measured at 22°C in buffer containing 75 mM NaCl as a function of the concentration of endophilin A1. The results represent the mean ± SE of triplicate measurements from three experiments. (D) GTPase activity of 1 μM dynamin 2 assayed at 37°C in buffer containing 100 mM NaCl in the absence or presence of endophilin A1 (4 μM) or endophilin A2 (4 μM). The results represent the mean ± SE of triplicate measurements.
We previously showed that the dynamin cross-linking protein Grb2 activates dynamin GTPase activity in a synergistic manner with PIP2-containing phospholipid vesicles, which serve as scaffolds for dynamin assembly (22). This synergistic effect was also demonstrated with sorting nexin 9 (SNX9) (32). Fig. 4 B shows that endophilin A2 also elicits greater than additive dynamin 2 GTPase activity when introduced together with PIP2.
Endophilin A1 was previously reported to slightly inhibit the GTPase activity of dynamin 1 (23). Therefore, we considered the possibility that GTPase activation is specific for the endophilin A2/dynamin 2 combination. However, as shown in Fig. 4 C, endophilin A1 stimulated the GTPase activity of dynamin 2 to an even greater extent than did endophilin A2. Although we did not observe the previously reported inhibition of dynamin 1 by endophilin A1, activation of its GTPase activity was much less pronounced than that of dynamin 2 (Fig. 4 C), and endophilin A2 had no effect on dynamin 1 activity (Fig. 4 A). The failure of endophilin A1 to significantly activate dynamin 1 GTPase activity correlated with its inability to induce dynamin 1 assembly, as demonstrated by a sedimentation assay (Fig. S1).
The GTPase measurements described above were carried out at 22°C in 75 NaCl buffer. However, activation of dynamin 2 GTPase activity by endophilins was even more pronounced when assayed at 37°C in 100 mM NaCl buffer. Under these near-physiological conditions, endophilins A1 and A2 stimulated dynamin activity 150-fold and 50-fold, respectively (Fig. 4 D). Activities observed in the presence of endophilin A1 (150 min−1) were substantially higher than those previously detected with another SH3 domain-containing dynamin activator, Grb2 (∼60 min−1) (24).
Characterization of dynamin-endophilin complexes by in vitro FCS
As described above, endophilin A2 increased the amount of sedimentable dynamin (Fig. 2) and accelerated dynamin polymerization (Fig. 3). The presence of endophilin A2 at a 1:1 stoichiometry with pelleted dynamin suggests that endophilin is not merely catalyzing the polymerization of the dynamin but is also stabilizing the dynamin 2 aggregate by becoming part of the complex. To address this issue, we performed FCS to characterize the endophilin-dynamin complex, using EGFP-endophilin A1 in place of endophilin. We verified that the EGFP tag does not affect the ability of endophilin to interact with dynamin 2 and activate its GTPase activity (data not shown). EGFP-endophilin A1 was incorporated into the dynamin 2 polymer/complex, as evidenced by the shift of the autocorrelation function to longer times (Fig. 5). The autocorrelation functions shown in Fig. 5 were each fit to a single diffusion constant, with the 100 nM EGFP-endophilin A1 giving a value of 39 μm2/s and, after 8 min, 14 μm2/s (note that smaller diffusion coefficients correspond to larger particles). Attempts to fit the latter data to multiple diffusion constants resulted in convergence back to a single diffusion constant (data not shown).
Figure 5.
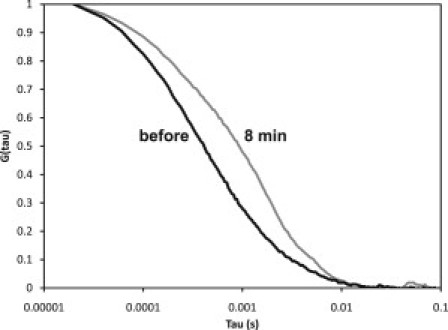
Normalized autocorrelation function of 100 nM EGFP-endophilin in 75 mM NaCl buffer in the absence of dynamin 2 (black line) and 8 min after the addition of 1 μM dynamin 2 (gray line). The autocorrelation functions were each fit to a single diffusion constant, with the 100 nM EGFP-endophilin giving a value of 39 μm2/s and, after 8 min, 14 μm2/s. Attempts to fit the latter data to multiple diffusion constants resulted in convergence back to a single diffusion constant (data fits not shown).
Fluorescence anisotropy
To further investigate the in vitro oligomerization state of endophilin, we performed steady-state and time-resolved anisotropy measurements (33). Endophilin A2 was covalently labeled with Alexa-488 succinimidyl ester (the labeling ratio of the sample was ∼1:2 Alexa/endophilin). The anisotropy of the labeled protein was determined as a function of the protein concentration as shown in Fig. 6. The solid line indicates a fit of the data to a Kd of 15 μM, and monomer and dimer anisotropies of 0.128 and 0.153, respectively. Frequency-domain time-resolved fluorescence spectroscopy (34) was carried out on the labeled endophilin (Fig. S2). The data indicate a significant extent of fast, local motion of the Alexa-488, resulting in a lowering of the measured anisotropy and hence a reduced anisotropy change from monomer to dimer. The highly asymmetric conformation of endophilin (Fig. 1) coupled with the extensive local probe mobility makes it extremely difficult to assign meaningful rotational rates to the protein.
Figure 6.
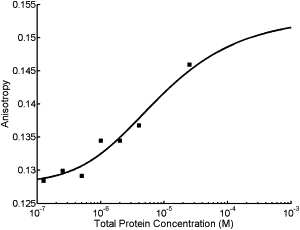
Steady-state fluorescence anisotropy of endophilin extrinsically labeled with Alexafluor-488 (squares). The solid line is the best-fit binding isotherm with a Kd of 15 μM, and monomer and dimer anisotropies of 0.128 and 0.153, respectively.
Sedimentation equilibrium experiments in a Beckman XL-I analytical ultracentrifuge also indicated that endophilin A2 is present in solution as a monomer/dimer equilibrium, with a Kd of ∼5 μM (Fig. S3). This result is in good agreement with the centrifugation data of Gallop et al. (5), who reported a dimer-monomer Kd of 10 μM for the BAR domain of endophilin A1, and also with the anisotropy results presented above.
As noted above, the turbidity assays indicated that endophilin A2 promotes dynamin 2 assembly (Fig. 3). An analysis of the initial rate of increase of the turbidity compared with the endophilin dimer concentration (Fig. 7) shows that the dimeric form of endophilin is responsible for the enhancement of dynamin assembly. We calculated the dimer concentration in Fig. 7 from the total endophilin concentration using a dissociation constant of 15 μM, based on fluorescence anisotropy results. However, it is possible that endophilin dimerization is also enhanced in the presence of dynamin, which would reduce the apparent dissociation constant for endophilin self-association.
Figure 7.
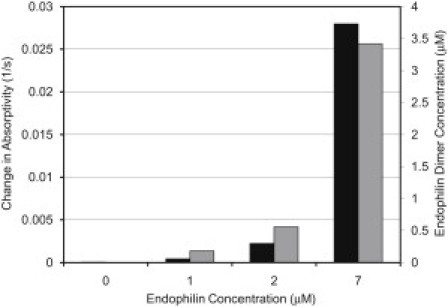
Correspondence of the initial rates of turbidity increase of dynamin 2 solutions (black, from Fig. 3) and the concentration of endophilin dimer (gray), based on a Kd of 15 μM for the dimer-monomer equilibrium.
Electron microscopy of dynamin/endophilin oligomers
We performed negative-stain transmission electron microscopy (TEM) on dynamin 2 in the presence and absence of endophilin when diluted into 80 mM NaCl buffer. In the presence of endophilin, dynamin forms significantly more fully formed and thicker ring-like structures than in its absence (Fig. 8) (15,35). The fact that endophilin engenders more fully formed dynamin rings could account for the higher dynamin GTPase activities observed in the presence of endophilin. The diameter of the rings formed (∼40–50 nm) is consistent with that reported by Hinshaw and Schmid (15). The samples imaged in Fig. 8 were fixed at the same time point after dilution into 80 mM NaCl buffer. This observation confirms that the enhanced polymerization of dynamin by endophilin forms biologically relevant structures rather than nonspecific aggregates. We also observed the same type of endophilin-dynamin 2 structures in 100 mM NaCl buffer at 37°C (Fig. S4).
Figure 8.
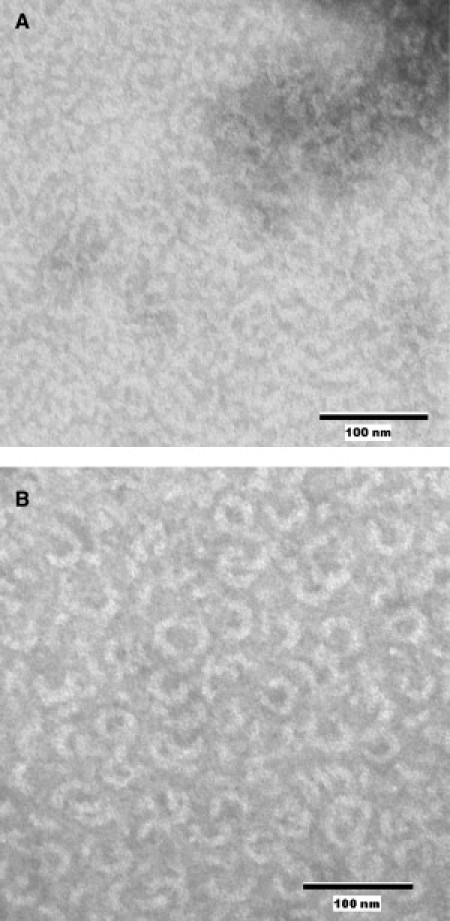
Negative-stain TEM images of (A) 2.5 μM dynamin 2 and (B) 2.5 μM dynamin 2 in the presence of 2.5 μM endophilin A2 ∼90 s after dilution into 80 mM NaCl buffer.
FFS in living cells
The relatively high dissociation constant measured in vitro for the dimerization reaction of endophilin A1 prompted Gallop et al. (5) to propose that the dimerization of this endophilin in cells is induced upon binding to either membranes or dynamin. To determine whether endophilin behaves in the cytoplasm as would be expected from its in vitro characteristics, we used FFS to measure the molecular brightness of EGFP-tagged endophilin A2 in transfected CV-1 cells. Separate CV-1 cells were transfected with the monomeric EGFP vector for control purposes. The molecular brightness of the individual measurements was calculated by means of a Q(τ) analysis (31). The monomeric EGFP brightness was 4000 ± 440 cpsm, as determined by averaging over 10 different cells. The brightness of endophilin was normalized to the monomeric EGFP brightness and graphed as a function of protein concentration (Fig. 9). The normalized molecular brightness of EGFP-endophilin was very close to the 2×monomeric EGFP brightness at every concentration measured. In a similar manner, we analyzed the oligomerization of the endophilin A2 BAR domain in the cytoplasm. The normalized molecular brightness of EGFP-tagged endophilin A2 BAR ranged from 1.5 to 2, with an average value of 1.68 ± 0.18 below 1 μM, and 1.96 ± 0.21 above 1 μM. Because the BAR domain lacks the dynamin-binding SH3 domain, its strong tendency to dimerize in the cytoplasm cannot be ascribed to its interaction with dynamin. These results demonstrate that both endophilin A2 and its BAR domain form very tight dimers in the cytoplasm despite their weak tendencies to self-associate in vitro.
Figure 9.
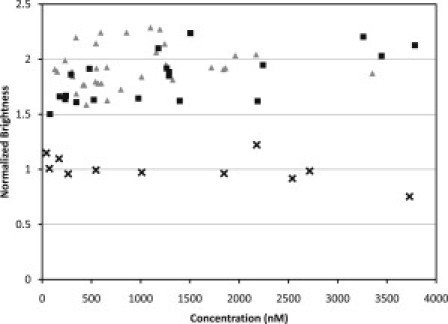
Brightness of EGFP-endophilin A2 (gray triangles) and EGFP-endophilin A2-BAR (black squares) measured within CV1 cells. The brightness in each plot is normalized to the relative brightness of monomeric EGFP (black crosses).
Discussion
We have demonstrated that endophilin markedly promotes assembly of dynamin 2 and stimulates its concentration-dependent GTPase activity. In addition, we have shown that dynamin polymers formed in the presence of endophilin develop higher turbidity levels than those formed in its absence. This increased turbidity may reflect a lengthening or cross-linking of dynamin polymers by endophilin, and suggests that endophilin may facilitate the formation of dynamin-dynamin interactions on endocytic membranes. Dynamin polymers formed in the presence of endophilin also display higher GTPase activities than those formed without endophilin. It is noteworthy that endophilin, like Grb2 (22) and SNX9 (32), acts synergistically with PIP2-containing liposomes in stimulating dynamin's GTPase activity, reducing the concentration of PIP2 required to achieve maximal activation. In contrast, amphiphysin, another N-BAR and SH3 domain-containing protein, inhibits dynamin GTPase activity that is stimulated by highly curved small unilamellar phospholipid vesicles (similar to those used in this study). Endophilins contain relatively short linker regions (∼61 residues) between their BAR and SH3 domains, whereas the corresponding linker regions in amphiphysin are much longer (379 residues). Of interest, a deletion mutant of amphiphysin in which the linker region is shortened to 20 residues is able to stimulate dynamin GTPase activity in a manner entirely analogous to that observed for endophilin. Therefore, it is possible that the ability of dimeric SH3 domain-containing proteins to stimulate dynamin GTPase activity depends on the distance between the SH3 domains in the dimer. SAXS data indicate that this distance is ∼16 nm in endophilin (8). The distance between SH3 domains in the amphiphysin dimer has not yet been determined. With the use of EM, Hinshaw and Schmid (15) determined the outside diameter of the dynamin rings to be ∼50 nm with 4–6 dynamin tetramers incorporated in each ring, resulting in ∼16 nm between dynamin dimers. This distance matches the distance between the SH3 domains within an endophilin dimer, thus allowing an endophilin dimer to stabilize a dynamin dimer within the collar. Our EM images of dynamin with endophilin show the same types of ring structures seen with dynamin alone and also in dynamin with amphiphysin (23). The rings formed with dynamin/endophilin are ∼40–50 nm in diameter, but are somewhat thicker than those formed in the absence of endophilin.
Our AUC and fluorescence anisotropy experiments indicate that endophilin A2 exists in solution in a monomer-dimer equilibrium with a dissociation constant (Kd) in the 5–15 μM range. These results are in agreement with those of Gallop et al. (5), who obtained a Kd of ∼10 μM from their AUC analysis of the BAR domain of endophilin A1. Although they were unable to measure the Kd for the dimer-monomer equilibrium of full-length endophilin A1, due to its tendency to aggregate at high concentrations, their data nonetheless indicate a weak association between endophilin A1 monomers.
Based on their AUC results and the estimated intracellular (presynaptic) concentration of ∼1 μM, Gallop et al. (5) suggested that endophilin A1 is predominantly monomeric in the cytoplasm but may dimerize upon binding to membranes. They further speculated that the dimerization process itself may be energetically linked to membrane deformation by endophilin. Because endophilin A2 is present in the cells at even lower concentrations than endophilin A1 (36), it seemed likely that a similar dimerization mechanism would apply to this endophilin isoform. We used FFS to study the self-association of EGFP-endophilin A2 in the cytoplasm of living cells. In fact, EGFP-endophilin A2 was dimeric over a large concentration range, from nanomolar to micromolar. Similar results were obtained with EGFP-endophilin A1 (not shown). This finding could be explained by an alternative dimerization mechanism, also proposed by Gallop et al. (5), whereby endophilin self-association is facilitated by binding to dynamin dimers. To test this possibility, we repeated the FFS using truncated endophilin A2 mutants lacking the dynamin-binding SH3 domains. As with the full-length endophilin A2, this construct was found to be dimeric over a large concentration range, suggesting that the BAR domains are sufficient to allow tight dimer formation in cells, though not in vitro. This dramatic difference between the oligomerization state of endophilin A2 in vitro and in cells is highly interesting but perhaps not surprising. As pointed out by numerous authors (for review, see Minton (37)), effects such as macromolecular crowding and adsorption in cells, in part due to diffusional barriers, may be expected to lead to differences in reaction rates and equilibria compared with in vitro environments.
We propose the following scenario: In solution at 100 mM and 300 mM NaCl, respectively, endophilin and dynamin oligomerization states are determined by their monomer-dimer and monomer-tetramer equilibria, respectively. However, once the ionic strength is decreased, dynamin is primarily tetrameric, with endophilin dimers bound via the SH3/PRD interaction. The presence of endophilin results in stabilization of the dynamin tetramers. The dynamin tetramers (38) subsequently self-assemble into rings, with ∼4–6 dynamin tetramers in each ring (15) also stabilized by two endophilin dimers for each dynamin tetramer. Of interest, recent total internal reflection fluorescence microscopy studies in our laboratory showed that dynamin is predominantly tetrameric in the plasma membrane, suggesting that the dynamin tetramer is the additive unit in the endocytic machinery (39).
Our results suggest that endophilin facilitates the assembly of dynamin rings around the necks of endocytic vesicles and may then accelerate their disassembly by stimulating dynamin GTPase activity. The potential significance of these effects was recently highlighted by Bethoney et al. (40), who showed that the interaction of the dynamin PH domain with phosphoinositides, while essential for endocytosis itself, may not play a direct role in dynamin clustering on endosomes. In contrast, the pro/arg-rich domains of dynamin, which interact with SH3 domains of endophilin and other accessory proteins, were found to be essential for dynamin targeting.
Acknowledgments
We thank Tina Weatherby at the Biological Electron Microscope Facility of the Pacific Biosciences Research Center, University of Hawaii, for her assistance with the EM.
This work was supported by National Institutes of Health grants RO1GM076665 (D.M.J.), RO1GM64589 (J.M.), and GM075401 (J.P.A.).
Footnotes
Hunter B. Banks's present address is Department of Physics, Washington University, St. Louis, Missouri.
Supporting Material
References
- 1.Huttner W.B., Schmidt A.A. Membrane curvature: a case of endofeelin' …. Trends Cell Biol. 2002;12:155–158. doi: 10.1016/s0962-8924(02)02252-3. [DOI] [PubMed] [Google Scholar]
- 2.Weissenhorn W. Crystal structure of the endophilin-A1 BAR domain. J. Mol. Biol. 2005;351:653–661. doi: 10.1016/j.jmb.2005.06.013. [DOI] [PubMed] [Google Scholar]
- 3.Farsad K., Ringstad N., De Camilli P. Generation of high curvature membranes mediated by direct endophilin bilayer interactions. J. Cell Biol. 2001;155:193–200. doi: 10.1083/jcb.200107075. [DOI] [PMC free article] [PubMed] [Google Scholar]
- 4.Masuda M., Takeda S., Mochizuki N. Endophilin BAR domain drives membrane curvature by two newly identified structure-based mechanisms. EMBO J. 2006;25:2889–2897. doi: 10.1038/sj.emboj.7601176. [DOI] [PMC free article] [PubMed] [Google Scholar]
- 5.Gallop J.L., Jao C.C., McMahon H.T. Mechanism of endophilin N-BAR domain-mediated membrane curvature. EMBO J. 2006;25:2898–2910. doi: 10.1038/sj.emboj.7601174. [DOI] [PMC free article] [PubMed] [Google Scholar]
- 6.Peter B.J., Kent H.M., McMahon H.T. BAR domains as sensors of membrane curvature: the amphiphysin BAR structure. Science. 2004;303:495–499. doi: 10.1126/science.1092586. [DOI] [PubMed] [Google Scholar]
- 7.McMahon H.T., Mills I.G. COP and clathrin-coated vesicle budding: different pathways, common approaches. Curr. Opin. Cell Biol. 2004;16:379–391. doi: 10.1016/j.ceb.2004.06.009. [DOI] [PubMed] [Google Scholar]
- 8.Wang Q., Kaan H.Y., Sondermann H. Structure and plasticity of endophilin and sorting nexin 9. Structure. 2008;16:1574–1587. doi: 10.1016/j.str.2008.07.016. [DOI] [PubMed] [Google Scholar]
- 9.Heymann J.A., Hinshaw J.E. Dynamins at a glance. J. Cell Sci. 2009;122:3427–3431. doi: 10.1242/jcs.051714. [DOI] [PMC free article] [PubMed] [Google Scholar]
- 10.Ferguson S.M., Brasnjo G., De Camilli P. A selective activity-dependent requirement for dynamin 1 in synaptic vesicle endocytosis. Science. 2007;316:570–574. doi: 10.1126/science.1140621. [DOI] [PubMed] [Google Scholar]
- 11.Gray N.W., Kruchten A.E., McNiven M.A. A dynamin-3 spliced variant modulates the actin/cortactin-dependent morphogenesis of dendritic spines. J. Cell Sci. 2005;118:1279–1290. doi: 10.1242/jcs.01711. [DOI] [PubMed] [Google Scholar]
- 12.Lu J., Helton T.D., Ehlers M.D. Postsynaptic positioning of endocytic zones and AMPA receptor cycling by physical coupling of dynamin-3 to Homer. Neuron. 2007;55:874–889. doi: 10.1016/j.neuron.2007.06.041. [DOI] [PMC free article] [PubMed] [Google Scholar]
- 13.Ringstad N., Nemoto Y., De Camilli P. The SH3p4/Sh3p8/SH3p13 protein family: binding partners for synaptojanin and dynamin via a Grb2-like Src homology 3 domain. Proc. Natl. Acad. Sci. USA. 1997;94:8569–8574. doi: 10.1073/pnas.94.16.8569. [DOI] [PMC free article] [PubMed] [Google Scholar]
- 14.Takei K., McPherson P.S., De Camilli P. Tubular membrane invaginations coated by dynamin rings are induced by GTP-γ S in nerve terminals. Nature. 1995;374:186–190. doi: 10.1038/374186a0. [DOI] [PubMed] [Google Scholar]
- 15.Hinshaw J.E., Schmid S.L. Dynamin self-assembles into rings suggesting a mechanism for coated vesicle budding. Nature. 1995;374:190–192. doi: 10.1038/374190a0. [DOI] [PubMed] [Google Scholar]
- 16.Warnock D.E., Baba T., Schmid S.L. Ubiquitously expressed dynamin-II has a higher intrinsic GTPase activity and a greater propensity for self-assembly than neuronal dynamin-I. Mol. Biol. Cell. 1997;8:2553–2562. doi: 10.1091/mbc.8.12.2553. [DOI] [PMC free article] [PubMed] [Google Scholar]
- 17.Shpetner H.S., Vallee R.B. Dynamin is a GTPase stimulated to high levels of activity by microtubules. Nature. 1992;355:733–735. doi: 10.1038/355733a0. [DOI] [PubMed] [Google Scholar]
- 18.Tuma P.L., Stachniak M.C., Collins C.A. Activation of dynamin GTPase by acidic phospholipids and endogenous rat brain vesicles. J. Biol. Chem. 1993;268:17240–17246. [PubMed] [Google Scholar]
- 19.Warnock D.E., Terlecky L.J., Schmid S.L. Dynamin GTPase is stimulated by crosslinking through the C-terminal proline-rich domain. EMBO J. 1995;14:1322–1328. doi: 10.1002/j.1460-2075.1995.tb07118.x. [DOI] [PMC free article] [PubMed] [Google Scholar]
- 20.Gout I., Dhand R., Waterfield M.D. The GTPase dynamin binds to and is activated by a subset of SH3 domains. Cell. 1993;75:25–36. [PubMed] [Google Scholar]
- 21.Herskovits J.S., Shpetner H.S., Vallee R.B. Microtubules and Src homology 3 domains stimulate the dynamin GTPase via its C-terminal domain. Proc. Natl. Acad. Sci. USA. 1993;90:11468–11472. doi: 10.1073/pnas.90.24.11468. [DOI] [PMC free article] [PubMed] [Google Scholar]
- 22.Barylko B., Binns D., Albanesi J.P. Synergistic activation of dynamin GTPase by Grb2 and phosphoinositides. J. Biol. Chem. 1998;273:3791–3797. doi: 10.1074/jbc.273.6.3791. [DOI] [PubMed] [Google Scholar]
- 23.Yoshida Y., Kinuta M., Takei K. The stimulatory action of amphiphysin on dynamin function is dependent on lipid bilayer curvature. EMBO J. 2004;23:3483–3491. doi: 10.1038/sj.emboj.7600355. [DOI] [PMC free article] [PubMed] [Google Scholar]
- 24.Lin H.C., Barylko B., Albanesi J.P. Phosphatidylinositol (4,5)-bisphosphate-dependent activation of dynamins I and II lacking the proline/arginine-rich domains. J. Biol. Chem. 1997;272:25999–26004. doi: 10.1074/jbc.272.41.25999. [DOI] [PubMed] [Google Scholar]
- 25.Higashijima T., Ferguson K.M., Gilman A.G. The effect of GTP and Mg2+ on the GTPase activity and the fluorescent properties of Go. J. Biol. Chem. 1987;262:757–761. [PubMed] [Google Scholar]
- 26.Jameson D.M., Ross J.A., Albanesi J.P. Fluorescence fluctuation spectroscopy: ushering in a new age of enlightenment for cellular dynamics. Biophys. Rev. 2009;1:105–118. doi: 10.1007/s12551-009-0013-8. [DOI] [PMC free article] [PubMed] [Google Scholar]
- 27.Chen Y., Wei L.N., Müller J.D. Probing protein oligomerization in living cells with fluorescence fluctuation spectroscopy. Proc. Natl. Acad. Sci. USA. 2003;100:15492–15497. doi: 10.1073/pnas.2533045100. [DOI] [PMC free article] [PubMed] [Google Scholar]
- 28.Sanchez-Andres A., Chen Y., Müller J.D. Molecular brightness determined from a generalized form of Mandel's Q-parameter. Biophys. J. 2005;89:3531–3547. doi: 10.1529/biophysj.105.067082. [DOI] [PMC free article] [PubMed] [Google Scholar]
- 29.Bradford M.M. A rapid and sensitive method for the quantitation of microgram quantities of protein utilizing the principle of protein-dye binding. Anal. Biochem. 1976;72:248–254. doi: 10.1006/abio.1976.9999. [DOI] [PubMed] [Google Scholar]
- 30.Laemmli U.K. Cleavage of structural proteins during the assembly of the head of bacteriophage T4. Nature. 1970;227:680–685. doi: 10.1038/227680a0. [DOI] [PubMed] [Google Scholar]
- 31.Matsudaira P.T., Burgess D.R. SDS microslab linear gradient polyacrylamide gel electrophoresis. Anal. Biochem. 1978;87:386–396. doi: 10.1016/0003-2697(78)90688-7. [DOI] [PubMed] [Google Scholar]
- 32.Soulet F., Yarar D., Schmid S.L. SNX9 regulates dynamin assembly and is required for efficient clathrin-mediated endocytosis. Mol. Biol. Cell. 2005;16:2058–2067. doi: 10.1091/mbc.E04-11-1016. [DOI] [PMC free article] [PubMed] [Google Scholar]
- 33.Jameson D.M., Ross J.A. Fluorescence polarization/anisotropy in diagnostics and imaging. Chem. Rev. 2010;110:2685–2708. doi: 10.1021/cr900267p. [DOI] [PMC free article] [PubMed] [Google Scholar]
- 34.Ross J.A., Jameson D.M. Time-resolved methods in biophysics. 8. Frequency domain fluorometry: applications to intrinsic protein fluorescence. Photochem. Photobiol. Sci. 2008;7:1301–1312. doi: 10.1039/b804450n. [DOI] [PubMed] [Google Scholar]
- 35.Mears J.A., Hinshaw J.E. Visualization of dynamins. Methods Cell Biol. 2008;88:237–256. doi: 10.1016/S0091-679X(08)00413-5. [DOI] [PMC free article] [PubMed] [Google Scholar]
- 36.Ringstad N., Nemoto Y., De Camilli P. Differential expression of endophilin 1 and 2 dimers at central nervous system synapses. J. Biol. Chem. 2001;276:40424–40430. doi: 10.1074/jbc.M106338200. [DOI] [PubMed] [Google Scholar]
- 37.Minton A.P. How can biochemical reactions within cells differ from those in test tubes? J. Cell Sci. 2006;119:2863–2869. doi: 10.1242/jcs.03063. [DOI] [PubMed] [Google Scholar]
- 38.Ramachandran R., Surka M., Schmid S.L. The dynamin middle domain is critical for tetramerization and higher-order self-assembly. EMBO J. 2007;26:559–566. doi: 10.1038/sj.emboj.7601491. [DOI] [PMC free article] [PubMed] [Google Scholar]
- 39.Ross J.A., Digman M.A., Jameson D.M. Oligomerization state of dynamin 2 in cell membranes using TIRF and number and brightness analysis. Biophys. J. 2011;100:L15–L17. doi: 10.1016/j.bpj.2010.12.3703. [DOI] [PMC free article] [PubMed] [Google Scholar]
- 40.Bethoney K.A., King M.C., Lemmon M.A. A possible effector role for the pleckstrin homology (PH) domain of dynamin. Proc. Natl. Acad. Sci. USA. 2009;106:13359–13364. doi: 10.1073/pnas.0906945106. [DOI] [PMC free article] [PubMed] [Google Scholar]
Associated Data
This section collects any data citations, data availability statements, or supplementary materials included in this article.