

Abstract
Dynamin 2 is an ubiquitously expressed ∼100 kDa GTPase involved in receptor-mediated endocytosis, Golgi budding, and cytoskeletal reorganization. Dynamin molecules assemble around the necks of budding vesicles and constrict membranes in a GTP-dependent process, resulting in vesicle release. The oligomerization state of dynamin 2 in the membrane is still controversial. We investigated dynamin 2 within the plasma membrane of live cells using total internal reflection microscopy coupled with number and brightness analysis. Our results demonstrate that dynamin 2 is primarily tetrameric throughout the entire cell membrane, aside from punctate structures that may correspond to regions of membrane vesiculation.
Dynamins are large (∼100 kDa) GTPases that assemble around the necks of budding vesicles and provide force for membrane constriction and fission (1,2). Two forms of dynamin have been partially characterized: neuronal specific dynamin 1 (Dnm1), implicated in presynaptic vesicle recycling, and ubiquitously expressed dynamin 2 (Dnm2), which participates in vesicle budding from the plasma membrane, endosomes, and trans-Golgi network. Dynamin interacts with other proteins primarily through its proline/arginine-rich domain (which binds microtubules and SH3-containing proteins) and with phosphoinositides through the pleckstrin homology domain.
The oligomeric state(s) of dynamins in vitro have been investigated by several groups, with conflicting conclusions. Binns et al. (3,4) showed by analytical ultracentrifugation that both Dnm1 and Dnm2 in solution undergo monomer-tetramer equilibria with equilibrium constants of ∼1–2 μM−3, whereas Muhlberg et al. (5), using the same method, concluded that Dnm1 is strictly tetrameric. In contrast, cryoelectron microscopy experiments suggest that the minimal assembly unit of Dnm1 on phospholipid vesicles is a dimer (6).
In this report, we address the issue of the oligomeric state of Dnm2 within the plasma membrane of live cells using total internal reflection fluorescence (TIRF) microscopy combined with the number and brightness (N&B) analysis technique (7–9).
TIRF microscopy utilizes the evanescent field generated from a beam which has undergone total internal reflection at the sample/glass interface to generate fluorescence from a very thin (<100 nm) layer. This technique combined with fast temporal image acquisition is ideally suited for investigation of dynamic processes occurring within the cellular membrane.
N&B analysis utilizes the fast statistical fluctuations of the intensity at each pixel of an image due to the diffusion of particles into and out of the focal volume provided the pixel dwell time is less than the characteristic diffusion time of the particle. N&B allows determination of the number (N) of diffusing particles within the focal spot and the intrinsic brightness (B) of each particle. These parameters are calculated from the average intensity at each pixel and the variance in the intensity distribution. For an electron-multiplying charge-coupled device (EMCCD) camera, N and B are defined as (7)
| (1) |
where I is the signal intensity and σ2 the variance, and offset and σ02 are the intensity offset and readout noise variance of the detection electronics, respectively. By calculating N and B for each pixel within the image, one can determine the spatial distribution of particle number and brightness, and by comparison to suitable controls determine the relative particle brightness.
Mouse embryo fibroblasts were transfected with rat Dnm2 cDNA (10), and cloned into the pEGFP-N1 vector (Clontech, Mountain View, CA), 24 h before analysis. The QuikChange mutagenesis kit (Clontech) was used to introduce an A207K into the enhanced green fluorescent protein (EGFP) sequence, eliminating the possibility of its dimerization. Cells were imaged using a TIRF apparatus previously described (7). Briefly, images were collected using a Cascade 512B EMCCD camera on a model No. IX81 microscope (Olympus, Melville, NY) illuminated with the 488 nm line from an Ar ion laser (Melles Griot, Albuquerque, NM) through a 60× 1.45 NA oil objective (Olympus). The sample was maintained at 37°C using a thermostated stage (Tokai Hit, Shizuoka, Japan). Images were analyzed using SimFCS (Laboratory for Fluorescence Dynamics, Irvine, CA). Images were collected at 256 × 256 pixels with 50-ms exposure time per frame; 512 frames were analyzed per image series. Monomeric EGFP in solution was used as a brightness standard viewed under identical microscope conditions as the cell samples. The brightness of the EGFP was defined as the brightness of the monomer.
The average intensity distribution of Dnm2-EGFP within the cell is shown in Fig. 1. The dynamin is seen to be uniformly distributed across the cellular membrane but is also present in numerous bright punctate structures, possibly corresponding to sites of membrane vesiculation.
Figure 1.
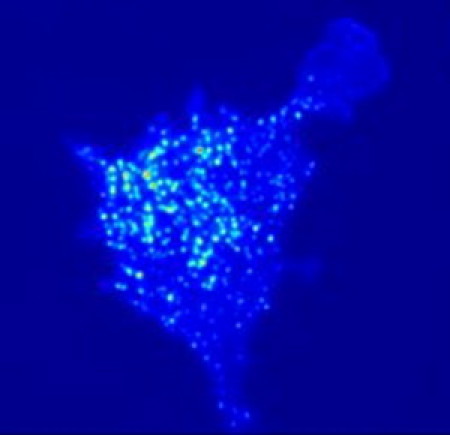
TIRF intensity image of Dnm2-EGFP.
Application of N&B analysis reveals that the number density (concentration) of Dnm2-EGFP is also uniform across the cell, with some small regions of higher than average concentration (Fig. 2 B). The particle brightness map shows that Dnm2-EGFP exists primarily as tetramers throughout the membrane, though not in the aforementioned punctate structures, which contain higher-order aggregates (in Fig. 2 C the green pixels represent tetramers and the red pixels represent higher-order oligomers). The normalized (to the monomer) average particle brightness was found to be 4.1 ± 0.8 (n = 7 cells). We note that because only EGFP constructs are observed we cannot say whether these dynamin tetramers are associated with accessory proteins such as endophilin, sorting nexin 9, etc.
Figure 2.
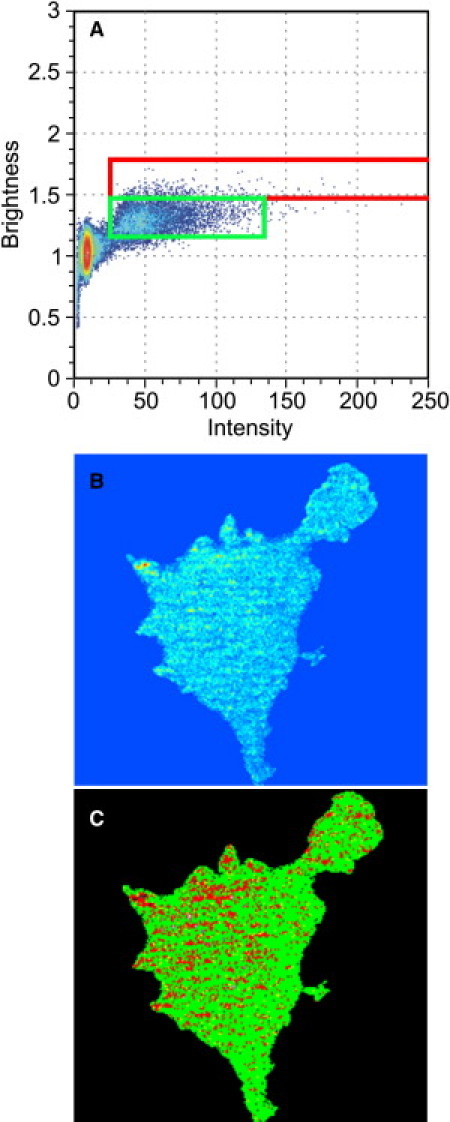
(A) Brightness-versus-intensity plot showing the tetrameric region (green box) and higher-order oligomers (red box). Number (B) and brightness (C) map of Dnm2-EGFP within the cell.
N&B analysis does not lend itself to a precise quantification of the number of molecules in the higher-order oligomers observed in this study because of the underlying mechanisms responsible for the fluctuations present in these punctate structures. These structures are presumably associated with receptor-mediated endocytosis, and as such, the fluctuations are not purely diffusive in nature but are also due to binding/unbinding events and to fluctuations about the focal plane. The binding events may reflect the formation and dissolution of the collar responsible for membrane vesiculation by Dnm2.
Based on membrane binding assays and mutational analyses, Ramachandran et al. (11) suggested that dynamin can form a “dimer of dimers that can stably bind and nucleate further self-assembly on membranes.” Our TIRF/N&B observations demonstrating the relatively uniform presence of dynamin tetramers in the plasma membrane support this hypothesis that the tetrameric form of dynamin is the minimal assembly unit. In light of evidence that dynamins bind preferentially to curved membranes (for recent discussions, see (12) and (13)), it may be that the invaginating pits, due to local membrane curvature, are able to recruit tetramers directly from the plasma membrane, in addition to recruitment from the cell interior. A two-dimensional membrane diffusion process would expedite the rate of assembly at the coated pit compared to addition of dynamins from the cytoplasm.
This study highlights the value of the N&B approach, coupled with TIRF microscopy, in defining the oligomeric states of components of the endocytic machinery. In particular, we have shown that dynamin, which in solution can exhibit a wide range of oligomeric states, exists primarily as a tetramer in the plasma membrane.
Acknowledgments
This work was supported by National Institutes of Health grant Nos. RO1GM076665 (D.M.J.) and P41-RR03155 (E.G.).
References and Footnotes
- 1.Praefcke G.J., McMahon H.T. The dynamin superfamily: universal membrane tubulation and fission molecules? Nat. Rev. Mol. Cell Biol. 2004;5:133–147. doi: 10.1038/nrm1313. [DOI] [PubMed] [Google Scholar]
- 2.Ramachandran, R. 2010. Vesicle scission: dynamin. Semin. Cell Dev. Biol. Epub PMID 20837154. [DOI] [PubMed]
- 3.Binns D.D., Barylko B., Albanesi J.P. Correlation between self-association modes and GTPase activation of dynamin. J. Protein Chem. 1999;18:277–290. doi: 10.1023/a:1021083211267. [DOI] [PubMed] [Google Scholar]
- 4.Binns D.D., Helms M.K., Eccleston J.F. The mechanism of GTP hydrolysis by dynamin II: a transient kinetic study. Biochemistry. 2000;39:7188–7196. doi: 10.1021/bi000033r. [DOI] [PubMed] [Google Scholar]
- 5.Muhlberg A.B., Warnock D.E., Schmid S.L. Domain structure and intramolecular regulation of dynamin GTPase. EMBO J. 1997;16:6676–6683. doi: 10.1093/emboj/16.22.6676. [DOI] [PMC free article] [PubMed] [Google Scholar]
- 6.Zhang P., Hinshaw J.E. Three-dimensional reconstruction of dynamin in the constricted state. Nat. Cell Biol. 2001;3:922–926. doi: 10.1038/ncb1001-922. [DOI] [PubMed] [Google Scholar]
- 7.Unruh J.R., Gratton E. Analysis of molecular concentration and brightness from fluorescence fluctuation data with an electron multiplied CCD camera. Biophys. J. 2008;95:5385–5398. doi: 10.1529/biophysj.108.130310. [DOI] [PMC free article] [PubMed] [Google Scholar]
- 8.Digman M.A., Dalal R., Gratton E. Mapping the number of molecules and brightness in the laser scanning microscope. Biophys. J. 2008;94:2320–2332. doi: 10.1529/biophysj.107.114645. [DOI] [PMC free article] [PubMed] [Google Scholar]
- 9.Dalal R.B., Digman M.A., Gratton E. Determination of particle number and brightness using a laser scanning confocal microscope operating in the analog mode. Microsc. Res. Tech. 2008;71:69–81. doi: 10.1002/jemt.20526. [DOI] [PubMed] [Google Scholar]
- 10.Lin H.C., Barylko B., Albanesi J.P. Phosphatidylinositol (4,5)-bisphosphate-dependent activation of dynamins I and II lacking the proline/arginine-rich domains. J. Biol. Chem. 1997;272:25999–26004. doi: 10.1074/jbc.272.41.25999. [DOI] [PubMed] [Google Scholar]
- 11.Ramachandran R., Surka M., Schmid S.L. The dynamin middle domain is critical for tetramerization and higher-order self-assembly. EMBO J. 2007;26:559–566. doi: 10.1038/sj.emboj.7601491. [DOI] [PMC free article] [PubMed] [Google Scholar]
- 12.Ramachandran R., Schmid S.L. Real-time detection reveals that effectors couple dynamin's GTP-dependent conformational changes to the membrane. EMBO J. 2008;27:27–37. doi: 10.1038/sj.emboj.7601961. [DOI] [PMC free article] [PubMed] [Google Scholar]
- 13.Roux A., Koster G., Bassereau P. Membrane curvature controls dynamin polymerization. Proc. Natl. Acad. Sci. USA. 2010;107:4141–4146. doi: 10.1073/pnas.0913734107. [DOI] [PMC free article] [PubMed] [Google Scholar]