

Abstract
Purpose
To examine the relationship between apparent diffusion coefficients (ADC) from diffusion weighted imaging (DWI) and choline levels from proton magnetic resonance spectroscopic imaging (MRSI) in newly diagnosed Grade II and IV gliomas within distinct anatomic regions.
Materials and Methods
A total of 37 patients with Grade II and 28 patients with Grade IV glioma were scanned on a 1.5T system with 3D MRSI and DWI. Region level analysis included Spearman rank correlation between median normalized ADC and choline for each patient per grade within each distinct abnormal anatomical region. Voxel level analysis calculated a Spearman rank correlation per region, per patient.
Results
Grade II lesions showed no evidence of a correlation between normalized ADC and choline using either the region or voxel level analysis. Region level analysis of Grade IV lesions did not appear to correlate in the contrast enhancement or necrotic core, but did suggest a significant negative correlation in the more heterogeneous nonenhancing and combined regions.
Conclusion
There appears to be differences in the relationship between ADC and choline levels in Grade II and Grade IV gliomas. Correlation within these regions in Grade IV lesions was strongest when all regions were included, suggesting heterogeneity may be driving the relationship.
Keywords: brain tumors, apparent diffusion coefficient, choline, Grade II gliomas, Grade IV gliomas
GLIOMAS ARE SPATIALLY heterogeneous brain tumors with mixed areas that may include necrosis, solid tumor, edema, and varying levels of infiltration into normal tissue. Noninvasive methods for evaluating this heterogeneity are important in directing patient treatment. Conventional magnetic resonance imaging (MRI) is sensitive to morphologic changes that occur in patients with glioma, but such changes are not specific indicators of disease progression or regression, particularly in patients that have undergone therapy. A number of functional and metabolic imaging methods have been proposed in order to provide a more complete evaluation of pathological heterogeneity. Two such imaging modalities are proton magnetic resonance spectroscopic imaging (MRSI) and diffusion-weighted imaging (DWI).
In vivo proton MRSI has been used in a research and clinical setting to measure metabolite levels in the brain. Previous studies have shown that variations in levels of metabolites such as choline, creatine, N-acetylaspartate, lactate, and lipid are associated with brain pathologies and are able to distinguish tumor from normal brain, edema, and treatment induced necrosis (1). Of relevance to the current study is that the levels of choline-containing compounds in brain tumors have been reported to correlate with cell density (2) and the proliferative index, Ki-67 (3).
DWI is based on the randomly distributed displacement (Brownian motion) of water molecules, which is affected by cell structures such as membranes, myelin fiber bundles, organelles, etc. (4). The mean diffusivity, also known as the apparent diffusion coefficient (ADC), depends on the intracellular and extracellular environments, as well as tissue configuration and pathological tissue changes (4). Although some studies have reported a correlation between ADC and cell density in high-grade brain tumors (2,5), it is not clear whether this is applicable for all tumor types and grades. Recent observations have suggested that early changes in ADC are predictive of response to therapy and that this is likely to be an important modality for monitoring treatment effects (6).
In developing protocols for following response to therapy, it is important to determine whether ADC and choline are alternate measurements of the same phenomenon or whether they represent independent pieces of information that are complementary in nature. Although some studies have reported an inverse correlation between ADC and choline, these have typically considered a heterogeneous patient population and heterogeneous tumor regions (i.e., edema, necrosis, cystic cavity, and solid tumor) (7). Catalaa et al (8) observed a negative correlation between ADC and choline in mixed anatomical regions for a subpopulation of patients with untreated Grade IV gliomas, but were unable to establish a significant relationship for patients with Grade II and Grade III lesions.
The purpose of this study was to examine the relationship between normalized ADC and choline levels in regions of tumor both within an individual patient and between patients with tumors of similar grade. Two distinct populations of patients were considered; one group with newly diagnosed Grade II glioma and the other with newly diagnosed Grade IV glioma. We were particularly interested in seeing whether it was possible to verify the previously reported correlations for tissue that was solely within subregions of T2 hyperintensity, contrast enhancement, and necrosis.
MATERIALS AND METHODS
Study Population
A total of 65 newly diagnosed patients with gliomas were included in this study. Diagnosis of tissue was based upon histologic examination using criteria defined by the World Health Organization (WHO). A total of 37 Grade II patients consisting of 14 astrocytomas, 17 oligodendrogliomas, and six oligoastrocytomas (17 female, 20 male), ranged in age from 22 to 72 years. A total of 28 Grade IV glioblastoma multiforme patients (eight female, 20 male), ranged in age from 29 to 84 years. Patients provided informed consent as approved by the Committee on Human Research at our institution.
Conventional MRI
Patient exams were performed on a 1.5T GE Signa Echospeed scanner (GE Healthcare Technologies), using a standard quadrature head coil. The MRI examination included axial T1-weighted pre- and postgadolinium three-dimensional (3D) spoiled gradient echo (SPGR) images (TR = 34 msec, TE = 3 msec, slice thickness = 1.5 mm, matrix = 256 × 192, field of view [FOV] = 260 × 195 mm2, flip angle = 40°) and axial T2-weighted 3D fast spin echo (FSE) (TR = 4000 msec, TE = 104 msec, slice thickness = 1.5 mm, matrix = 256 × 192, FOV = 260 × 195 mm2). After each examination, the images were transferred to a Sun Ultra 10 workstation (Sun Microsystems, CA, USA) for postprocessing. The FSE and pregadolinium SPGR images were aligned to the postgadolinium SPGR using software developed in our laboratory (9).
1 H MRSI
3D MRSI was acquired with 12 × 12 × 8 phase encodes with a nominal voxel size of 1 cc with the point-resolved spectroscopy sequence (PRESS) box size of 8 × 8 × 4 (TR = 1000 msec, TE = 144 msec) and very selective saturation (VSS) bands for outer-voxel suppression. The postgadolinium T1-weighted 3D SPGR was used to prescribe the PRESS selected volume. MRSI processing algorithms were developed in-house and have been described in detail elsewhere (10). Briefly, the data were filtered with a Lorentzian function and Fourier transformed, resulting in an array of spectra. The spectra were corrected for baseline variations, phase shifts, and frequency shifts within the region of each peak, employing a priori information about the relative location of each metabolic peak. An automatic search procedure was used to identify each resonance and to quantify levels of choline, creatine, N-acetyl aspartate (NAA), lactate, and lipid resonances. The MRSI exams were prescribed on the postgadolinium 3D SPGR volume directly after the acquisition of the SPGR and it was assumed that there was negligible patient movement in between.
DWI
A total of three directional axial diffusion-weighted echo-planar images (TR = 10,000 msec, TE = 110 msec, matrix size = 256 × 256 × 24, FOV = 360 × 360 mm2, slice thickness = 5 mm, b = 1000 second/mm2, gradient strength = 0.04 T/m, gradient duration [δ] = 21 msec, and gradient separation [Δ] = 27 msec) were acquired, covering the supratentorial brain. The ADC was calculated on a pixel-by pixel basis using software developed in-house, based on published algorithms (11). The DWI maps were aligned to the T2-weighted FSE, which resulted in the registration of all four imaging datasets (DWI, FSE, SPGR, and MRSI) (12). The ADC maps were then resampled to the 1-cc MRSI resolution, as shown in Fig. 1.
Figure 1.

Anatomical images, (a) SPGR and (b) FSE used to localize (c) spectra and align (d) ADC images. Choline heights were used to generate (e) choline maps, while (f) ADC maps were generated from ADC images resampled to the spectral resolution.
Data Processing
An in-house semiautomated segmentation method was used to define the contrast enhancing lesion (CEL) and necrotic regions (NEC) on the post-Gd T1-weighted image (13). The T2 hyperintense region (T2All) was contoured on the T2-weighted FSE image. The nonenhancing region (NEL) was defined as T2All minus the CEL and NEC (T2All–CEL–NEC) as shown in Fig. 2. The NEC and CEL masks were also combined to create the (NEC+CEL) mask. Normalized choline maps (nCho) were generated by dividing the choline maps by the choline level in a chosen spectroscopic voxel in a normal-appearing region. Normalized ADC maps (nADC) were generated by dividing the ADC maps by the median ADC value within the normal appearing white matter (NAWM) mask, which was segmented using FAST (FMRIB’s Automated Segmentation Tool) Software on the T2-weighted FSE image (14). The high-resolution abnormal anatomical regions were resampled to the spectroscopic voxels by applying a threshold for exclusion based on the percentage of the high-resolution region of interest contained in the resampled voxel of 70% for T2All and 60% for CEL and NEC. MRSI and DWI normalized maps were plotted on an nCho vs. nADC graph as shown in Fig. 3.
Figure 2.

Example of segmentation of the T2All from the FSE image, the CEL and NEC from the SPGR image and a calculated NEL as (T2All–CEL–NEC) for a patient with a Grade IV glioma. Patients with Grade II lesions included only T2All regions of the lesion.
Figure 3.
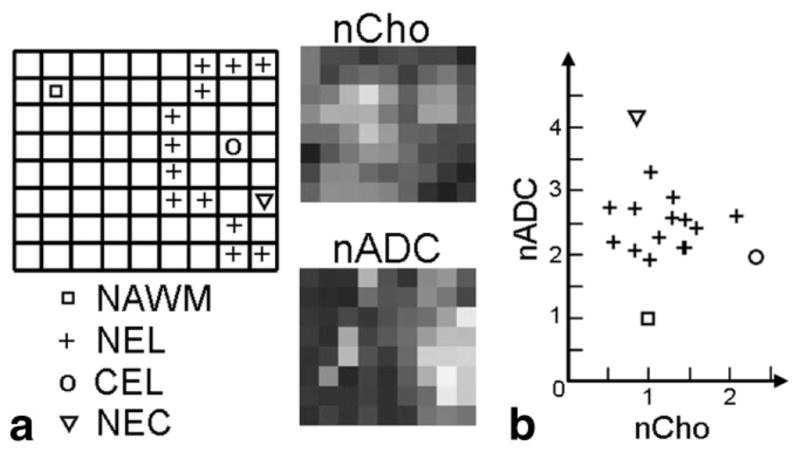
Results from patient in Fig. 2 with a Grade IV glioma (a) spectral slice with distinct anatomically abnormal regions labeled per voxel, applied to the nCho and nADC maps to generate a (b) 2D plot of the regions.
Statistical Analysis
Two methods of analysis were performed. Between-patient region level analysis included a Spearman rank correlation between normalized ADC and choline for each grade within each distinct abnormal anatomical region (Grade IV: NEL, CEL, NEC, and T2All; and Grade II: T2All), as shown in Fig. 4. A total of three Grade II patients presented with small regions of contrast enhancement, which were excluded from the T2All mask. Within-patient voxel level analysis included a Spearman rank correlation of nCho and nADC for voxels in the PRESS box within each distinct abnormal anatomical region for each individual. These correlations were separated by grade, as shown in Fig. 5. All values are reported as median ± standard deviation (SD) unless otherwise noted.
Figure 4.

Region level analysis: median (nCho, nADC) per patient for Grade IV regions: NEC, CEL, NEL, and Grade II subtypes: Oligo, Astro, Oligoastro.
Figure 5.
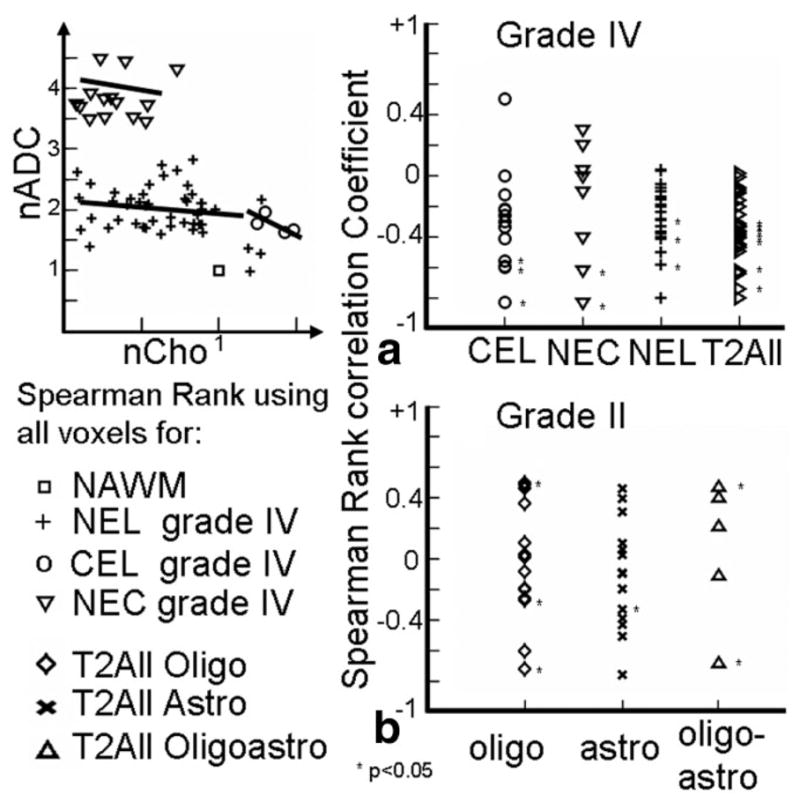
Voxel level analysis: Spearman rank correlation co-efficients using all voxels for (a) patients with Grade IV lesions grouped by regions and (b) patients with Grade II lesions grouped by subtypes.
RESULTS
Descriptive Statistics
Patients with Grade IV gliomas had median ± SD ADC values within normal and anatomical regions of 756 ± 59 (NAWM), 1361 ± 272 (T2All), 1348 ± 269 (NEL), 1204 ± 219 (CEL), and 1844 ± 488 (NEC) × 10−6 mm2/second. Patients with Grade II gliomas had median ADC values within NAWM of 726 ± 41 and T2All were 1199 ± 195 (oligodendrogliomas), 1586 ± 306 (astrocytoma), 1598 ± 299 (oligoastrocytoma), and 1443 ± 317 (All) × 10−3 mm2/second. Patients with Grade IV glioma had white matter choline SNR median ± SD values of 12.40 ± 3.5, and patients with Grade II glioma had white matter choline SNR of 14.6 ± 4.1. Patients with Grade IV gliomas within the abnormal anatomical regions had nCho median ± SD values of 0.95 ± 1.14 (T2All), 0.98 ± 1.28 (NEL), 1.04 ± 0.81 (CEL), and 0.49 ± 0.38 (NEC). Patients with Grade II gliomas had median normalized choline values within T2All of 1.55 ± 0.90 (oligodendrogliomas), 1.07 ± 0.65 (astrocytoma), 0.99 ± 0.19 (oligoastrocytoma), and 1.36 ± 1.2 (All).
Between-Patient Region-Level Analysis
Spearman rank correlation of median values of nCho and nADC for patients with Grade IV gliomas within NEC+CEL, NEL, and T2ALL regions were significantly correlated, P = 0.0043, 0.00002, 0.0026, respectively, while voxels within CEL and NEC did not reach significance (see Fig. 4a and Table 1). When examining the data more closely, it was seen that 23 of 28 patients had NEC and/or CEL, which was made up of one patient with NEC but no CEL, 14 with CEL but no NEC, and eight patients with both CEL and NEC.
Table 1.
Region Level Spearman Rank Correlation Analysis
| Region | Grade IV |
||
|---|---|---|---|
| r | P | N | |
| T2AII | −0.55 | 0.0026* | 28 |
| NEL | −0.71 | 0.00002* | 28 |
| NC | −0.57 | 0.0043* | 23 |
| CEL | −0.17 | 0.45 | 22 |
| NEC | −0.45 | 0.22 | 9 |
| Type | Grade II |
||
| r | P | N | |
| All | −0.09 | 0.60 | 37 |
| Oligo | 0.27 | 0.30 | 17 |
| Astro | −0.28 | 0.34 | 14 |
| Oligoastro | 0.14 | 0.79 | 6 |
Significant P value.
In looking at the combined regions, the (nCho, nADC) locations of the 15 patients with either only CEL or only NEC stayed the same but the locations of the eight patients with both CEL and NEC showed a decrease in nCho and increase in nADC. This suggests that the correlation between nADC and nCho observed in the combined CEL+NEC region is driven by a cluster of patients with mainly necrosis who have high nADC with low nCho and a cluster of patients with mainly contrast enhancement who have low ADC with high nCho (see Fig. 6).
Figure 6.
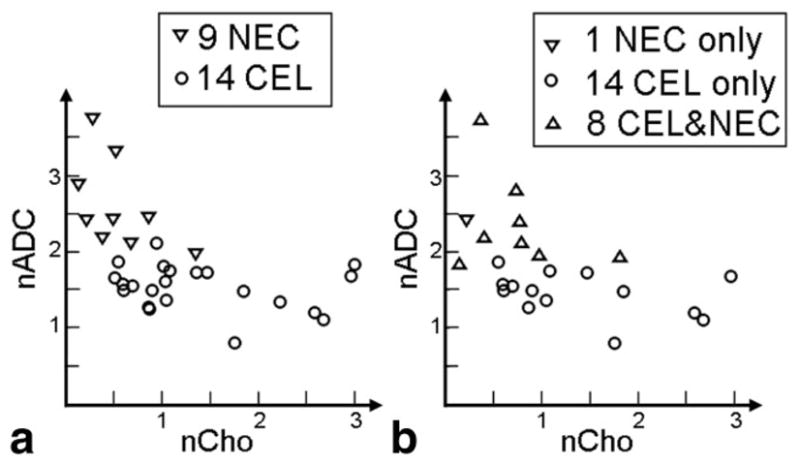
Plot of patients with Grade IV gliomas. (a) Median values in NEC and CEL and (b) median values in NEC and CEL regions, effect when combining the regions, effectively showing two clusters of patients, one group who have voxels with mostly active tumor and one group who have voxels of mixed origin with nCho and nADC values more similar to the values in NECs.
For the nonenhancing NEL region of either Grade IV or Grade II lesions, we expect a mixture of edema and tumor. The box-plot values for two patients with Grade IV glioma are shown in Fig. 7. One patient has high nCho and low nADC, which suggests the region is mainly tumor, while the second patient has nCho close to normal and high nADC, which suggests mainly edema (nCho ≈ 1, nADC ≈ 2). For patients with Grade II gliomas there was very little enhancement and no necrosis, so the NEL is coincident with the T2All region. In this case there was no significant correlation for median nCho and nADC within these regions for any of the subpopulations of Grade II lesions or when all types were combined. These data are seen in Fig. 4b. The Spearman rank correlation coefficients, P values, and number of these patients are shown in Table 1.
Figure 7.
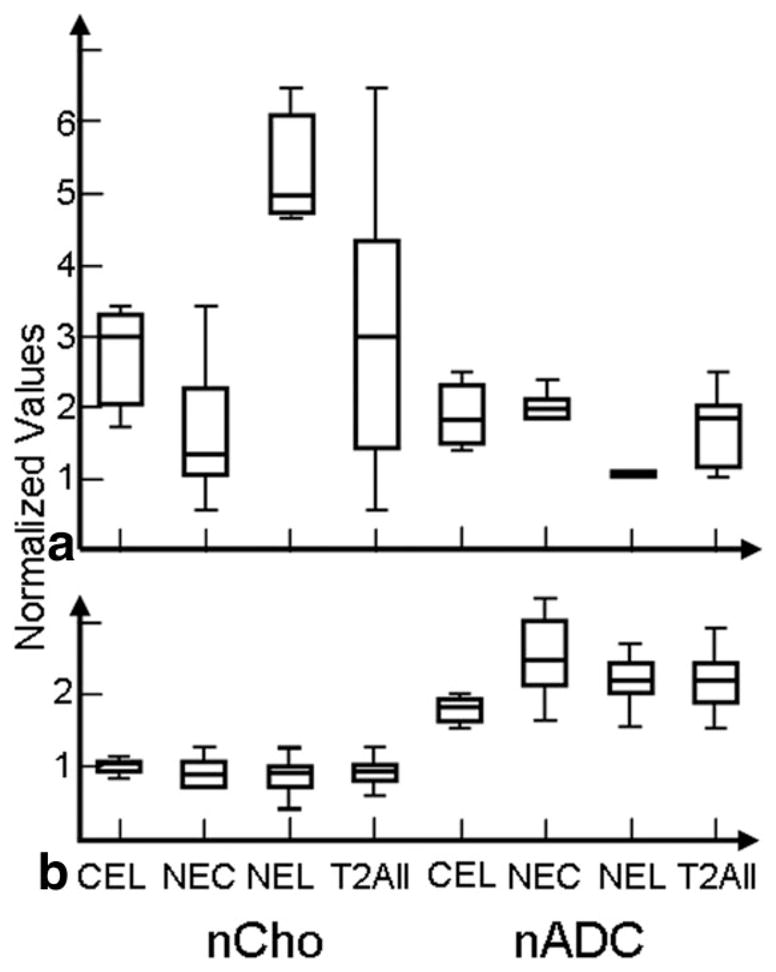
Box plots showing range of values. Example of a patient with a Grade IV glioma (a) showing higher nCho within NEL than CEL regions with large ranges, while another patient with a Grade IV lesion (b) showing smaller ranges of nCho.
Within-Patient Voxel-Level Analysis
Spearman rank correlation coefficients of the voxels from Grade IV gliomas within voxels from the various distinct abnormal regions are shown in Fig. 5a and the Spearman rank correlation coefficients for the patients with different Grade II lesions are shown in Fig. 5b. For the patients with Grade IV gliomas the correlation co-efficients were predominantly negative and eight of 36 of them were significant within CEL, NEL, and NEC regions. For the patients with Grade II gliomas the co-efficients were both positive and negative and only six of 37 of them were significant within the T2All regions. A Wilcoxon rank-sum test of the Spearman rank correlation coefficients demonstrates that the two groups have significantly different medians (P < 0.0008) and the correlations tend to be higher in the Grade IV regions.
The nCho and nADC values in representative patients with Grade IV lesions from these two groups are seen in Fig. 7. One of the patients has highly variable nCho values, while the other has much less variable nCho (nCho values ranged from 0.2 to 6.1). Figure 8 shows a plot of the Spearman rank coefficient for the CEL plotted vs. range of nADC values, which indicates that there is a trend toward large correlation coefficient values for large ranges and small correlation coefficient values with smaller ranges.
Figure 8.
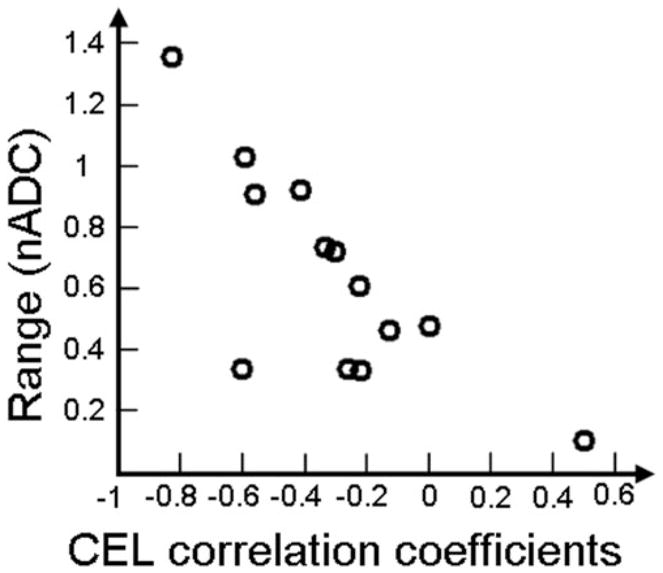
Linear relationship between the Spearman rank correlation coefficients of the CEL region for the patients with Grade IV lesions and the range of nADC values within the CEL region. This indicates that the large correlation coefficients are likely to be driven by region heterogeneity.
DISCUSSION
Levels of choline, as determined by MRSI, and values of apparent diffusion contrast (ADC) obtained from DWI can both provide quantitative, noninvasive measurements that are of interest for characterizing gliomas and assessing whether they are responding to therapy. Before these measurements are utilized as surrogate markers in a clinical setting, it is important to understand whether they represent similar or distinct phenomena. Because the acquisition of DWI provides higher spatial resolution in a shorter time than MRSI and is more widely available on commercially available MR scanners, clinicians would be more likely to use ADC to evaluate their patients if they were shown to provide directly equivalent information. In this study we sought to make direct comparisons of choline and ADC measurements in two populations of patients with newly diagnosed, untreated gliomas that are expected to have quite different biological characteristics. Our hypothesis was that if they were representative of similar phenomena there would be a statistically significant correlation between the two variables in each case and for each grade. The analysis was performed by comparing values from similar spatial locations, both on a voxel by voxel basis and by taking median values within anatomically distinct portions of the lesion across different patients.
In low grades, ADC values of patients with astrocytoma are consistent with previous findings (15,16), while the ADC values for patients with oligodendroglioma are lower in this study. This may be attributed to the variation in classification of low grades, especially of oligodendrogliomas, which has been changing over the past few years. As previously reported, the normalized choline values are higher for Grade II oligodendrogliomas than astrocytoma (17).
For the patients with Grade II gliomas, neither approach was able to provide a clear relationship between levels of choline and ADC values. Because the median choline values were higher and the median ADC values lower within the regions of hyperintensity on T2-weighted images for oligodendrogliomas compared to values in astrocytomas or oligoastrocytomas, we considered each subpopulation separately, as well as together. Once again there was no statistically significant relationship found. It should also be noted that the median ADC levels in all of the lesions were higher than in NAWM, whereas the median choline levels were similar to NAWM for the astrocytomas and oligoastrocytomas. This provides further evidence for there being different factors driving the measurements of each parameter. When we performed a voxel by voxel analysis of the choline and ADC values within individual patients there were six patients for whom a significant relationship was established, but in some cases there were positive correlations and in others negative correlations. These results argue against there being a single underlying explanation for the variations in choline and ADC and suggest that, at least in these Grade II gliomas, they provide different types of information. This conclusion is consistent with the findings of Catalaa et al (8) who had previously reported no significant correlation between mean ADC and mean choline for 20 patients with Grade II gliomas of mixed subtypes.
For patients with Grade IV gliomas, the ADC values of the NEC, NEL and CEL subregions were consistent with previous findings (8,18–20). The normalized choline values for patients with Grade IV gliomas in this study are similar to those previously reported for the NEC, NEL, and T2All regions, (8,21) and not significantly different from those previously reported CEL (21).
For patients with Grade IV gliomas that are known to be much more spatially heterogeneous than low-grade lesions, our study provided mixed findings. In untreated Grade IV gliomas, the gadolinium-enhancing region (CEL) is usually interpreted as representing tumor, the central hyperintense region on the postcontrast T1-weighted images (NEC) as corresponding to necrosis and the remaining region of hyperintensity on the T2-weighted images that does not enhance (NEL) to a mixture of invasive tumor and edema. It should be noted that while the median levels of ADC in all subregions were significantly higher than in NAWM and the ADC within the NEC regions were significantly higher than the median ADC in the other regions, the difference between values in the CEL and NEL were not significant. This suggests that while ADC may be a good marker of necrosis and is elevated in all portions of the T2 hyperintensity, there is considerable heterogeneity in the values within mixed regions of tumor and edema. Although the median levels of choline were similar to NAWM in both the CEL and NEL, there was considerable heterogeneity, both within each anatomic region and between patients. This is consistent with our previous studies that have shown substantial differences in the spatial extent of metabolic and anatomic lesions, and that these are more accurately defined by changes in levels of choline relative to N-acetylaspartate than by changes in choline alone.
The results obtained by comparing levels of choline and ADC in different anatomic regions suggested that the correlations between the two variables that had previously been observed were caused substantially by lesion and population heterogeneity rather than by a direct reflection of specific biological phenomena. When the median values in the relatively more homogeneous regions corresponding to the CEL or NEC were considered there was no correlation between choline and ADC, but when the values in the CEL and NEC were combined there was a clear negative correlation. This may be due to the smaller range of values for nADC and nCho, the relatively small number of voxels in each subregion or that there was truly no relationship between nADC and nCho within homogeneous regions of tumor or edema. For the combined CEL and NEC regions (CEL+NEC), the correlation between nADC and nCho seems to have been driven by the heterogeneity in relative amounts of necrosis and enhancing tumor within the lesion.
Heterogeneity in the composition of the anatomic regions for Grade IV gliomas also appears to contribute to the negative correlation between median choline and ADC in the nonenhancing lesions (NEL) and the overall T2 hyperintensity (T2all). The NEL is known to contain active tumor and varying levels of edema (7). Voxels that are predominantly tumor have high nCho and lower nADC, while voxels that are edematous have high ADC and lower choline. The median value of MR parameters in the NEL will therefore depend upon the number of voxels of each type that make up the region. The voxel level analysis is a more direct way of evaluating the correlation between nADC and nCho because it considers smaller, and hence potentially more homogeneous regions of morphology. Although the voxels for different regions within patients with Grade IV lesions did have more than 90% negative correlations, the Spearman rank correlation coefficient values were quite variable for individual patients and did not cluster around a specific value. This can be interpreted as indicating that, although there may be a relationship between high nCho and low ADC, there are multiple factors that have an influence on the observed values and there is no simple means of predicting one value from the other in any specific patient or anatomic region.
When considering explanations for relationships between levels of choline and ADC in gliomas, it is important to consider how different biological phenomena such as cellularity, proliferation, and cell density can influence their values. Previous studies that have related choline to histological parameters have typically considered relatively small patient populations of patients with gliomas of different grades, having received variable treatments. Several studies have reported that choline correlated with the proliferative index, Ki-67 (3,22,23) in mixed patient populations. Nafe et al (24) also observed a similar relationship in a homogeneous population of patients with Grade IV gliomas. Shimizu et al (3) found that Ki-67 was correlated with choline only within homogeneous nonenhancing regions and that there was no correlation within heterogeneous regions of gliomas. Croteau et al (25) and Miller et al (26) reported a significant correlation between choline and cellularity, while Gupta et al (2) suggested that there was a positive correlation between choline and cell density (27).
The situation is even more complex with respect to the relationships between ADC and other parameters. While Guo et al (28) were unable to detect a correlation between ADC and cellularity in a homogeneous population of patients with high-grade astrocytomas, other studies (5,18,29–31) that included a mixture of different types of gliomas have reported a significant inverse correlation. Calvar et al (32) reported a correlation between ADC and the proliferative Ki-67 index in a mixed patient population. Other factors that are known to affect ADC are the viscosity of the medium, barriers to diffusion between compartments, molecular crowding, presence of active transport, bulk flow in capillaries, and the length of diffusion observation (33–35). While Gupta et al (7) reported an inverse correlation of ADC and choline within the T2All for a heterogeneous population of patients at various stages of treatment, Catalaa et al (8) reported a strong negative correlation between mean ADC and mean choline within the NEL and CEL regions for patients with newly diagnosed Grade IV gliomas but not for Grade II or Grade III gliomas.
Overall, the results of our study and those that have been reported in the literature support the potential of using maps of choline or ADC in newly diagnosed, Grade IV gliomas to define regions containing proliferative and cellular tumor as opposed to necrosis or edema. It is not clear, however, whether either parameter provides direct, quantitative assessments of mitotic activity or cellularity that are consistent between individuals. Choline is a measure of cellular turnover, while ADC is a measure of the mobility of water. These parameters are related to cell density, but are not direct measures of the same phenomenon. If there is a requirement to make these connections, there should be a more detailed study using choline and ADC-guided biopsies within populations of patients that are homogeneous with respect to tumor grade and to the treatment that they have received. Other critical studies for understanding the clinical significance of these and other surrogate markers should consider the prognostic value of each specific parameter. Our preliminary analyses of ADC levels in patients with newly diagnosed Grade IV gliomas suggested that the presence of regions in the lesion that have low ADC was predictive of shorter survival, but whether this provides additional information over other MR parameters is unclear (36). While the level of choline did not appear to be prognostic of poor outcome in this population, high levels of lactate and lipid measured from the same MRSI data were associated with shorter survival.
In conclusion, based upon our findings in Grade IV and Grade II gliomas, it is recommended that future studies continue to acquire both DWI and MRSI data so that their prognostic significance can be fully established and so that more informed decisions can be made as to which is relevant for each specific patient at any particular time point in the course of their disease.
Acknowledgments
Contract grant sponsor: National Institutes of Health; Contract grant number: P50 CA97297; Contract grant sponsor: University of California (UC) Discovery Grant, sponsored jointly with GE Healthcare; Contract grant number: LSIT01-10107.
We thank Niles Bruce and Bert Jimenez of the Department of Radiology at UCSF for their assistance with data acquisition, as well as Esin Ozturk-Isik for her invaluable feedback in data analysis.
Footnotes
Presented in part at the 14th Annual Meeting of ISMRM, Seattle, WA, USA, 2006.
References
- 1.Nelson SJ, McKnight TR, Henry RG. Characterization of untreated gliomas by magnetic resonance spectroscopic imaging. Neuroimaging Clin N Am. 2002;12:599–613. doi: 10.1016/s1052-5149(02)00037-0. [DOI] [PubMed] [Google Scholar]
- 2.Gupta RK, Cloughesy TF, Sinha U, et al. Relationships between choline magnetic resonance spectroscopy, apparent diffusion coefficient and quantitative histopathology in human glioma. J Neurooncol. 2000;50:215–226. doi: 10.1023/a:1006431120031. [DOI] [PubMed] [Google Scholar]
- 3.Shimizu H, Kumabe T, Shirane R, Yoshimoto T. Correlation between choline level measured by proton MR spectroscopy and Ki-67 labeling index in gliomas. AJNR Am J Neuroradiol. 2000;21:659–665. [PMC free article] [PubMed] [Google Scholar]
- 4.Le Bihan D, Breton E, Lallemand D, Grenier P, Cabanis E, Laval-Jeantet M. MR imaging of intravoxel incoherent motions: application to diffusion and perfusion in neurologic disorders. Radiology. 1986;161:401–407. doi: 10.1148/radiology.161.2.3763909. [DOI] [PubMed] [Google Scholar]
- 5.Sugahara T, Korogi Y, Kochi M, et al. Usefulness of diffusion-weighted MRI with echo-planar technique in the evaluation of cellularity in gliomas. J Magn Reson Imaging. 1999;9:53–60. doi: 10.1002/(sici)1522-2586(199901)9:1<53::aid-jmri7>3.0.co;2-2. [DOI] [PubMed] [Google Scholar]
- 6.Moffat BA, Chenevert TL, Lawrence TS, et al. Functional diffusion map: a noninvasive MRI biomarker for early stratification of clinical brain tumor response. Proc Natl Acad Sci USA. 2005;102:5524–5529. doi: 10.1073/pnas.0501532102. [DOI] [PMC free article] [PubMed] [Google Scholar]
- 7.Gupta RK, Sinha U, Cloughesy TF, Alger JR. Inverse correlation between choline magnetic resonance spectroscopy signal intensity and the apparent diffusion coefficient in human glioma. Magn Reson Med. 1999;41:2–7. doi: 10.1002/(sici)1522-2594(199901)41:1<2::aid-mrm2>3.0.co;2-y. [DOI] [PubMed] [Google Scholar]
- 8.Catalaa I, Henry R, Dillon WP, et al. Perfusion, diffusion and spectroscopy values in newly diagnosed cerebral gliomas. NMR Biomed. 2006;19:463–475. doi: 10.1002/nbm.1059. [DOI] [PubMed] [Google Scholar]
- 9.Nelson SJ, Nalbandian AB, Proctor E, Vigneron DB. Registration of images from sequential MR studies of the brain. J Magn Reson Imaging. 1994;4:877–883. doi: 10.1002/jmri.1880040621. [DOI] [PubMed] [Google Scholar]
- 10.Nelson SJ. Analysis of volume MRI and MR spectroscopic imaging data for the evaluation of patients with brain tumors. Magn Reson Med. 2001;46:228–239. doi: 10.1002/mrm.1183. [DOI] [PubMed] [Google Scholar]
- 11.Basser PJ, Pierpaoli C. Microstructural and physiological features of tissues elucidated by quantitative-diffusion-tensor MRI. J Magn Reson B. 1996;111:209–219. doi: 10.1006/jmrb.1996.0086. [DOI] [PubMed] [Google Scholar]
- 12.Hartkens T, Rueckert D, Schnabel JA, Hawkes DJ, Hill DLG. BVM. Vol. 2002. Leipzig: Springer-Verlag; Mar, 2002. VTK CISG Registration Toolkit: an open source software package for affine and non-rigid registration of single- and multimodal 3D images. [Google Scholar]
- 13.Saraswathy S, Crawford F, Nelson S. Semi-automated segmentation of brain tumor lesions in MR images. Proceedings of the 14th Annual Meeting of ISMRM; Seattle, WA, USA. 2006. (Abstract 1609) [Google Scholar]
- 14.Zhang Y, Brady M, Smith S. Segmentation of brain MR images through a hidden Markov random field model and the expectation-maximization algorithm. IEEE Trans Med Imaging. 2001;20:45–57. doi: 10.1109/42.906424. [DOI] [PubMed] [Google Scholar]
- 15.Bulakbasi N, Guvenc I, Onguru O, Erdogan E, Tayfun C, Ucoz T. The added value of the apparent diffusion coefficient calculation to magnetic resonance imaging in the differentiation and grading of malignant brain tumors. J Comput Assist Tomogr. 2004;28:735–746. doi: 10.1097/00004728-200411000-00003. [DOI] [PubMed] [Google Scholar]
- 16.Tozer DJ, Jager HR, Danchaivijitr N, et al. Apparent diffusion co-efficient histograms may predict low-grade glioma subtype. NMR Biomed. 2007;20:49–57. doi: 10.1002/nbm.1091. [DOI] [PubMed] [Google Scholar]
- 17.Vuori K, Kankaanranta L, Hakkinen AM, et al. Low-grade gliomas and focal cortical developmental malformations: differentiation with proton MR spectroscopy. Radiology. 2004;230:703–708. doi: 10.1148/radiol.2303021804. [DOI] [PubMed] [Google Scholar]
- 18.Tien RD, Felsberg GJ, Friedman H, Brown M, MacFall J. MR imaging of high-grade cerebral gliomas: value of diffusion-weighted echoplanar pulse sequences. AJR Am J Roentgenol. 1994;162:671–677. doi: 10.2214/ajr.162.3.8109520. [DOI] [PubMed] [Google Scholar]
- 19.Oh J, Henry RG, Pirzkall A, et al. Survival analysis in patients with glioblastoma multiforme: predictive value of choline-to-N-acetylaspartate index, apparent diffusion coefficient, and relative cerebral blood volume. J Magn Reson Imaging. 2004;19:546–554. doi: 10.1002/jmri.20039. [DOI] [PubMed] [Google Scholar]
- 20.Sinha S, Bastin ME, Whittle IR, Wardlaw JM. Diffusion tensor MR imaging of high-grade cerebral gliomas. AJNR Am J Neuroradiol. 2002;23:520–527. [PMC free article] [PubMed] [Google Scholar]
- 21.Dowling C, Bollen AW, Noworolski SM, et al. Preoperative proton MR spectroscopic imaging of brain tumors: correlation with histopathologic analysis of resection specimens. AJNR Am J Neuroradiol. 2001;22:604–612. [PMC free article] [PubMed] [Google Scholar]
- 22.Herminghaus S, Pilatus U, Moller-Hartmann W, et al. Increased choline levels coincide with enhanced proliferative activity of human neuroepithelial brain tumors. NMR Biomed. 2002;15:385–392. doi: 10.1002/nbm.793. [DOI] [PubMed] [Google Scholar]
- 23.Tamiya T, Kinoshita K, Ono Y, Matsumoto K, Furuta T, Ohmoto T. Proton magnetic resonance spectroscopy reflects cellular proliferative activity in astrocytomas. Neuroradiology. 2000;42:333–338. doi: 10.1007/s002340050894. [DOI] [PubMed] [Google Scholar]
- 24.Nafe R, Herminghaus S, Pilatus U, et al. Morphology of proliferating and non-proliferating tumor cell nuclei in glioblastomas correlates with preoperative data from proton-MR-spectroscopy. Neuropathology. 2004;24:172–182. doi: 10.1111/j.1440-1789.2004.00547.x. [DOI] [PubMed] [Google Scholar]
- 25.Croteau D, Scarpace L, Hearshen D, et al. Correlation between magnetic resonance spectroscopy imaging and image-guided biopsies: semiquantitative and qualitative histopathological analyses of patients with untreated glioma. Neurosurgery. 2001;49:823–829. doi: 10.1097/00006123-200110000-00008. [DOI] [PubMed] [Google Scholar]
- 26.Miller BL, Chang L, Booth R, et al. In vivo 1H MRS choline: correlation with in vitro chemistry/histology. Life Sci. 1996;58:1929–1935. doi: 10.1016/0024-3205(96)00182-8. [DOI] [PubMed] [Google Scholar]
- 27.Gill SS, Thomas DG, Van Bruggen N, et al. Proton MR spectroscopy of intracranial tumours: in vivo and in vitro studies. J Comput Assist Tomogr. 1990;14:497–504. doi: 10.1097/00004728-199007000-00001. [DOI] [PubMed] [Google Scholar]
- 28.Guo AC, Cummings TJ, Dash RC, Provenzale JM. Lymphomas and high-grade astrocytomas: comparison of water diffusibility and histologic characteristics. Radiology. 2002;224:177–183. doi: 10.1148/radiol.2241010637. [DOI] [PubMed] [Google Scholar]
- 29.Chen J, Xia J, Zhou YC, et al. Correlation between magnetic resonance diffusion weighted imaging and cell density in astrocytoma. Zhonghua Zhong Liu Za Zhi. 2005;27:309–311. [PubMed] [Google Scholar]
- 30.Kono K, Inoue Y, Nakayama K, et al. The role of diffusion-weighted imaging in patients with brain tumors. AJNR Am J Neuroradiol. 2001;22:1081–1088. [PMC free article] [PubMed] [Google Scholar]
- 31.Gauvain KM, McKinstry RC, Mukherjee P, et al. Evaluating pediatric brain tumor cellularity with diffusion-tensor imaging. AJR Am J Roentgenol. 2001;177:449–454. doi: 10.2214/ajr.177.2.1770449. [DOI] [PubMed] [Google Scholar]
- 32.Calvar JA, Meli FJ, Romero C, et al. Characterization of brain tumors by MRS, DWI and Ki-67 labeling index. J Neurooncol. 2005;72:273–280. doi: 10.1007/s11060-004-3342-2. [DOI] [PubMed] [Google Scholar]
- 33.Brunberg JA, Chenevert TL, McKeever PE, et al. In vivo MR determination of water diffusion coefficients and diffusion anisotropy: correlation with structural alteration in gliomas of the cerebral hemispheres. AJNR Am J Neuroradiol. 1995;16:361–371. [PMC free article] [PubMed] [Google Scholar]
- 34.Garcia-Perez AI, Lopez-Beltran EA, Kluner P, Luque J, Ballesteros P, Cerdan S. Molecular crowding and viscosity as determinants of translational diffusion of metabolites in subcellular organelles. Arch Biochem Biophys. 1999;362:329–338. doi: 10.1006/abbi.1998.1051. [DOI] [PubMed] [Google Scholar]
- 35.Tanner JE. Intracellular diffusion of water. Arch Biochem Biophys. 1983;224:416–428. doi: 10.1016/0003-9861(83)90228-x. [DOI] [PubMed] [Google Scholar]
- 36.Crawford F, Khayal I, Lamborn K, et al. Pre-surgery lactate, lipid, and ADC predict survival for patients with glioblastoma multiforme. Proceedings of the 14th Annual Meeting of ISMRM; Seattle, WA, USA. 2006. (Abstract 758) [Google Scholar]