

Abstract
The zebrafish camouflage response is an innate “hard-wired” behavior that offers an excellent opportunity to explore neural circuit assembly and function. Moreover, the camouflage response is sensitive to ethanol, making it a tractable system for understanding how ethanol influences neural circuit development and function. Here we report the identification of corticotropin-releasing factor (CRF) as a critical component of the camouflage response pathway. We further show that ethanol, having no direct effect on the visual sensory system or the melanocytes, acts downstream of retinal ganglion cells and requires the CRF-proopiomelanocortin pathway to exert its effect on camouflage. Treatment with ethanol, as well as alteration of light exposure that changes sensory input into the camouflage circuit, robustly modifies CRF expression in subsets of neurons. Activity of both adenylyl cyclase 5 and extracellular signal-regulated kinase (ERK) is required for such ethanol-induced or light-induced plasticity of crf expression. These results reveal an essential role of a peptidergic pathway in camouflage that is regulated by light and influenced by ethanol at concentrations relevant to abuse and anxiolysis, in a cAMP-dependent and ERK-dependent manner. We conclude that this ethanol-modulated camouflage response represents a novel and relevant system for molecular genetic dissection of a neural circuit that is regulated by light and sensitive to ethanol.
Introduction
Understanding neural circuit assembly and function is challenging given the complexity of the nervous system and the diverse stimuli that it faces, not only those that act through various sensory systems but also psychoactive substances, which can directly penetrate and influence the brain. Systems with reduced complexity that are accessible to molecular genetic manipulations are therefore desirable for addressing this problem.
Innate behaviors present an excellent opportunity to explore neural circuit assembly and function, as they are often robust and “hardwired”; for example, olfaction-guided behaviors in Caenorhabditis elegans (Macosko et al., 2009) and courtship in Drosophila (Stockinger et al., 2005). Studies of ethanol-modulated locomotor behaviors in these invertebrates have revealed critical molecular mechanisms underlying ethanol sensitivity (Moore et al., 1998; Davies et al., 2003; for review, see Wolf and Heberlein, 2003; Scholz, 2009; McIntire, 2010). An innate behavior that is modifiable by psychoactive substances such as ethanol therefore provides a robust and quantifiable index for probing circuitry as well as the effect of these substances.
Camouflage (also known as background adaptation or color change) is an innate behavior exhibited by many vertebrates and plays a critical role in facilitating foraging, antipredator responses, and social communication. Rather than manifesting through movement of the animal, camouflage manifests as a cellular behavior of neural crest-derived pigment cells (Fujii, 2000; Nascimento et al., 2003); pigmented organelles inside these cells undergo aggregation (in light) or dispersal (in dark), giving the animal a light or dark appearance, respectively. Despite the implication of a variety of neurotransmitter and neuropeptide systems in regulating camouflage in vitro (Fujii, 2000; Kolk et al., 2002; Dulcis and Spitzer, 2008), which neuronal groups are involved in vivo and how they act coherently in a circuit to regulate behavior remain poorly understood.
Camouflage behavior is observable at single cell resolution in larval zebrafish, a vertebrate system that is highly amenable to molecular genetic manipulations (Kelsh et al., 1996; Logan et al., 2006). Ethanol robustly modulates this behavior by stimulating melanosome (the pigmented organelle) dispersal (Lockwood et al., 2004; Guo et al., 2009; Peng et al., 2009). However, it is not known how ethanol affects the camouflage circuit. In this study, we identified the corticotropin-releasing factor (CRF) (Vale et al., 1981; Owens and Nemeroff, 1991)-proopiomelanocortin (POMC) pathway as a critical regulator of the camouflage behavior. We further showed that ethanol had no direct effect on melanocytes, acted downstream of the retinal ganglion cells (RGCs), and required the activity of crf and pomc to stimulate melanosome dispersal. Treatment with ethanol changed crf expression in neuronal subtypes of the telencephalon, pretectal area, hypothalamus, and hindbrain. Varying lighting conditions during rearing also altered crf expression in a pattern that is similar but not identical to that of ethanol. Disruption of the evolutionarily conserved adenylyl cyclase 5 (AC5) or pharmacological inhibition of extracellular signal-regulated kinase (ERK) phosphorylation impaired both ethanol-induced and dark-induced crf expression, suggesting that cAMP and ERK pathways are critical molecular mechanisms underlying the plasticity of crf expression regulated by light and ethanol.
Materials and Methods
Zebrafish strains and husbandry.
Two wild-type strains were used in this study: AB and Tübingen, which were obtained from Zebrafish International Resource Center (ZIRC) in Eugene, Oregon. The mutants lakritz (lkz) (Neuhauss et al., 1999; Kay et al., 2001) and fantasma (fan) (Peng et al., 2009) were also used. All fish were raised and kept in our fish facility at the University of California, San Francisco, CA. Fish breeding and maintenance were performed as described previously (Westerfield, 1995). Embryos were raised in an incubator at 28°C from birth to 7 days postfertilization (dpf) and staged according to Kimmel et al. (1995).
Behavioral assays.
Camouflage behavior was observed in an enclosable compartment (length × width × height: 47 × 35 × 34 cm) with white background and light illumination from above. For light-induced melanosome aggregation, larval zebrafish (5–7 dpf) in 90 mm Petri dish containing 40 ml of blue egg water (0.2 g/L Instant Ocean salt, 0.12 g/L CaSO4, and 0.001% methylene blue) were transferred to the compartment (without enclosure) and subjected to light for 1 h. For dark-induced melanosome dispersal, Petri dishes containing larval zebrafish were transferred to the compartment with enclosure for 30 min. For ethanol-induced melanosome dispersal, larval zebrafish were subjected to 1.5% (v/v; equals 257 mm) ethanol in the medium in the presence of light for 20 min. This corresponds to 25 mm internal ethanol concentration, which is within the range of what human drinkers experience (Lockwood et al., 2004). Treated animals were fixed with 4% paraformaldehyde after light, dark, or ethanol treatment. Images were taken using a Zeiss Axioscope 2 compound microscope equipped with an AxioCam CCD camera controlled by Axiovision software. The melanocyte-covered area was measured in a 220 × 220 pixel frame covering the head region (from the pineal gland to otic vesicles and excluding the dark area covered by eyes (supplemental Fig S1, available at www.jneurosci.org as supplemental material) using ImageJ 1.34s software from the National Institutes of Health. Maximal dispersed state of melanosomes in a particular experiment is considered 100%.
The optokinetic response (OKR) assay was carried out as described previously (Brockerhoff et al., 1995).
Melanocyte primary culture and imaging analysis.
Skin from the head region of 3 dpf larval zebrafish was peeled off and cut into small pieces in L15 medium (Invitrogen) using custom-made tungsten needles, followed by further trituration through glass needles made from glass capillaries (1.5 mm outer diameter /1.12 mm inner diameter; catalog #TW150-4, World Precision Instruments). Melanocytes were transferred into polylysine (0.01% solution; Sigma)-coated glass bottom culture dishes (MatTek Cultureware) containing L15 medium with 25 mm HEPES buffer, pH 7.0, 2 mm l-glutamine, and antibiotics (penicillin/ streptomycin, Sigma) using glass needles attached to a mouth pipette (aspirator tube assembly; catalog #A5177-5EA, Sigma). Cultures were incubated at 28°C for 18–24 h.
Differential interference contrast (DIC) images of melanocytes were acquired using a Photometrics cooled CCD camera attached to a Nikon eclipse TE200 microscope. Images were analyzed using the Nikon Elements software. To calculate the dispersal index, pixel area covered by melanosomes was measured after thresholding images.
Pharmacological treatment.
Forskolin and IBMX were used at 25 and 100 μm, respectively, during culture incubation (18–24 h). Noradrenaline (NA) (final concentration of 1 μm) and α-melanocyte stimulating hormone (α-MSH) (final concentration ranging from 10 pm to 1 μm) were used for cultured melanocytes. For in vivo experiments, 1 μm α-MSH (10 nl/larva) was injected into the circulation, and 200 μm CRF (30 nl/larva) was injected into the ventral forebrain of larvae embedded in low melting agarose. Antalarmin (CRF receptor-1 antagonist) and K41498 (CFR receptor-2 antagonist) were injected at 25 μm in 0.1% DMSO (60 nl/larva) into the ventral brain of immobilized larvae. The mitogen-activated protein kinase kinase (MEK) inhibitor PD98059 was used in a bath application at 50 μm as described previously (Peng et al., 2009).
Morpholinos and microinjection.
Morpholino (MO) antisense oligonucleotides were purchased from Gene Tools. The pomc-a MO (5′-ACAACATCCTCACTCCCCTCACCAT-3′) and crf MO (5′-TGGTGACGAGAAAATTGAGCTTCAT-e′) were designed to interfere with RNA translation; control MO (5′-CCTCTTACCTCAGTTACAATTTATA-3′) was used. Approximately 3–4 nl of 0.1 mm pomc-a MO and 1 nl of 0.05 mm crf MO were injected at the one-cell or two-cell stage.
In situ hybridization and immunostaining.
RNA in situ hybridization and immunostaining were performed as described previously (Guo et al., 1999). To assess the impact of lighting conditions and ethanol on crf expression, siblings were used and different treatment conditions were processed for in situ hybridization side-by-side with identical procedures. Image quantification was carried out in an identical manner across different treatment conditions: DIC images were captured at 3900 × 3090 pixels with the AxioCam camera attached to a Zeiss Axioskop 2 compound microscope using 20× objective. Images were thresholded using “set color threshold” in the MetaMorph software (Molecular Device) (supplemental Fig. S4, available at www.jneurosci.org as supplemental material). Integrated intensity of individual CRF-expressing clusters was measured and converted to a normalized ratio by dividing each value by the average intensity of corresponding light-reared control groups.
Antiserum for human adrenocorticotropic hormone (ACTH) was obtained from Harbor-UCLA Medical Center (Torrance, CA) and used at 1:1000 dilution. Two anti-CRF antibodies were used: one was from Advanced Targeting Systems (catalog #AB-01), and the other (PBL rC70) was a gift from Dr. Wylie Vale (Salk Institute, La Jolla, CA). Both antibodies were used at 1:500 dilution and showed similar immunostaining patterns in 5–8 dpf zebrafish. To reveal labeling of the soma, 10 nl of 25 mg/ml colchicine was injected into the brain ventricle of larval zebrafish, which were subsequently subjected to immunostaining with CRF antibodies.
Statistical analysis.
We used GraphPad Prism 5 for statistical analysis. The Student's t test, single-factor ANOVA, or regular two-way ANOVA with the Bonferroni posttest was applied to assess significant effects between two groups. Average values for each group were plotted with error bars representing SEM.
Results
Corticotropin releasing factor is essential for camouflage behavior in larval zebrafish
CRF was originally identified as a neuropeptide that stimulates pituitary secretion of corticotropin and β-endorphin (Vale et al., 1981). In vitro experiments using Xenopus tissues suggest a role of CRF, among many other neuropeptides and transmitters, in controlling the release of α-MSH from the pituitary (Verburg-Van Kemenade et al., 1987; Kolk et al., 2002). We sought to determine whether CRF is essential for regulating camouflage behavior in vivo in zebrafish. Zebrafish CRF is encoded by a single gene located on linkage group 24, with exon 2 spanning the entire open reading frame (Fig. 1A). crf expression has been detected in the adult as well as the embryonic zebrafish brain (Alderman and Bernier, 2007, 2009; Chandrasekar et al., 2007). In 5 dpf larvae, we detected crf expression mainly as six clusters located in the telencephalon, preoptic region, pretectal area, posterior tuberculum, hypothalamus, and hindbrain (Fig. 1B). To perturb CRF gene activity, we designed a translation-blocking, morpholino-modified, antisense oligonucleotide-targeting CRF and injected it into zebrafish embryos at the one-stage to two-cell stage. To determine the efficacy of the morpholino antisense oligonucleotide, we used two CRF-specific antibodies, both of which labeled axonal processes but not cell bodies in the control morpholino-injected animals (Fig. 1C). This is consistent with prior observations that the CRF protein is detectable largely in processes (Sawchenko et al., 1984). Indeed, injecting colchicine into the larval brain ventricle, which disrupts axonal transport, allowed the CRF protein to be detected in the cell soma, albeit with a significant amount of variability (supplemental Fig. S2, available at www.jneurosci.org as supplemental material). Animals injected with the morpholino antisense oligonucleotide-targeting crf (referred to as crf morphants) were morphologically indistinguishable from control animals but had significantly reduced CRF immunoreactivity (Fig. 1F), indicating that the morpholino knockdown was efficacious (the specificity of the morpholino antisense oligonucleotide was addressed in the context of the ethanol experiment as described later). Animals injected with control or the crf morpholino antisense oligonucleotides were then subjected to different lighting conditions at 5 dpf. While control animals aggregated or dispersed melanosomes in light versus dark environment respectively (Fig. 1D,E,M), crf morphants had attenuated melanosome dispersal in darkness (Fig. 1G,H,M). The two-way ANOVA test showed that the morpholino effect is dependent on light or dark conditions (F = 26.17, DFn = 1, DFd = 44, p < 0.0001, where n is numerator and d is denominator of the degrees of freedom, DF) with Bonferroni posttest revealing the significant effect of crf morpholino in dark compared to control morpholino in dark (p < 0.001). However, the crf morpholino did not cause a complete block of melanosome dispersal, as post hoc test showed significant difference between light control MO and Dark crf MO (p < 0.001).
Figure 1.
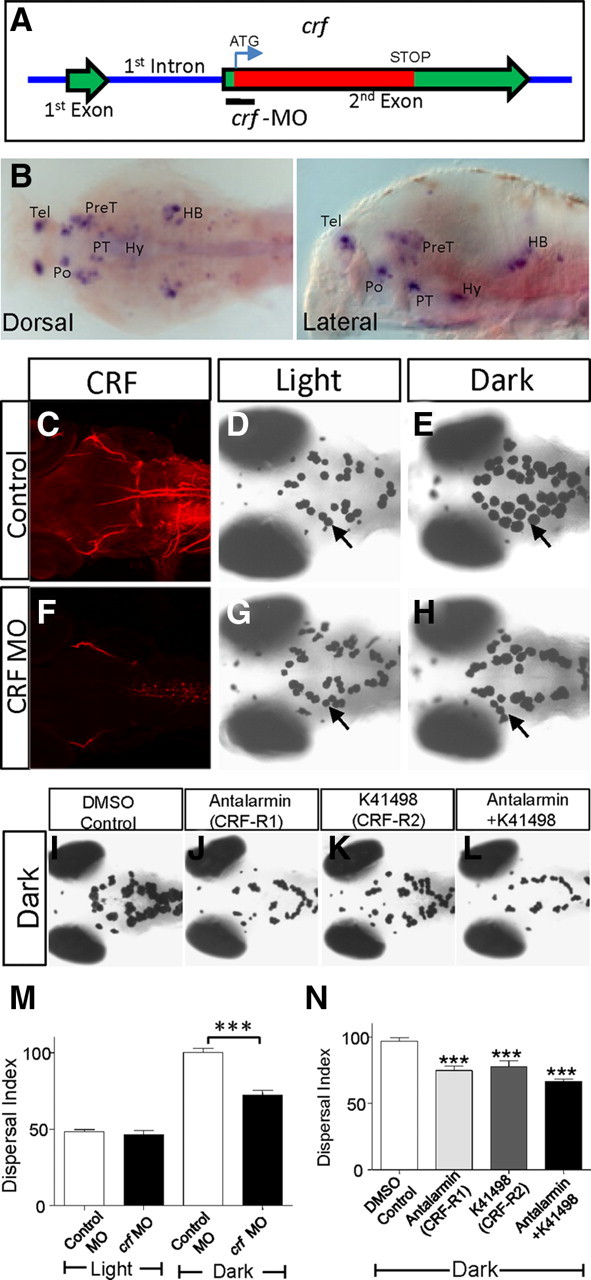
Corticotropin-releasing factor is necessary for the camouflage behavior. A, Schematic showing the crf genomic locus, indicating the crf ORF encoded within the exon 2. The crf MO, which blocks crf translation, is indicated. B, Dorsal and lateral views of 5 dpf zebrafish larvae showing crf expression in the telencephalon (Tel), pretectum (PreT), preoptic (Po), posterior tubercle (PT), hypothalamus (Hy), and hindbrain (HB). C–H, The CRF immunostaining is detected in axonal processes of 5-d-old control morphant (C) and is greatly reduced in the crf morphant (F). Images of 5 dpf control (D, E) or the crf morphant (G, H) exposed to light (D, G) or darkness (E, H). I–L, Images of 5 dpf larvae with brain injection of DMSO control (I), CRF receptor-1 antagonist antalarmin (J), CRF receptor-2 antagonist K41498 (K), or both (L) and exposed to darkness. M, N, Quantification of melanosome dispersal in control versus crf morpholino-injected animals (M) (***p < 0.001, n = 12, two-way ANOVA) and in CRF-R antagonist-injected animals (N) exposed to light or dark as indicated (drug treatment compared to DMSO control, ***p < 0.001, n = 10, one-way ANOVA).
As additional evidence to support the morpholino antisense oligonucleotide-mediated knockdown, as well as to probe the involvement of CRF receptor subtypes in regulating camouflage behavior, we determined whether selective pharmacological antagonists to CRF receptors would impair camouflage behavior. Two CRF receptors (R1 and R2) similar to those of mammals are reported in zebrafish (Alderman and Bernier, 2009). We injected larval zebrafish with antalarmin, a CRF-R1 selective antagonist, or K414198, a CRF-R2 selective antagonist (Müller and Wurst, 2004), and exposed the injected animals to a dark environment. Either antagonist alone or in combination significantly attenuated dark-induced melanosome dispersal (Fig. 1I,L,N), suggesting that both receptor subtypes are important for regulating camouflage behavior. These results indicate that CRF is an essential regulator of the camouflage behavior in larval zebrafish that acts to promote melanosome dispersal in response to darkness, likely via both CRF-R1 and CRF-R2 subtypes.
Camouflage behavior also requires pomc in larval zebrafish
CRF is known to stimulate the secretion of pituitary hormones including ACTH and β-endorphin, both encoded by the pomc gene. α-MSH, which can promote melanosome dispersal in cultured melanocytes and larval zebrafish (Sheets et al., 2007) (supplemental Fig. S3, available at www.jneurosci.org as supplemental material), is also generated by a proteolytic cleavage from POMC (Fig. 2A). Two pomc genes, pomc-a and pomc-b, are detected in zebrafish, while pomc-b appears to be a pseudogene (Gonzalez-Nunez et al., 2003; Hansen et al., 2003). pomc-a expression was detected primarily in the pituitary, with weaker expression also found in the hypothalamic region (Fig. 2B) (Herzog et al., 2004). To establish an in vivo requirement of pomc in regulating camouflage behavior, a morpholino antisense oligonucleotide that interferes with the translation of pomc-a was designed and injected into zebrafish embryos. Knockdown of pomc-a activity was evident by the significant reduction of ACTH immunoreactivity in the 5 dpf morphant (Fig. 2C,F). Similar to crf morphants, the pomc-a morphants exhibited attenuated melanosome dispersal in darkness (Fig. 2, compare H to E, I). The two-way ANOVA test showed that the morpholino effect is dependent on light or dark conditions (F = 4.58, DFn = 1, DFd = 32, p = 0.04) with Bonferroni posttest revealing the significant effect of pomc morpholino in dark compared to control morpholino in dark p < 0.01. These results establish an essential role of pomc in promoting melanosome dispersal in vivo in response to darkness.
Figure 2.
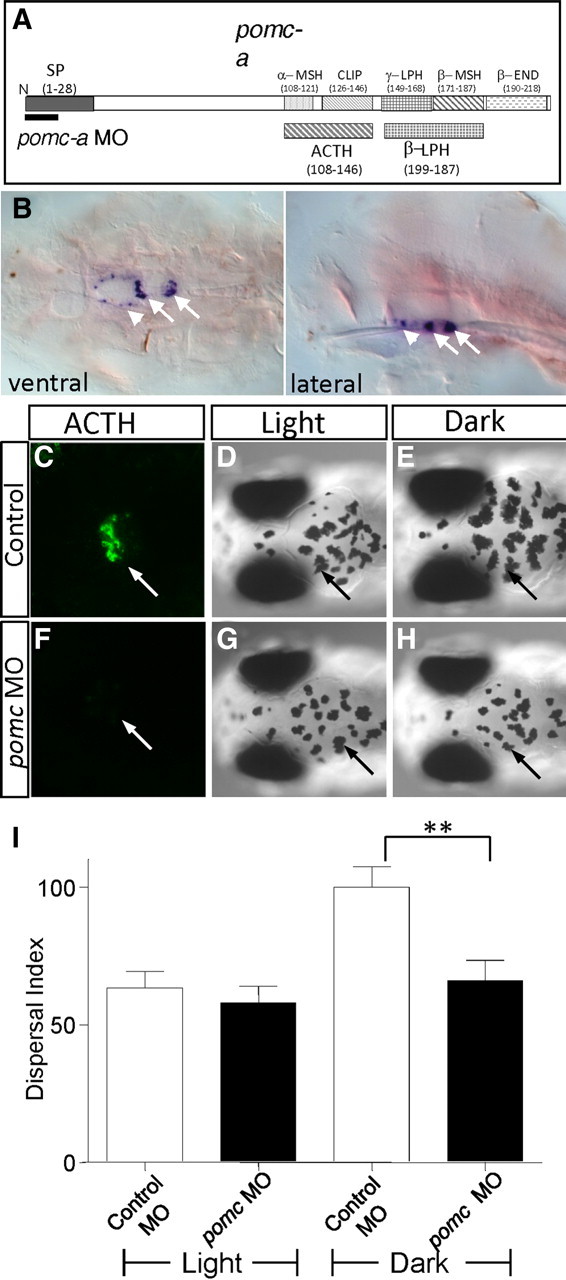
Reduction of pomc gene activity impairs the camouflage behavior. A, Schematic showing pomc-a structure, indicating the encoded putative neuropeptides. The pomc-a MO, which blocks pomc-a translation, is indicated. CLIP, Corticotropin-like protein; β-END, β-endorphin; LPH, lipotropin; SP, signal peptide. B, pomc-a expression is primarily detected in the pituitary (arrows) of 3-d old larval zebrafish. The arrowhead denotes the labeling in the hypothalamus. C–H, The ACTH immunostaining is detected in the pituitary (arrow) of 5-d-old control (C) and is undetectable in the pomc morphant (F). Images of 5 dpf control (D–E) or pomc-a morphant (G–H) exposed to light (D, G), dark (E, H). I, Quantification of melanosome dispersal in animals treated with various conditions as indicated; n = 10 for each condition (**p < 0.001, n = 9, two-way ANOVA).
Ethanol modulates camouflage behavior independently of sensory perturbation by acting downstream of the retinal ganglion cells in larval zebrafish
We have previously shown that the camouflage behavior was sensitive to ethanol such that acute ethanol exposure led to robust melanosome dispersal, hence overriding the effect of light (Peng et al., 2009). Since larval zebrafish were systemically exposed to ethanol, which could have exerted its effect on one or more components of the camouflage circuit including those that perceive sensory input, transduce sensory information, or generate functional output (i.e., the melanocytes), we first asked whether ethanol influenced the camouflage behavior through impairing sensory perception, as the inability to sense light causes melanosome dispersal in many visually impaired mutant zebrafish (Neuhauss et al., 1999). Using an established visual test, the OKR assay (Brockerhoff et al., 1995; Roeser and Baier, 2003) in which animals display saccadic eye movements in response to a visual input, we found that ethanol-exposed larvae exhibited a normal OKR compared to controls and were distinct from larvae without a visual stimulus (mimicking the visually impaired condition) (Fig. 3A,B). This result indicates that ethanol does not perturb sensory perception needed to display the OKR.
Figure 3.
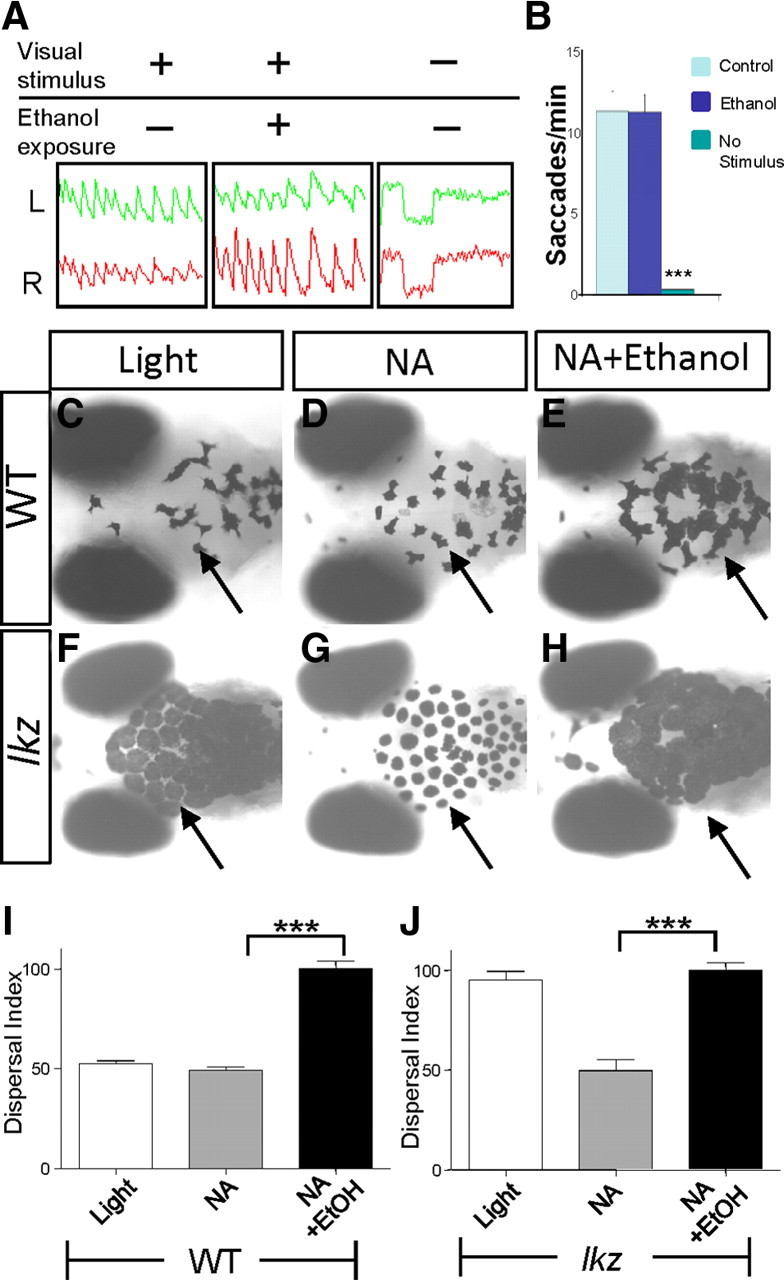
Ethanol acts downstream of RGCs to modulate camouflage in larval zebrafish. A, Periodic stimulation leads to periodic optokinetic responses in both the left (L, green graphs) and right (R, red graphs) eyes of wild-type control presented with a moving visual stimulus (left), wild type pretreated with 1.5% (257 mm) ethanol for 20 min followed by presentation of a moving visual stimulus (middle), or wild-type control with no moving visual stimulus (right). B, Quantification of saccades per minute shows that the ethanol-treated larval zebrafish exhibit a normal OKR response as compared to control. Animals without presentation of a moving visual stimulus show no OKR response as compared to control (***p < 0.001, n = 4, one-way ANOVA). C–H, Images of 6 dpf larval wild-type siblings (C–E) and the lakritz mutant (F–H) exposed to light (C, F), NA (D, G), and ethanol plus NA (E, H). I,J, Quantification of melanosome dispersal in wild-type siblings (I) and the lakritz mutant (J) (***p < 0.001, n = 6, one-way ANOVA). EtOH, Ethanol.
It remained possible, however, that the camouflage response might engage the nonimage-forming visual sensory system, which may not be assessed by the OKR assay but might be perturbed by ethanol. Without an alternative assay to probe specifically the nonimaging-forming visual sensory system in zebrafish, we decided to address this question through employment of the zebrafish mutant lakritz. The lakritz mutant suffers a complete yet specific lack of all RGCs (Neuhauss et al., 1999; Kay et al., 2001), which are the sole output neurons from the retina to the CNS and consequently undergo constitutive melanosome dispersal (Fig. 3F). NA treatment caused significant aggregation of melanosomes in both wild type (Fig. 3D) and the lakritz mutant (Fig. 3G) by acting directly on melanocytes (Peng et al., 2009). In wild type, ethanol treatment counteracted the effect of NA and dispersed melanosomes (Fig. 3E,I). We reasoned that if ethanol influenced the camouflage behavior through impairing visual sensory perception, ethanol treatment should not be able to counteract the effect of NA in the lakritz mutant and thereby would leave them with the NA-induced light appearance. Ethanol exposure, however, dramatically dispersed melanosomes in the NA-treated lakritz mutant (Fig. 3H,J), similar to if not in excess of its effect in wild-type siblings (Fig. 3E,I). Therefore, this result indicates that ethanol influences the camouflage behavior, not by impairing visual sensory perception but by acting through components downstream of the RGCs.
Ethanol modulates camouflage behavior through an indirect effect on melanocytes
We next asked whether ethanol acted directly on melanocytes by determining whether it would cause melanosome dispersal in isolated melanocytes. We established a primary culture system using melanocytes derived from larval zebrafish. These melanocytes in culture did not respond to light or dark and constitutively dispersed melanosomes (Fig. 4A,D,G,J), confirming that camouflage is indeed a “system” rather than a direct response of melanocytes to background illumination. This observation also indicated that dispersal is a “default” state in the culture setting, which, however, posed a problem for examining the effect of ethanol in the culture system, as ethanol's effect is to cause melanosome dispersal. Therefore, to visualize ethanol's effect, we treated the cultured primary melanocytes with NA, which readily aggregated melanosomes (Fig. 4B,E,K,M). The effect of 100 nm to 10 μm ΝΑ was assessed, and a minimum of 1 μm ΝΑ reliably elicited melanosome aggregation that could be counteracted by 5 μm forskolin (Fig. 4C,P) and was reversible by replacing NA with the culture medium. Contrasting its effect in vivo (Fig. 3E), ethanol did not disperse melanosomes in culture in the presence of NA (Fig. 4F,Q). Addition of ethanol at concentrations ranging from 0.2% (34 mm) to 1.5% (257 mm) had no effect, nor did changing the order of NA and ethanol treatment. The effect of melanin concentrating hormone (MCH), another agent that can aggregate melanosomes in culture (Sheets et al., 2007), was also assessed over a 1 nm to 1 μm range, and a minimum of 100 nm showed a reproducible effect on melanosome aggregation (Fig. 4H). Concentration of 0.2% (34 mm) or 1.5% (257 mm) ethanol, however, did not cause any dispersal in the presence of 100 nm MCH (Fig. 4I,R).
Figure 4.
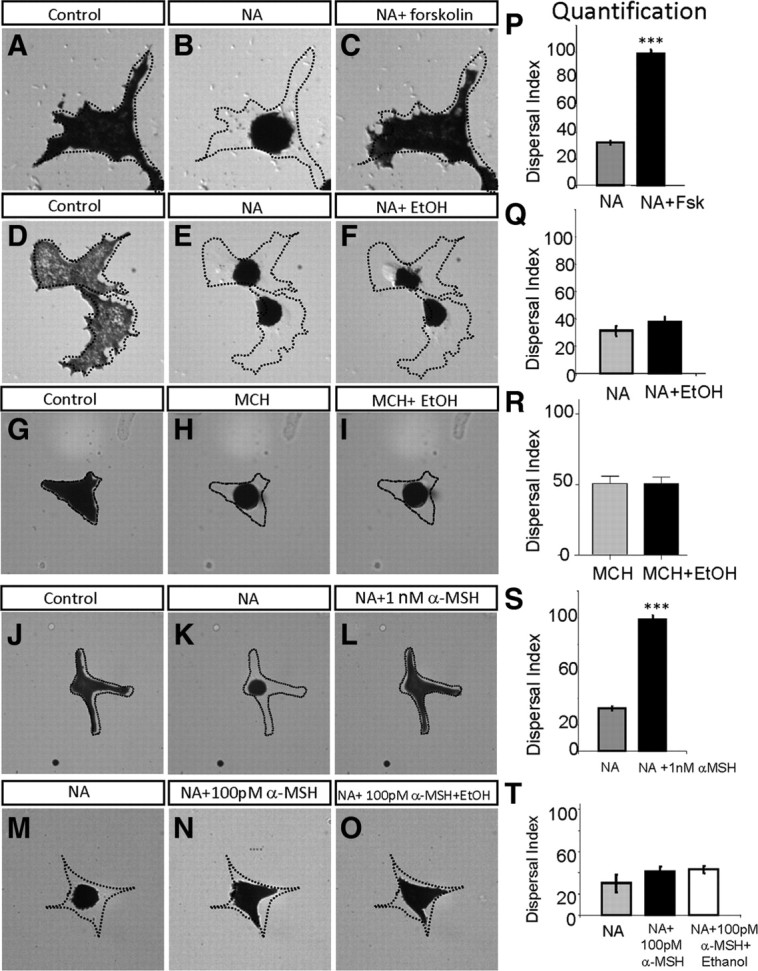
Acute ethanol exposure has no direct effect on melanocytes. A–C, P, Time-lapse images of cultured melanocytes under different conditions: control (without treatment; ethanol-treated or forskolin-treated undergoes similar dispersal) (A), 10 min following treatment with 1 μm NA (B), and 10 min following addition of 5 μm forskolin in the presence of NA (C); quantification is shown in P (***p < 0.001, n = 8, Student's t test). D–F, Q, Melanocytes of control (D), treated with NA for 10 min (E), following addition of 1.5% ethanol (EtOH) (v/v) in the presence of NA for 20 min (F); quantification is shown in Q (not significant, n = 6, Student's t test). G–I, R, Melanocytes of control (G), treated with MCH for 10 min (H), followed by the addition of 1.5% ethanol (v/v) in the presence of MCH for 20 min (I); quantification is shown in R (not significant, n = 6, Student's t test). J–L, S, Melanocytes of control (J), treated with NA for 10 min (K), followed by the addition of 1 nm α-MSH (L); quantification is shown in S (***p < 0.001, n = 6, Student's t test). M–O, T, NA-treated melanocyte with aggregated melanosomes (M), 20 min following treatment with 100 pm α-MSH (N), and 20 min following the addition of 1.5% ethanol in the presence of NA and α-MSH (O); quantification is shown in T (not significant, n = 7, one-way ANOVA).
Before concluding that ethanol had no direct effect on melanocytes, we addressed the possibility that the culture environment might be lacking some critical signaling molecule present in vivo with which ethanol needs to collaborate to have a direct effect on melanocytes. It has been previously shown that ethanol can enhance the interaction between ligand and G-protein-coupled receptors (GPCRs) in cultured cells (Yoshimura and Tabakoff, 1995); we therefore wondered whether the lack of an effect of ethanol on cultured melanocytes was due to the lack of a relevant GPCR ligand in vitro. The GPCR ligand α-MSH, which disperses melanosomes both in vivo (supplemental Fig. S3, available at www.jneurosci.org as supplemental material) and in vitro (Fig. 4L), is the most plausible candidate. We thus determined whether ethanol could facilitate melanosome dispersal in the presence of α-MSH. In cultured melanocytes pretreated with NA (1 μm), α-MSH led to full melanosome dispersal at 1 nm (Fig. 4L,S) and slight dispersal at 100 pm (Fig. 4N). Addition of ethanol in the presence of α-MSH (100 pm) did not augment the effect of α-MSH on melanosome dynamics (Fig. 4O,T). Together, these results indicate that ethanol's effect on camouflage behavior is unlikely due to its direct effect on melanocytes.
Ethanol requires CRF-POMC to regulate camouflage behavior
As we have shown in this study, CRF and the downstream POMC are critical for promoting melanosome dispersal during camouflage. We wondered whether ethanol might act through this pathway to stimulate melanosome dispersal. To test this idea, we examined the ethanol response of crf and pomc-a morphants. We found that ethanol-stimulated melanosome dispersal was diminished in either pomc-a (Fig. 5E) or crf (Fig. 5F) morphants as compared to controls (Fig. 5D). Quantification of the dispersal index revealed a highly significant effect (Fig. 5G). The two-way ANOVA test showed that the effect of either morpholino is dependent on ethanol treatment (F = 35.30, DFn = 2, DFd = 60, p < 0.0001), with Bonferroni posttest revealing the significant effect of pomc or crf morpholino in ethanol compared to control morpholino in ethanol (p < 0.001). To verify the specificity of these morpholino antisense oligonucleotides, we administered α-MSH to the bath medium, which restored a wild type-like response to ethanol in both pomc-a (Fig. 5H) and crf morphants (Fig. 5I). Injection of the CRF neuropeptide into the ventral forebrain ventricular space also rescued the crf morphants (Fig. 5J). These results demonstrate the specificity of these morpholino antisense oligonucleotides and suggest that α-MSH is the downstream effector of CRF. To explore the genetic interaction between crf and pomc further, we coinjected both pomc and crf morpholino antisense oligonucleotides at suboptimal doses (0.05 mm and 0.025 mm respectively) that individually caused no effect. Coinjection of both morpholino antisense oligonucleotides at these doses significantly attenuated melanosome dispersal in ethanol (Fig. 5K), The two-way ANOVA test showed that the crf plus pomc morpholino effect is dependent on ethanol treatment (F = 12.32, DFn = 1, DFd = 60, p = 0.0009), with Bonferroni posttest revealing the significant effect of morpholinos in ethanol compared to control morpholino in ethanol (p < 0.001). These results suggest that crf and pomc indeed act in a common pathway.
Figure 5.
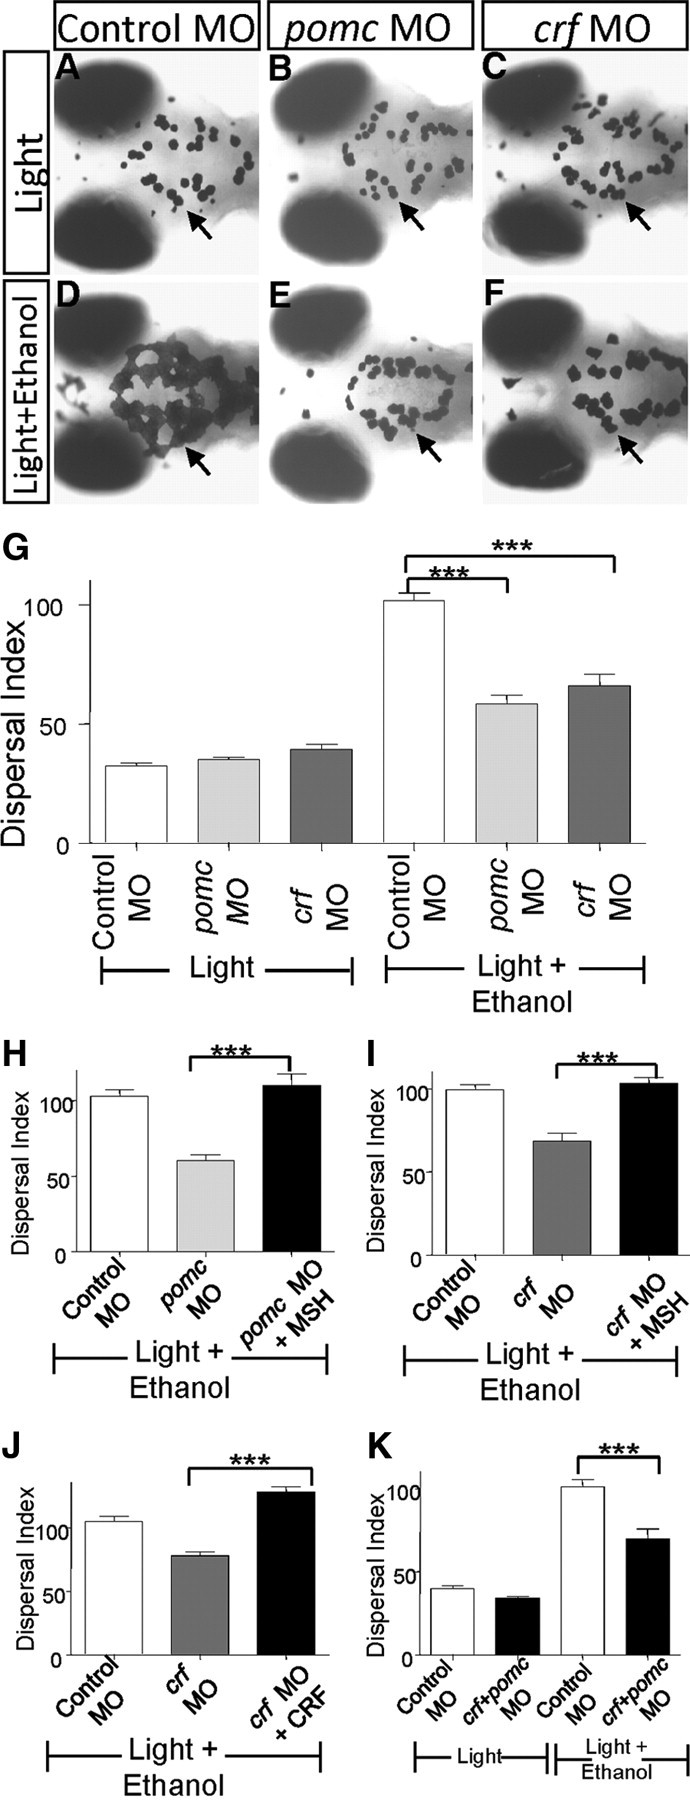
Ethanol requires CRF and POMC to stimulate melanosome dispersal. A–G, Images of 5 dpf zebrafish larvae in light for 20 min (A–C) or upon treatment with 1.5% ethanol in light for 20 min (D–F). The control shows melanosome dispersal upon ethanol treatment (D) compared to no ethanol treatment (A). The pomc (E) or crf morphant (F) shows significant impairment of melanosome dispersal upon ethanol treatment; quantification (G) (***p < 0.001, n = 12, two-way ANOVA). H, I, Rescue of pomc (H) and crf morphant (I) phenotype with α-MSH treatment (***p < 0.001, n = 12, one-way ANOVA). J, Rescue of crf morphant phenotype with CRF peptide injection in the brain (***p < 0.001, n = 12, one-way ANOVA). K, Synergistic effect of pomc and crf morpholinos at suboptimal concentration on ethanol-mediated melanosome dispersal (***p < 0.001, n = 15, two-way ANOVA).
To determine which CRF receptors are involved in mediating ethanol-modulated camouflage behavior, we tested the effect of selective CRF receptor antagonists. Both CRF-R1 and CRF-R2 antagonists attenuated ethanol-stimulated melanosome dispersal (Fig. 6A–E). Together, these analyses indicate that the CRF-POMC pathway is critical to mediate ethanol-stimulated melanosome dispersal, which likely involves both CRF receptor subtypes.
Figure 6.

Blocking CRF receptors attenuates ethanol-mediated melanosome dispersal. A–D, Images of 5 dpf larvae with brain injection of DMSO control (A), CRF receptor-1 antagonist antalarmin (B), CRF receptor-2 antagonist K41498 (C) or both (D) and exposed to ethanol for 20 min. E, Quantification, ***p < 0.001, n = 12, one-way ANOVA.
Altering light exposure or treatment with ethanol induces adaptive changes in CRF neurons at the transcript level
So far, we have established a critical role of CRF in regulating camouflage behavior and mediating the effect of ethanol on this behavior. To further understand the CRF system in relation to background illumination or ethanol exposure, we asked whether altering light exposure or ethanol treatment might induce changes in CRF-expressing neurons. Zebrafish embryos were reared from 3 dpf in either continuous dark or continuous light till 5 dpf. They were subsequently processed for in situ hybridization with a crf-specific antisense probe in an identical manner. The gene expression changes shown in Figure 7, A and B, were representative of each treatment condition, that is, they were observed in >70% animals examined (n = 25 for each condition). We further quantified crf expression by imaging 10 animals per condition and computing the ratio of intensity that is normalized to light-reared controls (i.e., the value of light-reared controls was set as 1; see Materials and Methods for details). Such quantification revealed that in dark-reared animals crf expression was increased in five of six neuronal clusters, with the hypothalamic cluster having the most significant increase (∼8-fold compared to light-reared siblings). On the contrary, crf expression in the telencephalic cluster was reduced by ∼50% in dark-reared animals (Fig. 7A–C).
Figure 7.

Altering light exposure regulates crf expression. A, B, From 3 to 5 dpf zebrafish larvae reared in continuous light (A) or continuous dark (B) show crf expression in telencephalon (Tel; red circle), pretectum (PreT; light blue circle), preoptic (Po; black circle), posterior tuberculum (PT; green circle), hypothalamus (Hy; pink circle), and hindbrain (HB; dark blue circle). Note that the light brown spots on the images are melanocytes containing melanin. C, Quantification of ratio of intensity (normalized to light-reared controls) shows a decrease of expression in the telecephalon, whereas an increase of expression was observed in all other clusters. (***p < 0.001, **p < 0.01, n = 10, Student's t test applied to individual clusters).
We next asked whether ethanol treatment might induce adaptive changes in CRF neurons. Light-reared animals were treated with 1.5% (257 mm) ethanol for 3 h and processed side-by-side together with light-reared control siblings for crf in situ hybridization. crf expression was significantly increased in four of six neuronal clusters. However, differently from dark rearing, ethanol-exposed animals showed a robust increase of crf expression in the telencephalic cluster (∼3-fold compared to light-reared control) (Fig. 8A–C). These results uncover robust plasticity at the level of CRF transcripts, in response to both altered sensory input and treatment with ethanol in an overlapping but nonidentical manner.
Figure 8.

Ethanol treatment causes an increase in crf expression. A, B, Expression of crf in control light-reared and mock-treated larvae (A) and light-reared larvae treated with 1.5% (257 mm) ethanol for 3 h (B). Note that the light brown spots on the images are melanocytes containing melanin. C, Quantification of ratio of intensity normalized to light-reared and mock-treated controls shows an increased expression in the telencephalon (Tel; red), pretectum (light blue), hypothalamus (pink), and hindbrain (dark blue; colors also refer to circles in A, B). ***p < 0.001, *p < 0.05, n = 10, Student's t test applied to individual clusters.
An important role of Fan/AC5 and phospho-ERK in mediating ethanol-induced plasticity of crf expression
We next sought to understand the mechanisms by which the plasticity of crf expression occurs. We asked whether the fantasma or fan mutant, which disrupts the evolutionarily conserved AC5 and exhibits an impaired camouflage behavior in response to ethanol (Peng et al., 2009), impaired ethanol-induced plasticity of crf expression. The fan mutant and their wild-type siblings were light-reared from 3 to 5 dpf, followed by 3 h ethanol treatment and crf in situ hybridization. Quantification of the ratio of intensity (after normalization to respective light-reared controls) revealed that ethanol-induced crf expression in the telencephalon, pretectal area, hypothalamus, and hindbrain was significantly dampened in the fan mutant, with the most profound effect seen in the hypothalamus (∼10-fold reduction) (Fig. 9B,D, white bars).
Figure 9.

Role of AC5 and phospho-ERK on ethanol-induced crf expression. A–C, Expression of crf in light-reared wild-type (WT) siblings treated with 1.5% (257 mm) ethanol for 3 h (A), light-reared fantasma mutant treated with 1.5% (257 mm) ethanol for 3 h (B), and light-reared wild type treated with the 50 μm MEK inhibitor PD98059 and 1.5% (257 mm) ethanol for 3 h (C). Note the light brown spots on the images are melanocytes containing melanin. Melanocytes fail to undergo melanosome dispersal in the fan mutant; therefore, such brown spot-covered areas are less in the fan mutant in B. D, Quantification of ratio of intensity normalized to respective light-reared controls shows that both the fan mutant and PD98059 treatment dampened ethanol-induced crf expression, with the exception of the hypothalamic cluster, which shows an increase in PD98059-treated animals (***p < 0.001, **p < 0.01, n = 10, one-way ANOVA applied to individual clusters to compare with WT ethanol control). Colored circles and abbreviations: Red, Telencephalon (Tel); light blue, pretectum (PreT); pink, hypothalamus (Hy); dark blue, hindbrain (HB).
Since phospho-ERK activity has been detected previously in the larval zebrafish forebrain and is involved in behavioral sensitivity to ethanol (Peng et al., 2009), we determined the consequence of pharmacologically inhibiting ERK phosphorylation on ethanol-induced plasticity of crf expression. Light-reared larvae were subjected to a 3 h ethanol treatment in the presence or absence of PD98059, an inhibitor of the MEK kinase that phosphorylates ERK. Quantification of the ratio of intensity (after normalization to respective light-reared controls) showed that inhibition of phosphorylation of ERK also significantly dampened ethanol-induced crf expression in the telencephalon, pretectal area, and hindbrain but had no effect on the hypothalamic cluster (Fig. 9C,D, black bars). Therefore, we conclude that ethanol-induced plasticity in subsets of CRF neurons requires intact activity of AC5 and phospho-ERK.
Fan/AC5 and phospho-ERK also mediate dark-induced plasticity of crf expression
Both AC5 and phospho-ERK are involved in the camouflage behavior in response to background illumination (Peng et al., 2009). We therefore examined whether AC5 and phospho-ERK play a role in regulating dark-induced plasticity of crf expression. The fan mutant animals and their wild-type siblings were reared in dark from 3 to 5 dpf and subsequently processed for crf in situ hybridization. In the dark-reared fan mutant, crf expression was significantly less compared to their dark-reared, wild-type siblings (Fig. 10A,B). When normalized to respective light-reared controls, it was apparent that the fan mutant had impaired dark-induced crf expression (Fig. 10D, white bars). These results suggest that Fan/AC5 is required for dark-induced crf expression. To determine the role of phospho-ERK, we analyzed dark-reared larvae in the presence or absence of the phospho-ERK inhibitor PD98059. Quantification of the ratio of intensity (after normalization to respective light-reared controls) revealed an overall decrease of crf expression in all clusters except the hindbrain, as compared to dark-reared controls (Fig. 10, compare C,A; for quantification, see Fig. 10D, gray bars). These analyses suggest that both AC5 and phospho-ERK are also critical for dark-induced plasticity of crf expression in subsets of CRF neurons.
Figure 10.

Role of AC5 and phospho-ERK on dark-induced crf expression. Expression of crf in dark-reared wild-type siblings (A), dark-reared fantasma mutant (B), and dark-reared wild type treated with 50 μm ΜΕK inhibitor PD98059 (C). Note that the light brown spots on the images are melanocytes containing melanin. Melanocytes fail to undergo melanosome dispersal in the fan mutant; therefore, there are fewer such brown spot-covered areas in the fan mutant in B. D, Quantification of ratio of intensity normalized to respective light-reared controls shows that both the fan mutation and PD98059 treatment dampen dark-induced crf expression, with the exception of the hindbrain cluster in PD98059 treatment. ***p < 0.001, **p < 0.01, *p < 0.05, n = 10 one-way ANOVA applied to individual clusters to compare with WT dark control. Colored circles and abbreviations: Red, Telencephalon (Tel); light blue, pretectum (PreT); black, preoptic (Po); green, posterior tuberculum (PT); pink, hypothalamus (Hy); dark blue, hindbrain (HB).
Discussion
Larval zebrafish respond to different environmental lighting conditions by dispersing or aggregating melanosomes in melanocytes in a highly quantifiable manner. This camouflage behavior is robustly modulated by ethanol (Lockwood et al., 2004) and amenable to molecular genetic analysis (Peng et al., 2009), thereby representing an attractive system to dissect molecular and cellular mechanisms underlying a simple innate behavior and to understand its sensitivity to a psychoactive and addictive substance.
Here we identify a peptidergic pathway composed of CRF and POMC as critical components of the camouflage response system, acting to promote melanosome dispersal in larval zebrafish (Fig. 11A). While it is well established in mammals that the CRF system has an important role in regulating stress and anxiety-related behaviors (Bale and Vale, 2004; Krohg et al., 2008), which might also be the case in zebrafish, mechanisms underlying the development and assembly of CRF neurons into functional circuitries, however, remain poorly understood. Our results demonstrating the involvement of CRF in regulating a simple innate camouflage behavior in larval zebrafish establish an excellent new model system to address this problem.
Figure 11.

Camouflage response pathway and regulation of crf expression by altering light exposure and ethanol. A, Schematic showing the involvement of CRF-POMC pathway in promoting melanosome dispersal in melanocytes by raising the cAMP levels through action of α-MSH. Light-induced aggregation involves the action of NA and MCH. Ethanol targets the CRF-POMC pathway to promote melanosome dispersal. B, Both dark and ethanol require the cAMP and ERK pathways to induce crf expression.
We further show that the CRF-POMC pathway is required to mediate the sensitivity of camouflage behavior to ethanol (Fig. 11A). Interestingly, CRF and POMC in mammals are shown to play important roles in ethanol intake and alcohol dependence (Heilig and Koob, 2007; Koob, 2008). Despite such advancements, how ethanol impacts CRF neurons at molecular and cellular levels is not well understood. Our systems level analysis of the camouflage behavior reveals that among all circuit components (e.g., visual sensory system, melanocytes) ethanol is able to potentially target given its cellular permeability, the CRF-POMC pathway exhibits particular sensitivity to ethanol. This is unexpected and strongly argues that CRF neurons possess specific molecular or cellular architectures that are targeted by ethanol. The ethanol-sensitive camouflage behavior thus represents a novel and relevant system to further probe this question.
Both CRF receptor subtypes (R1 and R2) are found in zebrafish (Alderman and Bernier, 2009), suggesting that the phylogenetic conservation of this important neuropeptide system extends to its receptors. We show that selective antagonists to either the mammalian CRF-R1 or CRF-R2 are capable of attenuating ethanol and dark-induced melanosome dispersal. Although the selectivity of these antagonists on zebrafish CRF-R1 versus CRF-R2 receptors remains to be demonstrated, given the overall molecular conservation between zebrafish and mammalian genes, particularly in functionally important regions (Alderman and Bernier, 2009), we believe that these antagonists potentially also act selectively in zebrafish. While our results suggest that both receptor subtypes are required to regulate camouflage behavior and its sensitivity to ethanol, whether they act in the same or different cell types and in an additive or synergistic manner remain an interesting topic for future investigations.
Altering light exposure, which changes sensory input to the camouflage circuit, has been shown to change the number of neurons expressing dopamine in larvae of the amphibian Xenopus laevis in a circuit-specific and activity-dependent manner (Dulcis and Spitzer, 2008). Here we show that subsets of CRF neurons exhibit robust plasticity in crf gene expression in response to altering light condition or a 3 h ethanol exposure (Fig. 10B), and such plasticity is dependent on intact cAMP and phospho-ERK signaling. While ethanol-induced crf expression shares similarity with that induced by dark, opposite effects of dark and ethanol on the telencephalic CRF neuronal subtype have also been noted. Such dissociable effects of ethanol and dark on telencephalic crf expression suggest that this CRF neuronal subtype is unlikely to be involved in camouflage behavior but rather is involved in other circuits and behaviors that are independently modulated by dark or ethanol. Additionally, it is worth pointing out that while disruption of AC5 and blockade of ERK phosphorylation generally dampen ethanol-induced or dark-induced plasticity of crf expression, their effects are not identical in some CRF neuronal subtypes, suggesting overlapping as well as independent actions of the cAMP versus the ERK pathways. Finally, in some cases (e.g., the effect of Fan/AC5 on hypothalamic CRF neurons upon ethanol treatment or on hindbrain CRF neurons upon dark rearing) it is apparent that the fan mutant suffered a further decrease of crf expression below that of light-reared controls. This is likely due to an increased protein synthesis and release of CRF upon ethanol treatment or dark rearing, which further depletes crf transcripts that fail to be replenished in the fan mutant. Together, significant heterogeneity has been observed in different CRF neuronal subtypes, making it of great interest to use the larval zebrafish system to further decipher the development and function of individual CRF subtypes in mediating camouflage as well as other complex behaviors that are sensitive to background illumination or ethanol.
Bright light therapy has been successfully used to treat seasonal affective disorder (SAD), a form of depression with recurrent seasonal episodes (Postolache and Oren, 2005; Prasko, 2008). The mechanisms by which the light exerts its effect are not well understood. Our findings link light exposure to regulation of CRF (Fig. 10B), a major player in stress and anxiety, thereby suggesting that downregulation of CRF by light is a potential mechanism through which the bright light therapy treats SAD. We also identify the cAMP and ERK pathways as critical molecular regulators of dark-induced plasticity of crf expression, suggesting that pharmacological manipulation of these signaling pathways could modulate crf expression and in turn affect stress or anxiety states.
How fish change color to readily adapt to their surroundings has amazed the nonscientific community for ages and fascinated physiologists for decades. Our results further reveal its potential for understanding the assembly and function of a light-regulated neural circuit as well as the sensitivity of this circuit to ethanol. Future studies using this system promise to unravel how the camouflage circuit and individual subtypes of CRF neurons develop, operate, and are regulated by light and influenced by ethanol.
Footnotes
This work was supported by the National Institutes of Health Grant AA016021. We thank M. Munchua for excellent fish care, A. Arrenberg in Dr. H. Baier's lab for help with OKR analysis and the lakritz mutant, Dr. W. Vale for the CRF antibody, K. Thorn and the University of California San Francisco Nikon Imaging Center for assistance with imaging, and Dr. E. Hurlock and Dr. B. Lu for a critical reading of the manuscript.
References
- Alderman SL, Bernier NJ. Localization of corticotropin-releasing factor, urotensin I, and CRF-binding protein gene expression in the brain of the zebrafish, Danio rerio. J Comp Neurol. 2007;502:783–793. doi: 10.1002/cne.21332. [DOI] [PubMed] [Google Scholar]
- Alderman SL, Bernier NJ. Ontogeny of the corticotropin-releasing factor system in zebrafish. Gen Comp Endocrinol. 2009;164:61–69. doi: 10.1016/j.ygcen.2009.04.007. [DOI] [PubMed] [Google Scholar]
- Bale TL, Vale WW. CRF and CRF receptors: role in stress responsivity and other behaviors. Annu Rev Pharmacol Toxicol. 2004;44:525–557. doi: 10.1146/annurev.pharmtox.44.101802.121410. [DOI] [PubMed] [Google Scholar]
- Brockerhoff SE, Hurley JB, Janssen-Bienhold U, Neuhauss SC, Driever W, Dowling JE. A behavioral screen for isolating zebrafish mutants with visual system defects. Proc Natl Acad Sci U S A. 1995;92:10545–10549. doi: 10.1073/pnas.92.23.10545. [DOI] [PMC free article] [PubMed] [Google Scholar]
- Chandrasekar G, Lauter G, Hauptmann G. Distribution of corticotropin-releasing hormone in the developing zebrafish brain. J Comp Neurol. 2007;505:337–351. doi: 10.1002/cne.21496. [DOI] [PubMed] [Google Scholar]
- Davies AG, Pierce-Shimomura JT, Kim H, VanHoven MK, Thiele TR, Bonci A, Bargmann CI, McIntire SL. A central role of the BK potassium channel in behavioral responses to ethanol in C. elegans. Cell. 2003;115:655–666. doi: 10.1016/s0092-8674(03)00979-6. [DOI] [PubMed] [Google Scholar]
- Dulcis D, Spitzer NC. Illumination controls differentiation of dopamine neurons regulating behaviour. Nature. 2008;456:195–201. doi: 10.1038/nature07569. [DOI] [PMC free article] [PubMed] [Google Scholar]
- Fujii R. The regulation of motile activity in fish chromatophores. Pigment Cell Res. 2000;13:300–319. doi: 10.1034/j.1600-0749.2000.130502.x. [DOI] [PubMed] [Google Scholar]
- Gonzalez-Nunez V, Gonzalez-Sarmiento R, Rodríguez RE. Identification of two proopiomelanocortin genes in zebrafish (Danio rerio) Brain Res Mol Brain Res. 2003;120:1–8. doi: 10.1016/j.molbrainres.2003.09.012. [DOI] [PubMed] [Google Scholar]
- Guo S, Brush J, Teraoka H, Goddard A, Wilson SW, Mullins MC, Rosenthal A. Development of noradrenergic neurons in the zebrafish hindbrain requires BMP, FGF8, and the homeodomain protein Soulless/Phox2a. Neuron. 1999;24:555–566. doi: 10.1016/s0896-6273(00)81112-5. [DOI] [PubMed] [Google Scholar]
- Guo S, Peng J, Wagle M, Mueller T, Mathur P. Camouflage response in zebrafish: A model for genetic dissection of molecular and cellular circuitries underlying alcoholism. Commun Integr Biol. 2009;2:512–514. [Google Scholar]
- Hansen IA, To TT, Wortmann S, Burmester T, Winkler C, Meyer SR, Neuner C, Fassnacht M, Allolio B. The pro-opiomelanocortin gene of the zebrafish (Danio rerio) Biochem Biophys Res Commun. 2003;30:1121–1128. doi: 10.1016/s0006-291x(03)00475-3. [DOI] [PubMed] [Google Scholar]
- Heilig M, Koob GF. A key role for corticotropin-releasing factor in alcohol dependence. Trends Neurosci. 2007;30:399–406. doi: 10.1016/j.tins.2007.06.006. [DOI] [PMC free article] [PubMed] [Google Scholar]
- Herzog W, Sonntag C, Walderich B, Odenthal J, Maischein HM, Hammerschmidt M. Genetic analysis of adenohypophysis formation in zebrafish. Mol Endocrinol. 2004;18:1185–1195. doi: 10.1210/me.2003-0376. [DOI] [PubMed] [Google Scholar]
- Kay JN, Finger-Baier KC, Roeser T, Staub W, Baier H. Retinal ganglion cell genesis requires lakritz, a zebrafish atonal homolog. Neuron. 2001;30:725–736. doi: 10.1016/s0896-6273(01)00312-9. [DOI] [PubMed] [Google Scholar]
- Kelsh RN, Brand M, Jiang YJ, Heisenberg CP, Lin S, Haffter P, Odenthal J, Mullins MC, van Eeden FJ, Furutani-Seiki M, Granato M, Hammerschmidt M, Kane DA, Warga RM, Beuchle D, Vogelsang L, Nüsslein-Volhard C. Zebrafish pigmentation mutations and the processess of neural crest development. Development. 1996;123:369–389. doi: 10.1242/dev.123.1.369. [DOI] [PubMed] [Google Scholar]
- Kimmel CB, Ballard WW, Kimmel SR, Ullmann B, Schilling TF. Stages of embryonic development of the zebrafish. Dev Dyn. 1995;203:253–310. doi: 10.1002/aja.1002030302. [DOI] [PubMed] [Google Scholar]
- Kolk SM, Kramer BM, Cornelisse LN, Scheenen WJ, Jenks BG, Roubos EW. Multiple control and dynamic response of the Xenopus melanotrope cell. Comp Biochem Physiol B Biochem Mol Biol. 2002;132:257–268. doi: 10.1016/s1096-4959(01)00533-4. [DOI] [PubMed] [Google Scholar]
- Koob GF. Corticotropin-releasing factor, neuroplasticity (sensitization), and alcoholism. Proc Natl Acad Sci U S A. 2008;105:8809–8810. doi: 10.1073/pnas.0804354105. [DOI] [PMC free article] [PubMed] [Google Scholar]
- Krohg K, Hageman I, Jørgensen MB. Corticotropin-releasing factor (CRF) in stress and disease: a review of literature and treatment perspectives with special emphasis on psychiatric disorders. Nord J Psychiatry. 2008;62:8–16. doi: 10.1080/08039480801983588. [DOI] [PubMed] [Google Scholar]
- Lockwood B, Bjerke S, Kobayashi K, Guo S. Acute effects of alcohol on larval zebrafish: a genetic system for large-scale screening. Pharmacol Biochem Behav. 2004;77:647–654. doi: 10.1016/j.pbb.2004.01.003. [DOI] [PubMed] [Google Scholar]
- Logan DW, Burn SF, Jackson IJ. Regulation of pigmentation in zebrafish melanophores. Pigment Cell Res. 2006;19:206–213. doi: 10.1111/j.1600-0749.2006.00307.x. [DOI] [PubMed] [Google Scholar]
- Macosko EZ, Pokala N, Feinberg EH, Chalasani SH, Butcher RA, Clardy J, Bargmann CI. A hub-and-spoke circuit drives pheromone attraction and social behaviour in C. elegans. Nature. 2009;458:1171–1175. doi: 10.1038/nature07886. [DOI] [PMC free article] [PubMed] [Google Scholar]
- McIntire SL The C. elegans Research Community, editor. Ethanol. WormBook. 2010 html 10.1895/wormbook.1.40.1, http://www.wormbook.org. [Google Scholar]
- Moore MS, DeZazzo J, Luk AY, Tully T, Singh CM, Heberlein U. Ethanol intoxication in Drosophila: genetic and pharmacological evidence for regulation by the cAMP signaling pathway. Cell. 1998;93:997–1007. doi: 10.1016/s0092-8674(00)81205-2. [DOI] [PubMed] [Google Scholar]
- Müller MB, Wurst W. Getting closer to affective disorders: the role of CRH receptor systems. Trends Mol Med. 2004;10:409–415. doi: 10.1016/j.molmed.2004.06.007. [DOI] [PubMed] [Google Scholar]
- Nascimento AA, Roland JT, Gelfand VI. Pigment cells: a model for the study of organelle transport. Annu Rev Cell Dev Biol. 2003;19:469–491. doi: 10.1146/annurev.cellbio.19.111401.092937. [DOI] [PubMed] [Google Scholar]
- Neuhauss SC, Biehlmaier O, Seeliger MW, Das T, Kohler K, Harris WA, Baier H. Genetic disorders of vision revealed by a behavioral screen of 400 essential loci in zebrafish. J Neurosci. 1999;19:8603–8615. doi: 10.1523/JNEUROSCI.19-19-08603.1999. [DOI] [PMC free article] [PubMed] [Google Scholar]
- Owens MJ, Nemeroff CB. Physiology and pharmacology of corticotropin-releasing factor. Pharmacol Rev. 1991;43:425–473. [PubMed] [Google Scholar]
- Peng J, Wagle M, Mueller T, Mathur P, Lockwood BL, Bretaud S, Guo S. Ethanol-modulated camouflage response screen in zebrafish uncovers a novel role for cAMP and extracellular signal-regulated kinase signaling in behavioral sensitivity to ethanol. J Neurosci. 2009;29:8408–8418. doi: 10.1523/JNEUROSCI.0714-09.2009. [DOI] [PMC free article] [PubMed] [Google Scholar]
- Postolache TT, Oren DA. Circadian phase shifting, alerting, and antidepressant effects of bright light treatment. Clin Sports Med. 2005;24:381–413. doi: 10.1016/j.csm.2004.12.005. [DOI] [PubMed] [Google Scholar]
- Prasko J. Bright light therapy. Neuro Endocrinol Lett. 2008;29:33–64. [PubMed] [Google Scholar]
- Roeser T, Baier H. Visuomotor behaviors in larval zebrafish after GFP-guided laser ablation of the optic tectum. J Neurosci. 2003;23:3726–3734. doi: 10.1523/JNEUROSCI.23-09-03726.2003. [DOI] [PMC free article] [PubMed] [Google Scholar]
- Sawchenko PE, Swanson LW, Vale WW. Co-expression of corticotropin-releasing factor and vasopressin immunoreactivity in parvocellular neurosecretory neurons of the adrenalectomized rat. Proc Natl Acad Sci U S A. 1984;81:1883–1887. doi: 10.1073/pnas.81.6.1883. [DOI] [PMC free article] [PubMed] [Google Scholar]
- Scholz H. Intoxicated fly brains: neurons mediating ethanol-induced behaviors. J Neurogenet. 2009;23:111–119. doi: 10.1080/01677060802471676. [DOI] [PubMed] [Google Scholar]
- Sheets L, Ransom DG, Mellgren EM, Johnson SL, Schnapp BJ. Zebrafish melanophilin facilitates melanosome dispersion by regulating dynein. Curr Biol. 2007;17:1721–1734. doi: 10.1016/j.cub.2007.09.028. [DOI] [PMC free article] [PubMed] [Google Scholar]
- Stockinger P, Kvitsiani D, Rotkopf S, Tirián L, Dickson BJ. Neural circuitry that governs Drosophila male courtship behavior. Cell. 2005;121:795–807. doi: 10.1016/j.cell.2005.04.026. [DOI] [PubMed] [Google Scholar]
- Vale W, Spiess J, Rivier C, Rivier J. Characterization of a 41-residue ovine hypothalamic peptide that stimulates secretion of corticotropin and beta-endorphin. Science. 1981;213:1394–1397. doi: 10.1126/science.6267699. [DOI] [PubMed] [Google Scholar]
- Verburg-Van Kemenade BM, Jenks BG, Cruijsen PM, Dings A, Tonon MC, Vaudry H. Regulation of MSH release from the neurointermediate lobe of Xenopus laevis by CRF-like peptides. Peptides. 1987;8:1093–1100. doi: 10.1016/0196-9781(87)90142-2. [DOI] [PubMed] [Google Scholar]
- Westerfield M. Ed 3. Eugene, OR: University of Oregon; 1995. The zebrafish book: a guide for the laboratory use of zebrafish (Brachydanio rerio) [Google Scholar]
- Wolf FW, Heberlein U. Invertebrate models of drug abuse. J Neurobiol. 2003;54:161–178. doi: 10.1002/neu.10166. [DOI] [PubMed] [Google Scholar]
- Yoshimura M, Tabakoff B. Selective effects of ethanol on the generation of cAMP by particular members of the adenylyl cyclase family. Alcohol Clin Exp Res. 1995;19:1435–1440. doi: 10.1111/j.1530-0277.1995.tb01004.x. [DOI] [PubMed] [Google Scholar]