Abstract
Bacterial lipopolysaccharide (LPS) has long been suggested as a potent inducer of bone loss in vivo despite controversial effects on osteoclast precursors. Recently, the role of the deubiquitinating protease A20 in regulating the LPS response in various organs was reported. In the present study, we investigated whether A20 is expressed in osteoclast cultures in response to RANKL or LPS and whether this protein plays a role in osteoclast formation and activation. Human peripheral blood mononuclear cells were cultured in the presence of M-CSF ± RANKL ± LPS. Although LPS induced the formation of multinucleated TRAP-positive cells expressing OSCAR, cathepsin K, and the calcitonin receptor, these cells were not capable of lacunar resorption. Release of TNF-α was noted in LPS-treated cultures, and the addition of a neutralizing anti-TNF-α antibody abrogated osteoclast formation in these cultures. A20 appeared to be a late-expressed gene in LPS-treated cultures and was associated with TRAF6 degradation and NF-κB inhibition. Silencing of A20 restored TRAF6 expression and NF-κB activation and resulted in increased bone resorption in LPS-treated cultures. A20 appeared important in the control of bone resorption and could represent a therapeutic target to treat patients with bone resorption associated with inflammatory diseases.
Keywords: Bone, Deubiquitination, Lipopolysaccharide (LPS), NF-κB, TRAF, A20, Osteoclast, Resorption
Introduction
Osteoclasts are multinucleated cells that originate from the hematopoietic cell lineage (CFU-GM) and are capable of lacunar bone resorption (1, 2). Osteoclast differentiation requires the presence of macrophage-colony-stimulating factor (M-CSF)2 and the receptor activator for NF-κB ligand RANKL (3–5). Osteoprotegerin acts as a decoy receptor for RANKL and blocks RANKL-mediated osteoclast differentiation and stimulation of osteoclast-resorbing activity (6, 7). RANKL is a member of the tumor necrosis factor (TNF) superfamily that is expressed on osteoblasts, stromal cells, and T cells and which interacts with its receptor, RANK, expressed on osteoclast precursors (8, 9). One of the crucial steps, in the downstream signaling pathway of RANK/RANKL interaction is the recruitment of TNF receptor-associated factors (TRAFs) to the intracellular tail of RANK (10, 11). Among the different TRAFs binding RANK, TRAF6 is considered essential for osteoclast function because TRAF6 knock-out animals exhibit severe osteopetrosis (12, 13). TRAF6 initiates the activation of TGF-β-activated kinase 1, which further activates the different downstream signaling pathways leading to the activation of NF-κB and members of the MAPK family, including ERK, JNK, and p38 (14, 15).
Although RANKL is a crucial factor for osteoclastogenesis, other mediators have been reported to be capable of this process independently of RANKL (16–18). Bacterial lipopolysaccharide (LPS), a constituent of Gram-negative bacteria, has long been suggested as a potent inducer of bone loss in vivo (19–21). LPS interacts with its receptor Toll-like receptor-4 (TLR4), which contains a specific Toll-IL-1 receptor domain, critical for the recruitment of MyD88 (22). MyD88 can therefore recruit one or more IL-1R-associated kinases that bind TRAF6 and further activates NF-κB and members of the MAPK family (for review, see Ref. 23). TRAF6 is also critical for LPS downstream signaling because TRAF6 knock-out animals are less responsive to LPS (12). Even though TRAF6 appears critical for RANK and TLR4 signaling pathways, the role of LPS on osteoclast formation and activation appears to be more complex than RANKL. LPS has been shown to enhance osteoclast formation and activation of RANKL-primed osteoclast precursors and promote the survival of osteoclasts in vitro (24). However, LPS is also capable of inhibiting RANKL-induced osteoclastogenesis when added at early stages of osteoclast differentiation (24). In the last decade, it has been suggested that the LPS response is regulated by an NF-κB-inducible gene, A20 (25), which acts as an inhibitor of NF-κB activation (for review, see Ref. 26). A20 belongs to the superfamily of deubiquitinating proteases (27, 28) that is capable of associating with TRAF6 (29) and deubiquitinates its Lys63-linked polyubiquitin chains to terminate cell activation (30). A20 possesses also a Lys48-polyubiquitin activity leading to the proteasome-mediated degradation of targeted proteins (31). Here, we hypothesized that A20 expression is up-regulated in response of LPS (but not RANKL) and that it promotes TRAF6 inactivation leading to the observed phenotype.
The aim of the present study was to investigate the direct role of LPS on the differentiation and maturation of early stage human osteoclast precursors. Our findings suggested that LPS promoted the formation of “osteoclast-like” cells expressing specific osteoclast markers (OSCAR, cathepsin K, calcitonin receptor) through a TNF-α-dependent mechanism but not their activation. Interestingly, LPS, but not soluble RANKL (sRANKL), induced the expression of A20 resulting in the degradation of TRAF6 and deactivation of the NF-κB pathway.
EXPERIMENTAL PROCEDURES
Reagents and Chemicals
Recombinant human M-CSF, recombinant human TNF-α, and neutralizing anti-human TNF-α antibodies were purchased from R&D Systems Europe (Abingdon, UK). Recombinant soluble human RANKL was purchased from PeproTech (London, UK). Recombinant cytokines were aliquoted and stored at −80 °C on the day of purchase. LPS from Escherichia coli 055:B5 was purchased from Sigma-Aldrich. All other chemicals were purchased from Sigma-Aldrich when otherwise stated.
Isolation of Human Peripheral Blood Mononuclear Cells (PBMCs)
PBMCs were isolated from five normal healthy volunteers as described previously (32). Blood was diluted 1:1 in α-minimal essential medium (MEM) (Invitrogen), layered over Histopaque, and centrifuged (693 × g) for 20 min. The interface layer was resuspended in MEM and then centrifuged (600 × g) for a further 10 min after which the resultant cells were resuspended in medium supplemented with 10% heat-inactivated fetal calf serum (FCS; Invitrogen) and counted in a hemocytometer following lysis of red blood cells using a 5% (v/v) acetic acid solution.
Assessment of Osteoclast Formation and Activation
To assess the extent of osteoclast formation and activation, isolated human PBMCs from whole blood were cultured on glass coverslips and dentine slices as described previously (32). Briefly, 5 × 10⁵ PBMCs were added to 4-mm-diameter dentine slices and 6-mm-diameter glass coverslips in MEM containing 100 units/ml penicillin, 100 μg/ml streptomycin, and 10% FCS (osteoclast medium). After a 2-h incubation, cultures were vigorously rinsed in medium to remove nonadherent cells, and then maintained in 1 ml of MEM/FCS with 25 ng/ml recombinant human M-CSF ± 100 ng/ml recombinant human sRANKL (added on day 7) ± 100 ng/ml LPS (added on day 7 or 10) and ± 5 ng/ml TNF-α (added on day 7 or 10). Cultures were stopped after 14 days to assess the extent of osteoclast formation or 21 days to assess the extent of osteoclast resorption. These concentrations of LPS and TNF-α have been based on preliminary experiments.3 All factors were replenished every 2–3 days.
Characterization of Newly Formed Osteoclasts on Glass Coverslips and Dentine Slices
After 14 days in culture, the expression of TRAP (one of the known osteoclastic markers) (33) on the adherent cells on the coverslips was examined histochemically, as described previously (34). Coverslips were removed from the culture wells and rinsed promptly in PBS buffer, fixed with formalin (10% in PBS buffer) for 10 min, and rinsed in distilled water. TRAP was histochemically revealed by a simultaneous coupling reaction using Naphthol AS-BI-phosphate as substrate and Fast Violet B as the diazonium salt. The coverslips were then incubated for 90 min at 37 °C in the dark and rinsed three times in distilled water, and the residual activity was inhibited by 4% NaF for 30 min. Coverslips were then rinsed in distilled water, counterstained with DAPI for 20 min, and allowed to dry before mounting using an aqueous medium. TRAP-positive cells, with more than three nuclei, were identified as osteoclasts. After 21 days in culture, the dentine slices were removed from the culture wells, placed in 1 n NH4OH for 30 min, and sonicated for 5 min to remove any adherent cells. After rinsing in distilled water, the dentine slices were stained with 0.5% (v/v) toluidine blue (pH 5.0) prior to examination by light microscopy. The surface of each dentine slice was examined for the presence of lacunar resorption and the extent of surface erosion, and the sizes of resorption pits on dentine slices were determined using image analysis as described previously (32).
ELISA
The conditioned medium of 2 × 10⁶ PBMCs cultured with or without 100 ng/ml LPS was collected at day 8 after the addition of LPS in the cultures. This time point was chosen to determine whether LPS is capable of inducing the release of any known osteoclastogenic markers (such as IL-1β or TNF-α) directly from PBMCs already stimulated by M-CSF. The conditioned medium was centrifuged at 800 × g for 30 min, aliquoted, and frozen at −80 °C prior to determining the levels of IL-1β and TNF-α (Human Quantikine kits; R&D Systems Europe) according to the manufacturer's protocol. The minimum detectable doses for IL-1β and TNF-α were 1 and 1.6 pg/ml, respectively.
Immunoprecipitation
Cells were washed in cold PBS, and lysates were made by using a lysis buffer containing 50 mm Tris-HCl (pH 7.5), 100 mm NaCl, 50 mm NaF, 3 mm Na3VO4, protease inhibitor mixture (Sigma-Aldrich), and 1% Nonidet P-40. Cell lysates were centrifuged at 13,000 rpm for 30 min at 4 °C, the supernatant was collected, and protein concentration was determined using a BCA protein kit assay (Pierce). In a microcentrifuge tube, 1 ml of protein fraction was incubated with 10 μg of anti-TRAF6 (Santa Cruz Biotechnology) overnight at 4 °C. Protein G slurry was added for 2 h with gentle mixing at room temperature, and samples were spun at 3,000 rpm for 3 min. Supernatants were discarded, and the pellets were resuspended for 5 min in elution buffer containing 100 mm glycine (pH 2.5). Samples were centrifuged at 3,000 rpm for 3 min, and supernatants were collected and neutralized with 1 m Tris-HCl buffer. Protein samples were submitted to immunoblotting as described below.
Western Blot Analysis/Immunoblotting
PBMCs were cultured with 25 ng/ml M-CSF and in the presence or absence of 100 ng/ml sRANKL, 100 ng/ml LPS, or 5 ng/ml TNF-α for the indicated period of time. Cells were washed in cold PBS and homogenized in lysis buffer as described above. Samples were spun at 13,000 rpm for 30 min at 4 °C, the supernatant was collected, and protein concentration was determined by BCA assay. Samples (20 μg/lane) were run on a 10% acrylamide gel and blotted onto a PVDF membrane. The membranes were washed in Tris-buffered saline (TBS) and blocked with 5% BSA. Samples were incubated overnight with one of the following specific antibodies for A20, TRAF6, IκB, phospho-IκB (Ser32/Ser36) (Cell Signaling, Danvers, MA), cathepsin K, OSCAR, calcitonin receptor (Santa Cruz Biotechnology), Lys48-specific-linked ubiquitin, Lys63-specific-linked ubiquitin (Millipore Corp.), and β-actin (Sigma-Aldrich). Subsequently, the membranes were washed in TBS and incubated with the appropriate secondary antibodies coupled to HRP. Immunoreactive bands were visualized using an ECL kit (Amersham Biosciences). The degree to which the different markers were induced was determined by normalizing the specific signal to that of β-actin using ImageJ software (National Institutes of Health).
Silencing
SiGENOME SMARTpool siRNAs (containing a mixture of four siRNAs) targeting human A20 sequences GGGAAGAUUUGAAGACUUA, GCACCAUGUUUGAAGGAUA, GCGGAAAGCUGUGAAGAUA, and CAGCAUGAGUACAAGAAAU; and nonspecific control siRNA duplexes were purchased from Thermo Fisher Scientific. PBMCs at a concentration of 6 × 10⁶ cells/ml were plated in 6-well plates coated with collagen type I as described above and cultured in the presence of 25 ng/ml M-CSF. After 6 days of cultures, PBMCs were washed twice in Opti-MEM (Invitrogen) and preincubated with a mixture of 100 nm siRNA, Lipofectamine 2000 (Invitrogen), and Opti-MEM. Cells were exposed to this transfection mixture for 16 h before being returned to osteoclast medium. Forty-eight hours after transfection, 100 ng/ml LPS was added in the cultures. Knockdown efficiency was assessed by Western blotting. For resorption assay, newly formed osteoclasts were detached using collagenase and seeded on the top of dentine slices for 24 h prior to evaluation of area resorption as described above.
Statistical Analysis
All experiments were repeated at least three times, and the results were expressed as means ± S.E. of the mean. A nonparametric Mann-Whitney test was used to compare the differences between the groups using the SPSS statistical software release 14.0. (SPSS Inc., Chicago, IL). Differences at p < 0.05 were considered significant.
RESULTS
LPS Is Capable of Inducing the Formation of Osteoclasts
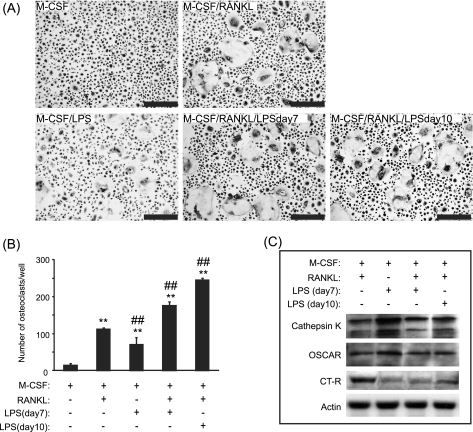
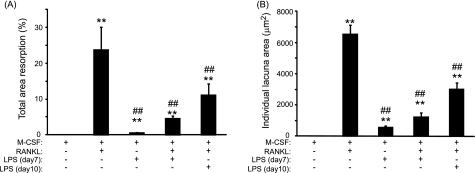
After 14 days in culture, TRAP staining indicated the presence of multinucleated osteoclast-like cells in cultures (Fig. 1A). The number of osteoclasts generated in the presence of LPS was significantly increased, by 5-fold, compared with M-CSF alone (71 ± 23 versus 14 ± 6; p < 0.001) (Fig. 1B). Compared with sRANKL treatment, this number of osteoclast-like cells was however significantly decreased by 1.6-fold (71 ± 23 versus 112 ± 5, p < 0.001). In cultures treated with sRANKL and LPS (both added day 7), the number of newly formed osteoclast-like cells was dramatically increased by 1.6-fold (112 ± 5 versus 176 ± 13, p < 0.001) compared with cultures treated with sRANKL alone. As physiologically, LPS also targets preosteoclasts, PBMCs were also primed with sRANKL for 3 days prior to LPS stimulation. The number of osteoclast cells generated in the presence of sRANKL (added day 7) and LPS (added day 10) was significantly increased by 2.2-fold (112 ± 5 versus 245 ± 6, p < 0.001) compared with sRANKL alone. To ascertain the true nature of the cells formed in response to LPS, the expression of the osteoclastic markers cathepsin K, OSCAR, and calcitonin receptor were determined by Western blotting. After treatment with sRANKL (as a positive control), LPS, or sRANKL/LPS, the expression of all these osteoclast markers was detected (Fig. 1C), confirming that these multinucleated TRAP cells were osteoclasts. Compared with M-CSF-treated cultures, few resorption lacunae were evidenced at the surface of dentine slices treated with LPS (Fig. 2A). Significant reductions of 5.2-fold and 2.1-fold in the percentage total area resorption were observed in the sRANKL/LPS (day7)- and sRANKL/LPS (day10)-treated cultures compared with sRANKL alone (Fig. 2A). This reduction in the percentage total area resorption was also mirrored by a decrease in the mean area of individual lacunar pits (6,520 ± 593 μm2 versus 1,239 ± 227 μm2, p < 0.001 and 6520 ± 593 μm2 versus 2,992 ± 497 μm2, p < 0.001) in sRANKL-treated cultures compared with sRANKL/LPS (day7)- and sRANKL/LPS (day10)-treated cultures, respectively (Fig. 2B).
FIGURE 1.
LPS induced “osteoclast-like” cells formation. A and B, examples (A) and number (B) of multinucleated TRAP-positive cells formed in M-CSF-, M-CSF/sRANKL-, M-CSF/LPS-, and M-CSF/sRANKL/LPS-treated cultures after 14 days of culture. sRANKL was added at day 7, and LPS was added either at day 7 or day 10. C, expression of cathepsin K, OSCAR, and the calcitonin receptor (CT-R) in response to osteoclastogenic mediators. **, p < 0.01 compared with M-CSF alone; ##, p < 0.01 compared with M-CSF/sRANKL-treated cultures. Error bars = S.E.
FIGURE 2.
LPS-induced bone resorption is lower than sRANKL-induced bone resorption. Total area resorption (A) and individual lacuna area (B) in M-CSF-, M-CSF/LPS-, M-CSF/sRANKL-, M-CSF/sRANKL/LPS (day7)-, and M-CSF/sRANKL/LPS (day10)-treated cultures. **, p < 0.01 compared with M-CSF alone; ##, p < 0.01 compared with M-CSF/sRANKL-treated cultures. Error bars = S.E.
TNF-α but not IL-1β Is Expressed in LPS-treated Cultures
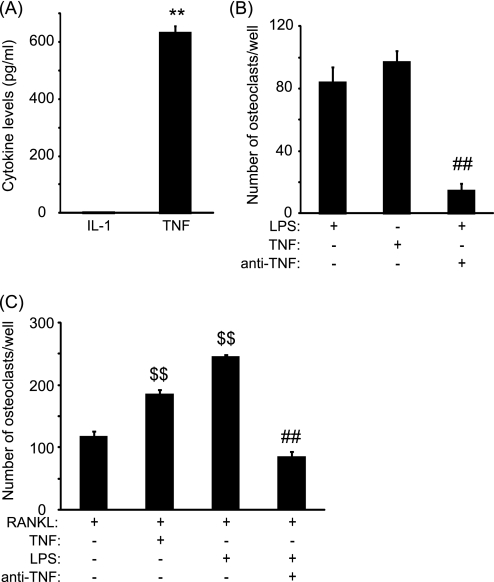
To assess whether the formation of osteoclast in response to LPS was due to a direct effect of pro-osteoclastic mediators, we measured the levels of IL-1β and TNF-α in the conditioned media of LPS-treated cultures at day 8. Although IL-1β was undetectable in untreated and LPS-treated cultures, levels of TNF-α were significantly increased in the supernatant of LPS-treated cultures compared with untreated cultures, where no TNF-α was detected (Fig. 3A). As such we performed osteoclast cultures in the presence of TNF-α. The number of newly formed osteoclasts in TNF-α-treated cultures was similar to those obtained in LPS-treated cultures (Fig. 3B). Furthermore, the addition of a neutralizing anti-TNF antibody in LPS-treated cultures significantly reduced osteoclast formation (Fig. 3B), indicating that LPS induced osteoclast formation through a TNF-α-dependent mechanism. To verify whether TNF-α is also capable of increasing the number of newly generated osteoclast in preosteoclast cultures, PBMCs were first primed with sRANKL for 3 days prior to the addition of TNF-α (Fig. 3C). TNF-α significantly augmented by 1.6-fold the extent of osteoclast formation compared with sRANKL alone in preosteoclast cultures (p < 0.001). On the other hand, the addition of neutralizing anti-TNF antibodies in preosteoclast cultures treated with LPS dramatically reduced the number of newly generated osteoclasts (85 ± 12 versus 245 ± 6, p < 0.001).
FIGURE 3.
LPS-induced osteoclast formation is dependent on TNF-α. A, levels of IL-1β and TNF-α released in the cell culture supernatant at day 8 in untreated (open area) and LPS-treated (filled bar) cultures. B and C, number of osteoclast-like cells generated in response to LPS, TNF-α, and LPS/anti-TNF-α in untreated (B) and sRANKL-primed cultures (C). **, p < 0.01 compared with untreated cells; ##, p < 0.01 compared with LPS-treated cultures; $$, p < 0.01 compared with cells pretreated with sRANKL. Error bars = S.E.
A20 Is Up-regulated and TRAF6 Down-regulated in LPS-treated Cultures
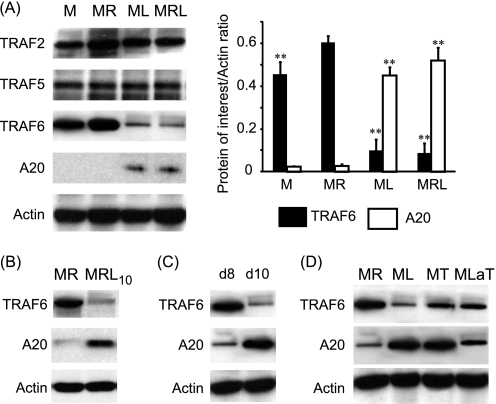
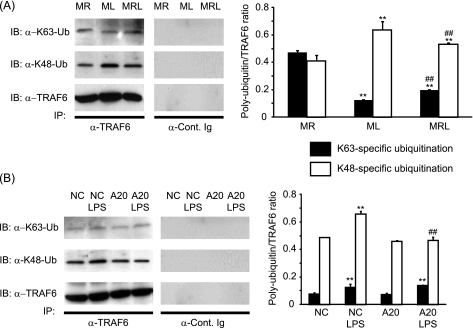
To identify the molecular targets affected by LPS, the expression of TRAFs in response to M-CSF, sRANKL, and/or LPS was investigated. Compared with M-CSF alone, the presence of RANKL significantly increased the expression of TRAF6 by 1.3-fold (Fig. 4A). Compared with sRANKL-treated cultures, we found that at day 10, TRAF6 but not TRAF2 or TRAF5 was significantly degraded in response to LPS (Fig. 4A). Furthermore, because A20 is known to be activated in response to LPS and is thought to regulate TRAF6 degradation, the expression of the former was assessed in these cultures. Compared with sRANKL-treated cultures, A20 was significantly expressed at day 10 only in LPS-treated cultures (Fig. 4A). The expression of TRAF6 and A20 was evaluated in cells pretreated for 3 days with sRANKL prior to the addition of LPS in the culture. Here again, the presence of LPS reduced the expression of TRAF6 and increased A20 levels after 2 days of stimulation with LPS (Fig. 4B). To determine whether A20 and TRAF6 levels were affected early after LPS treatment, we investigated their presence at days 8 and day 10, which, respectively, corresponded to 1 day and 3 days after the addition of LPS in the culture (Fig. 4C). Interestingly, at day 10 but not day 8, A20 and TRAF6 expression was inversely regulated in LPS-treated cultures (Fig. 4C). Thus, A20 expression and TRAF6 degradation were also observed in the presence of TNF-α or a neutralizing anti-TNF antibody in LPS-treated cultures although at a lower extent (Fig. 4D). Furthermore, the polyubiquitination profiles of TRAF6 indicated that compared with RANKL, LPS induced a significant decrease in Lys63- and increase in Lys48-specific ubiquitin chains (Fig. 5A). A similar pattern of polyubiquitination is encountered when RANKL and LPS are added together. The polyubiquitination profile of TRAF6 was also investigated after A20 silencing (Fig. 5B). Compared with nontargeting siRNA, the same pattern of polyubiquitination (Lys63- and Lys48-specific) was observed in A20-silenced cultures in the absence of LPS. On the other hand, the addition of LPS to nontargeted cultures resulted in increased Lys63- and Lys48-specific polyubiquitination. However, in A20-silenced cultures although LPS stimulation resulted in a significant increase in Lys63-specific polyubiquitination, it lacked the ability to increase Lys48-specific polyubiquitination (Fig. 5B).
FIGURE 4.
LPS-induced A20 expression and TRAF6 degradation. A, expressions of TRAF2, TRAF5, TRAF6, and A20 were investigated at day 10 in M-CSF (M)-, M-CSF/sRANKL (MR)-, M-CSF/LPS (ML)-, and M-CSF/sRANKL/LPS (MRL)-treated cultures. B and C, expression of TRAF6 and A20 was either evaluated at day 12 in cells pretreated with sRANKL for 3 days prior to addition of LPS (MRL10) (B) and in M-CSF/LPS cultures at day 8 (d8) and day 10 (d10) (C). D, expression of TRAF6 and A20 was investigated at day 10 in M-CSF/sRANKL-, M-CSF/LPS-, M-CSF/TNF-α (MT)- and M-CSF/LPS-anti-TNF-α (MLaT)-treated cultures. **, p < 0.01 compared with MR-treated cells. Error bars = S.E.
FIGURE 5.
Polyubiquitination profiles of TRAF6. The levels of Lys63- and Lys48-specific polyubiquitination (Ub) were investigated at day 10 by Western blotting (IB) after immunoprecipitation (IP) of TRAF6. A, polyubiquitination profiles in M-CSF/sRANKL (MR), M-CSF/LPS added at day 7 (ML) and M-CSF/sRANKL/LPS added at day 7 (MRL). **, p < 0.01 compared with MR; ##, p < 0.01 compared with ML. B, polyubiquitination profiles of PBMCs transfected with either nontargeting (NC) or A20 siRNAs ± LPS. Results were expressed as a specific ubiquitination:total TRAF6 ratio. **, p < 0.01 compared with untreated cells; ##, p < 0.01 compared with nontargeting siRNA. Error bars = S.E.
A20 Decreases NF-κB Activation in LPS-treated Cultures
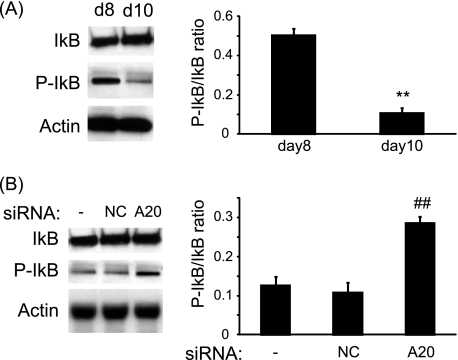
Because A20 has been described as an inhibitor of the NF-κB pathway, we investigated the phosphorylation of IκB at day 8 and day 10. Compared with day 8, IκB phosphorylation was significantly reduced at day 10 after a 30-min treatment with LPS (Fig. 6A). On the other hand, at day 10, compared with LPS-treated cultures, silencing of A20 resulted in an increase of IκB phosphorylation after a 30-min treatment with LPS (Fig. 6B).
FIGURE 6.
LPS treatment of osteoclast cultures resulted in the inhibition of the NF-κB pathway. A, PBMCs were cultured in the presence of LPS, and the phosphorylation of IκB was assessed by Western blotting at day 8 (d8) and day 10 (d10), 30 min after the culture medium was replenished with fresh culture medium. B, PBMCs were transfected with nontargeting siRNAs (NC) or siRNAs targeting A20 (A20) and cultured in the presence of M-CSF/LPS. The extent of IκB phosphorylation was assessed at day 10, 30 min after the medium was replenished. **, p < 0.01 compared with day 8; ##, p < 0.01 compared with nontransfected cells. Error bars = S.E.
A20 Is Directly Responsible for Reduction in TRAF6 and Osteoclast Resorption in LPS-treated Cultures
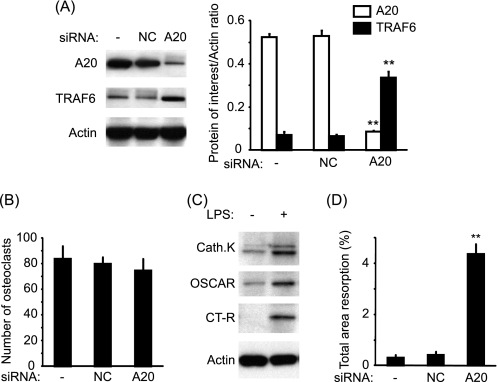
We also assessed whether A20 was directly responsible for TRAF6 degradation and the lack of bone resorption observed in LPS (day7)-treated cultures. Interestingly, at day 10 in LPS (day7)-treated cultures, A20 silencing resulted in TRAF6 restoration (Fig. 7A) but did not affect the number of newly formed osteoclasts (Fig. 7B). Furthermore, in the absence of A20, LPS was capable of increasing the expression of osteoclast differentiation and maturation markers such as cathepsin K, OSCAR, and calcitonin receptor (Fig. 7C). The extent of osteoclast resorption was significantly enhanced in LPS-treated cultures only when A20 was silenced (Fig. 7D). However, the extent of lacunar resorption in A20-silenced and LPS-treated cultures was significantly lower than in sRANKL-treated cultures.
FIGURE 7.
Targeting A20 resulted in restoration of TRAF6 and increased bone resorption in M-CSF/LPS-treated cultures. A, PBMCs were transfected with either nontargeting siRNAs (NC) or siRNAs targeting A20 and cultured in the presence of M-CSF and LPS. The expression of A20 and TRAF6 was assessed by Western blotting at day 10. B, the number of osteoclasts was assessed by counting the number of TRAP-positive cells at day 14. C, expressions of cathepsin K (Cath.K), OSCAR, and calcitonin receptor (CT-R) at day 14 were assessed in the absence of A20 with or without LPS stimulation. D, extent of lacunar resorption was assessed after 21 days. **, p < 0.01 compared with nontransfected cells. Error bars = S.E.
DISCUSSION
Osteoclasts are multinucleated cells responsible for bone resorption. They derived from the fusion of hematopoietic precursor cells that circulate in the blood (35–37). Although injection of lipopolysaccharide in animals results in severe bone resorption, the current mechanism leading to osteoclast formation and activation is not well understood. In the present study, we reported that although LPS was capable of inducing the formation of multinucleated TRAP-positive osteoclasts through a TNF-α-mediated mechanism, these cells do not possess the ability to initiate bone resorption. This was mediated by the expression of A20 and the subsequent degradation of TRAF6 and inhibition of the NF-κB pathway.
TRAF6 is an essential adaptor molecule involved in the downstream signaling cascade of RANKL/RANK, CD40L/CD40, IL-1/IL-1R, and LPS/TLR4 interactions (11, 38–40). Lomaga et al. reported that although TRAF6-deficient mice exhibit a severe osteopetrosis, the number of multinucleated TRAP-positive cells, in these animals, is normal (12). These results seem to indicate that although TRAF6 seems important for osteoclast activation, other compensatory pathways, independent of TRAF6, can lead to osteoclast formation. We and others have shown that TNF-α is capable of inducing osteoclast formation (18, 41, 42). However, TNF-α-generated osteoclasts lack the ability of resorbing calcified substrate unless cultured with IL-1 (18, 41). A common component of downstream signaling utilized by both RANK and IL-1 receptor is TRAF6. Taken together, these data suggest that TRAF6 is essential for osteoclast function but not crucial for osteoclast formation. Our results are also in agreement with these observations because LPS significantly induced osteoclast formation, but not activation, through a TNF-α mechanism while TRAF6 was degraded. However, in our model, TRAF6 degradation happened between day 8 and day 10, and it is plausible that an initial TRAF6 activation is required to allow osteoclast formation. Several authors reported that TRAF6 is directly responsible of NF-κB activation in the RANK and TLR4 intracellular signaling pathway (10, 43). Our results seem also to support these observations as in LPS-treated cultures; Lys48-specific polyubiquitination of TRAF6 resulted in its degradation and was also associated with NF-κB inhibition.
Although A20 was originally described as an inhibitor of TNF-α-induced apoptosis, it has been most studied as an inhibitor of NF-κB activation (for review, see Ref. 26). A20 is a cytoplasmic protein that is expressed predominantly in lymphoid tissues. Its N-terminal domain is a deubiquitinating enzyme for Lys63-linked polyubiquitinated signaling mediators, whereas its C-terminal domain is a ubiquitin ligase (E3) for Lys48-linked degradative polyubiquitination of the same substrate (28). In the present study, we showed that A20 was expressed at day 10 (but not day 8) in LPS- or TNF-α-treated cultures whereas this protein was absent in sRANKL-treated cultures, suggesting selective expression pathway. Recently, it has been shown that A20 forms a complex with TRAF6, leading to the deubiquitination of its Lys63-linked polyubiquitin chains and inhibition of NF-κB activation (29). Moreover, Lin et al. showed that in vitro A20 might induce directly TRAF6 Lys48-linked polyubiquitination, leading to its proteasomal degradation. Our results are also in agreement with these observations as levels of A20 were inversely correlated with levels of TRAF6, and Lys48-specific polyubiquitination was decreased by silencing A20. Furthermore, silencing of A20 resulted in the restoration of TRAF6 expression and NF-κB activation. Another important event of A20 silencing was the capacity of LPS-generated osteoclasts to induce lacunar resorption. These results suggest that in the absence of A20, LPS is capable of activating osteoclasts and pose the problem of the biological role of A20 in bone disorders. A recent report by Lee et al. suggests that A20-deficient mice exhibit severe destructive arthritis with colonization of the bone marrow by inflammatory cells (44). Compared with wild-type animals, A20-deficient mice are more susceptible to effects of LPS and TNF-α and die rapidly after injection of these factors, suggesting that there is no anti-inflammatory/anti-bone resorption mechanism in these animals. According to our knowledge, our study is the first report of a direct anti-resorptive role of A20. However, different human genome-wide association studies have shown that multiple polymorphisms in the A20 region are independently associated with rheumatoid arthritis and systemic lupus erythematosis (45–47), two conditions characterized by increased bone resorption.
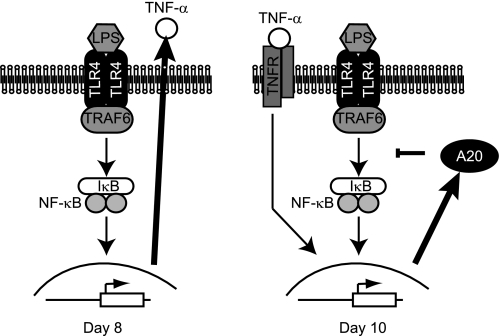
Our results suggest that LPS mediated the inhibition of osteoclast activation at early stages of osteoclast precursors through the following mechanism (Fig. 8): First, stimulation of osteoclast precursors with LPS resulted in the early release of TNF-α. TNF-α stimulated osteoclast formation as demonstrated by the inhibition of this process by a neutralizing anti-TNF-α antibody. Furthermore, later on, continuous stimulation with LPS resulted in A20 expression, TRAF6 degradation, and NF-κB deactivation, hampering newly formed osteoclasts to acquire lacunar resorption properties.
FIGURE 8.
Model of osteoclast formation and bone resorption in the presence of LPS. Early stimulation (Day 8) with LPS induced TNF-α release. However, at day 10, A20 expression was evidenced and resulted in TRAF6 degradation and NF-κB inhibition that contributed to abort osteoclast resorption.
In summary, LPS is capable of promoting osteoclast differentiation but not osteoclast activation through a TNF-α-dependent mechanism. Prolonged stimulation with LPS resulted in the expression of A20, degradation of TRAF6, and inhibition of NF-κB leading to the lack of osteoclast resorption.
This work was supported by the National Institute for Health and Research, Oxford University Musculoskeletal Biomedical Research Unit.
G. Mabilleau, D. Chappard, and A. Sabokbar, unpublished data.
- M-CSF
- macrophage-colony-stimulating factor
- PBMC
- peripheral blood mononuclear cell
- RANKL
- receptor activator of nuclear factor κB ligand
- sRANKL
- soluble RANKL
- TLR
- Toll-like receptor
- TRAF
- TNF receptor-associated factor.
REFERENCES
- 1. Boyle W. J., Simonet W. S., Lacey D. L. (2003) Nature 423, 337–342 [DOI] [PubMed] [Google Scholar]
- 2. Udagawa N., Takahashi N., Akatsu T., Tanaka H., Sasaki T., Nishihara T., Koga T., Martin T. J., Suda T. (1990) Proc. Natl. Acad. Sci. U.S.A. 87, 7260–7264 [DOI] [PMC free article] [PubMed] [Google Scholar]
- 3. Fujikawa Y., Quinn J. M., Sabokbar A., McGee J. O., Athanasou N. A. (1996) Endocrinology 137, 4058–4060 [DOI] [PubMed] [Google Scholar]
- 4. Lacey D. L., Timms E., Tan H. L., Kelley M. J., Dunstan C. R., Burgess T., Elliott R., Colombero A., Elliott G., Scully S., Hsu H., Sullivan J., Hawkins N., Davy E., Capparelli C., Eli A., Qian Y. X., Kaufman S., Sarosi I., Shalhoub V., Senaldi G., Guo J., Delaney J., Boyle W. J. (1998) Cell 93, 165–176 [DOI] [PubMed] [Google Scholar]
- 5. Quinn J. M., Elliott J., Gillespie M. T., Martin T. J. (1998) Endocrinology 139, 4424–4427 [DOI] [PubMed] [Google Scholar]
- 6. Simonet W. S., Lacey D. L., Dunstan C. R., Kelley M., Chang M. S., Lüthy R., Nguyen H. Q., Wooden S., Bennett L., Boone T., Shimamoto G., DeRose M., Elliott R., Colombero A., Tan H. L., Trail G., Sullivan J., Davy E., Bucay N., Renshaw-Gegg L., Hughes T. M., Hill D., Pattison W., Campbell P., Sander S., Van G., Tarpley J., Derby P., Lee R., Boyle W. J. (1997) Cell 89, 309–319 [DOI] [PubMed] [Google Scholar]
- 7. Yasuda H., Shima N., Nakagawa N., Mochizuki S. I., Yano K., Fujise N., Sato Y., Goto M., Yamaguchi K., Kuriyama M., Kanno T., Murakami A., Tsuda E., Morinaga T., Higashio K. (1998) Endocrinology 139, 1329–1337 [DOI] [PubMed] [Google Scholar]
- 8. Hsu H., Lacey D. L., Dunstan C. R., Solovyev I., Colombero A., Timms E., Tan H. L., Elliott G., Kelley M. J., Sarosi I., Wang L., Xia X. Z., Elliott R., Chiu L., Black T., Scully S., Capparelli C., Morony S., Shimamoto G., Bass M. B., Boyle W. J. (1999) Proc. Natl. Acad. Sci. U.S.A. 96, 3540–3545 [DOI] [PMC free article] [PubMed] [Google Scholar]
- 9. Nakagawa N., Kinosaki M., Yamaguchi K., Shima N., Yasuda H., Yano K., Morinaga T., Higashio K. (1998) Biochem. Biophys. Res. Commun. 253, 395–400 [DOI] [PubMed] [Google Scholar]
- 10. Darnay B. G., Haridas V., Ni J., Moore P. A., Aggarwal B. B. (1998) J. Biol. Chem. 273, 20551–20555 [DOI] [PubMed] [Google Scholar]
- 11. Darnay B. G., Ni J., Moore P. A., Aggarwal B. B. (1999) J. Biol. Chem. 274, 7724–7731 [DOI] [PubMed] [Google Scholar]
- 12. Lomaga M. A., Yeh W. C., Sarosi I., Duncan G. S., Furlonger C., Ho A., Morony S., Capparelli C., Van G., Kaufman S., van der Heiden A., Itie A., Wakeham A., Khoo W., Sasaki T., Cao Z., Penninger J. M., Paige C. J., Lacey D. L., Dunstan C. R., Boyle W. J., Goeddel D. V., Mak T. W. (1999) Genes Dev. 13, 1015–1024 [DOI] [PMC free article] [PubMed] [Google Scholar]
- 13. Naito A., Azuma S., Tanaka S., Miyazaki T., Takaki S., Takatsu K., Nakao K., Nakamura K., Katsuki M., Yamamoto T., Inoue J. (1999) Genes Cells 4, 353–362 [DOI] [PubMed] [Google Scholar]
- 14. Deng L., Wang C., Spencer E., Yang L., Braun A., You J., Slaughter C., Pickart C., Chen Z. J. (2000) Cell 103, 351–361 [DOI] [PubMed] [Google Scholar]
- 15. Wang C., Deng L., Hong M., Akkaraju G. R., Inoue J., Chen Z. J. (2001) Nature 412, 346–351 [DOI] [PubMed] [Google Scholar]
- 16. Bendre M. S., Montague D. C., Peery T., Akel N. S., Gaddy D., Suva L. J. (2003) Bone 33, 28–37 [DOI] [PubMed] [Google Scholar]
- 17. Edwards J. R., Sun S. G., Locklin R., Shipman C. M., Adamopoulos I. E., Athanasou N. A., Sabokbar A. (2006) Arthritis Rheum. 54, 1451–1462 [DOI] [PubMed] [Google Scholar]
- 18. Kobayashi K., Takahashi N., Jimi E., Udagawa N., Takami M., Kotake S., Nakagawa N., Kinosaki M., Yamaguchi K., Shima N., Yasuda H., Morinaga T., Higashio K., Martin T. J., Suda T. (2000) J. Exp. Med. 191, 275–286 [DOI] [PMC free article] [PubMed] [Google Scholar]
- 19. Abu-Amer Y., Ross F. P., Edwards J., Teitelbaum S. L. (1997) J. Clin. Invest. 100, 1557–1565 [DOI] [PMC free article] [PubMed] [Google Scholar]
- 20. Nair S. P., Meghji S., Wilson M., Reddi K., White P., Henderson B. (1996) Infect. Immun. 64, 2371–2380 [DOI] [PMC free article] [PubMed] [Google Scholar]
- 21. Sakuma Y., Tanaka K., Suda M., Komatsu Y., Yasoda A., Miura M., Ozasa A., Narumiya S., Sugimoto Y., Ichikawa A., Ushikubi F., Nakao K. (2000) Infect. Immun. 68, 6819–6825 [DOI] [PMC free article] [PubMed] [Google Scholar]
- 22. Medzhitov R., Preston-Hurlburt P., Kopp E., Stadlen A., Chen C., Ghosh S., Janeway C. A., Jr. (1998) Mol. Cell 2, 253–258 [DOI] [PubMed] [Google Scholar]
- 23. Lu Y. C., Yeh W. C., Ohashi P. S. (2008) Cytokine 42, 145–151 [DOI] [PubMed] [Google Scholar]
- 24. Zou W., Bar-Shavit Z. (2002) J. Bone Miner. Res. 17, 1211–1218 [DOI] [PubMed] [Google Scholar]
- 25. O'Reilly S. M., Moynagh P. N. (2003) Biochem. Biophys. Res. Commun. 303, 586–593 [DOI] [PubMed] [Google Scholar]
- 26. Coornaert B., Carpentier I., Beyaert R. (2009) J. Biol. Chem. 284, 8217–8221 [DOI] [PMC free article] [PubMed] [Google Scholar]
- 27. Komander D., Barford D. (2008) Biochem. J. 409, 77–85 [DOI] [PubMed] [Google Scholar]
- 28. Lin S. C., Chung J. Y., Lamothe B., Rajashankar K., Lu M., Lo Y. C., Lam A. Y., Darnay B. G., Wu H. (2008) J. Mol. Biol. 376, 526–540 [DOI] [PMC free article] [PubMed] [Google Scholar]
- 29. Iha H., Peloponese J. M., Verstrepen L., Zapart G., Ikeda F., Smith C. D., Starost M. F., Yedavalli V., Heyninck K., Dikic I., Beyaert R., Jeang K. T. (2008) EMBO J. 27, 629–641 [DOI] [PMC free article] [PubMed] [Google Scholar]
- 30. Boone D. L., Turer E. E., Lee E. G., Ahmad R. C., Wheeler M. T., Tsui C., Hurley P., Chien M., Chai S., Hitotsumatsu O., McNally E., Pickart C., Ma A. (2004) Nat. Immunol. 5, 1052–1060 [DOI] [PubMed] [Google Scholar]
- 31. Wertz I. E., O'Rourke K. M., Zhou H., Eby M., Aravind L., Seshagiri S., Wu P., Wiesmann C., Baker R., Boone D. L., Ma A., Koonin E. V., Dixit V. M. (2004) Nature 430, 694–699 [DOI] [PubMed] [Google Scholar]
- 32. Mabilleau G., Sabokbar A. (2009) PLoS ONE 4, e4173. [DOI] [PMC free article] [PubMed] [Google Scholar]
- 33. Minkin C. (1982) Calcif. Tissue Int. 34, 285–290 [DOI] [PubMed] [Google Scholar]
- 34. Mabilleau G., Petrova N. L., Edmonds M. E., Sabokbar A. (2008) Diabetologia 51, 1035–1040 [DOI] [PMC free article] [PubMed] [Google Scholar]
- 35. Husheem M., Nyman J. K., Vääräniemi J., Vaananen H. K., Hentunen T. A. (2005) Calcif. Tissue Int. 76, 222–230 [DOI] [PubMed] [Google Scholar]
- 36. Massey H. M., Flanagan A. M. (1999) Br. J. Haematol. 106, 167–170 [DOI] [PubMed] [Google Scholar]
- 37. Shalhoub V., Elliott G., Chiu L., Manoukian R., Kelley M., Hawkins N., Davy E., Shimamoto G., Beck J., Kaufman S. A., Van G., Scully S., Qi M., Grisanti M., Dunstan C., Boyle W. J., Lacey D. L. (2000) Br. J. Haematol. 111, 501–512 [DOI] [PubMed] [Google Scholar]
- 38. Cao Z., Xiong J., Takeuchi M., Kurama T., Goeddel D. V. (1996) Nature 383, 443–446 [DOI] [PubMed] [Google Scholar]
- 39. Ishida T., Mizushima S., Azuma S., Kobayashi N., Tojo T., Suzuki K., Aizawa S., Watanabe T., Mosialos G., Kieff E., Yamamoto T., Inoue J. (1996) J. Biol. Chem. 271, 28745–28748 [DOI] [PubMed] [Google Scholar]
- 40. Muzio M., Natoli G., Saccani S., Levrero M., Mantovani A. (1998) J. Exp. Med. 187, 2097–2101 [DOI] [PMC free article] [PubMed] [Google Scholar]
- 41. Azuma Y., Kaji K., Katogi R., Takeshita S., Kudo A. (2000) J. Biol. Chem. 275, 4858–4864 [DOI] [PubMed] [Google Scholar]
- 42. Kudo O., Fujikawa Y., Itonaga I., Sabokbar A., Torisu T., Athanasou N. A. (2002) J. Pathol. 198, 220–227 [DOI] [PubMed] [Google Scholar]
- 43. Abbott D. W., Yang Y., Hutti J. E., Madhavarapu S., Kelliher M. A., Cantley L. C. (2007) Mol. Cell. Biol. 27, 6012–6025 [DOI] [PMC free article] [PubMed] [Google Scholar]
- 44. Lee E. G., Boone D. L., Chai S., Libby S. L., Chien M., Lodolce J. P., Ma A. (2000) Science 289, 2350–2354 [DOI] [PMC free article] [PubMed] [Google Scholar]
- 45. Musone S. L., Taylor K. E., Lu T. T., Nititham J., Ferreira R. C., Ortmann W., Shifrin N., Petri M. A., Kamboh M. I., Manzi S., Seldin M. F., Gregersen P. K., Behrens T. W., Ma A., Kwok P. Y., Criswell L. A. (2008) Nat. Genet. 40, 1062–1064 [DOI] [PMC free article] [PubMed] [Google Scholar]
- 46. Plenge R. M., Cotsapas C., Davies L., Price A. L., de Bakker P. I., Maller J., Pe'er I., Burtt N. P., Blumenstiel B., DeFelice M., Parkin M., Barry R., Winslow W., Healy C., Graham R. R., Neale B. M., Izmailova E., Roubenoff R., Parker A. N., Glass R., Karlson E. W., Maher N., Hafler D. A., Lee D. M., Seldin M. F., Remmers E. F., Lee A. T., Padyukov L., Alfredsson L., Coblyn J., Weinblatt M. E., Gabriel S. B., Purcell S., Klareskog L., Gregersen P. K., Shadick N. A., Daly M. J., Altshuler D. (2007) Nat. Genet. 39, 1477–1482 [DOI] [PMC free article] [PubMed] [Google Scholar]
- 47. Thomson W., Barton A., Ke X., Eyre S., Hinks A., Bowes J., Donn R., Symmons D., Hider S., Bruce I. N., Wilson A. G., Marinou I., Morgan A., Emery P., Carter A., Steer S., Hocking L., Reid D. M., Wordsworth P., Harrison P., Strachan D., Worthington J. (2007) Nat. Genet. 39, 1431–1433 [DOI] [PMC free article] [PubMed] [Google Scholar]


