Abstract
An expanding appreciation for the varied functions of neutral lipids in cellular organisms relies on a more detailed understanding of the mechanisms of lipid production and packaging into cytosolic lipid droplets (LDs). Conventional lipid profiling procedures involve the analysis of tissue extracts and consequently lack cellular or subcellular resolution. Here, we report an approach that combines the visualization of individual LDs, microphase extraction of lipid components from droplets, and the direct identification of lipid composition by nanospray mass spectrometry, even to the level of a single LD. The triacylglycerol (TAG) composition of LDs from several plant sources (mature cotton (Gossypium hirsutum) embryos, roots of cotton seedlings, and Arabidopsis thaliana seeds and leaves) were examined by direct organelle mass spectrometry and revealed the heterogeneity of LDs derived from different plant tissue sources. The analysis of individual LDs makes possible organellar resolution of molecular compositions and will facilitate new studies of LD biogenesis and functions, especially in combination with analysis of morphological and metabolic mutants. Furthermore, direct organelle mass spectrometry could be applied to the molecular analysis of other subcellular compartments and macromolecules.
Keywords: Cell Compartmentation, Glycerolipid, Mass Spectrometry (MS), Plant, Triacylglycerol
Introduction
LDs4 are organelles that are specialized for the storage of neutral lipids and as such provide energy-rich reserves in all cellular organisms (1). Understanding LD ontogeny is of major importance to human physiology; on the one hand, seed oils, packaged in LDs, make up a growing proportion of daily caloric intake in most diets around the world, and on the other hand, the regulation of lipid storage and mobilization underlies significant human health issues: obesity, diabetes and cardiovascular disease.
Although storage is considered the principal role of neutral lipids, LDs in nonfat storing tissues recently have become more appreciated for their dynamic nature and functional roles independent of storage. These roles include acyl reserves for phospholipid recycling (2), lipid signaling (3), membrane trafficking (2, 4), inflammation and cancer (5), and host-pathogen interactions (6, 7). These various functions attributed to LDs vary with cell type and likely are manifested by differences in droplet composition. The basic structural model of LDs in plant seeds provides a thermodynamically stable organization that is thought to be conserved throughout eukaryotes, although the nature of the lipids and proteins associated with droplets varies with cell/tissue type. The structure describes a neutral lipid core (triacylglycerols in plant seeds and/or steryl esters in other organisms or cell types) surrounded by a phospholipid monolayer with specific proteins associated with the LD surface (8). Although the endoplasmic reticulum is considered by most to be the major cellular location for LD biogenesis, droplets associate frequently with other subcellular compartments, presumably to carry out unique functions (9).
The recent emphasis on studying the formation and turnover of these organelles and the importance of this compartment to general cellular physiology has prompted the development of advanced analytical tools for these organelles. Visualization of cytosolic LDs has commonly been carried out by conventional light microscopy and confirmed by histochemical and/or fluorescent neutral lipid specific stains (e.g. Sudan III, Nile Red, and BODIPY derivatives (10–12)). Electron microscopy, such as transmission electron microscopy or freeze-fracture and low temperature scanning electron microscopy, have supported the description of the fine ultrastructure of LDs within various plant and mammalian tissues yielding information on structural variability among an assortment of mutants and under a range of environmental conditions (13–16). More recently, third-harmonic generation microscopy (17) and high resolution, nonresonant confocal Raman microscopy (18) have been developed to selectively image unstained LDs unveiling novel interactions in complex cellular environments. In combination with two-photon and second-harmonic generation microscopy, third-harmonic generation microscopy offers three-dimensional spatial resolution that can be used to visualize LDs for long periods. Raman-based microcopy can even provide some molecular composition information for LDs within single cells.
The rapidly developing field of lipidomics has led to a renewed effort to analyze triacylglycerol (TAG) prevalence and composition within LDs by mass spectrometric approaches (2). Many studies have now detailed the complex fragmentation patterns for the complete structural elucidation and quantification of TAGs (19–21). Supported by advances in bioinformatics (LIPID MAPS) (22), improvements in mass spectrometry, and availability of unique purified standards, it is now feasible to achieve comprehensive lipid identification and quantification directly from complex mixtures. For lipidomics applications, lipids most often are extracted from tissues or cell lines in organic solvents, losing the spatial information of lipid organization within the original sample. Others have combined mass spectrometry with microscopy approaches such as MALDI-MS (23), secondary ion MS (SIMS) (24), and desorption electrospray ionization (DESI)-MS (25) to preserve spatial context with composition information, but the resolution currently remains at the cellular/tissue level, and the compositional analysis is limited and incomplete.
Here, we have developed a novel technique for direct organelle mass spectrometry (DOMS) that couples direct visualization with detailed mass spectrometric analysis of organelles. A multifaceted nanomanipulator, previously demonstrated to extract peptides from a single bead (26) and extract and analyze trace fiber analytes (27), was equipped with glass nanospray emitters prefilled with organic solvent capable of extracting the lipid contents out of LDs. Here, this approach is illustrated with LDs from diverse plant sources (Gossypium hirsutum and Arabidopsis thaliana). We demonstrate the capability to directly sample populations of purified LDs as well as perform single-organelle mass spectrometry and lipid characterization. To illustrate the utility of this approach, we show a compositional shift in TAG profiles in LDs purified from modified oleic cottonseed lines previously generated in our laboratory (dominant-negative expression of Bnfad2 (28, 29)), the presence of cyclic fatty acids in TAGs of cotton root LDs, and the molecular comparison between Arabidopsis seed and leaf LDs. These new approaches complement existing analytical and cell biology techniques and can be extended to the analysis of LDs and organelles from other organisms. This approach will help facilitate new studies about LD heterogeneity and the molecular nature of subcellular compartments in cellular systems.
EXPERIMENTAL PROCEDURES
Plant Growth Conditions
Cottonseeds were propagated under air-conditioned greenhouse conditions at 30 °C and supplemented with sodium vapor lamps to extend day length to 16 h. Opened bolls were harvested, and seeds were delinted in a table top, 10-saw laboratory gin. Seeds were from cultivar Coker 312 (nontransgenic) or were from transgenic lines (T5 generation) in the Coker 312 background, expressing a nonfunctional allele of the Brassica napus Δ12-desaturase (Bnfad2) under the control of a seed-specific promoter (28, 29). These seeds displayed reduced oil, elevated oleic acid phenotype relative to Coker 312 seeds (28, 29). Intact embryos (mostly cotyledon tissues) were harvested from desiccated seeds following seed coat removal. Roots were collected on ice from germinated cottonseeds (cv. Coker 312) grown in the dark at 30 °C for 48–72 h. Arabidopsis wild type (Col 0) seeds were obtained from the Arabidopsis stock center at Ohio State University and propagated in house. Plants were grown in soil at 21 °C in a 16-h light/8-h dark cycle (between 45 and 65 μmol/m2/s).
Imaging Lipid Droplets in Situ
LDs were imaged by confocal scanning fluorescence microscopy using BODIPY 493/503 to selectively visualize LDs in situ. All tissues were fixed in 4% w/v paraformaldehyde in 50 mm PIPES, pH 7.0, and stained with 1–10 μg/ml BODIPY 493/503. For BODIPY imaging, excitation of BODIPY was at 493 nm. Emission wavelength for BODIPY-stained LDs was 520 nm, exposed for 0.4–10 s with no gain. In leaves, chloroplast autofluorescence was acquired with an excitation of 493 nm and an emission wavelength at 692 nm exposed for 0.4 s. Images were acquired with a Zeiss 200 m optical microscope fitted with a CSU-10 Yokogawa confocal scanner (McBain Instruments) and captured with a digital camera (Hamamatsu, Phoenix, AZ). LD morphology and localization were characterized using the McMaster Biophotonics Facility and NIH ImageJ software (version 1.43T).
Lipid Droplet Purification
LDs from unfixed embryos of mature cottonseeds were isolated and purified in 100 mm Tris-HCl, 600 mm sucrose, 10 mm KCl, 1 mm EDTA, essentially as described by Chapman and Trelease (30) and based on methods developed by Huang (31). Embryos were chopped into ∼1-mm pieces with a razor blade in ice-cold buffer and purified through a sequential series of three floatations through 500 mm sucrose at 10,000 × g (Sorvall SS-34 rotor or HB-6 rotor in a Sorvall RC 5C centrifuge or in a Centronix Microcentrifuge 1236V for smaller sample sizes). LDs were purified in a similar manner from cotton roots (at least 500 mg fresh weight) of 48–72-h-old seedlings, Arabidopsis leaves of 40-day-old plants (∼8 g of fresh weight), or Arabidopsis seeds (10 mg). LDs from Arabidopsis leaves are few in number, and a final ultracentrifugation step (TLA-100 rotor at 100,000 × g for 1 h, with a Beckman TL100 ultracentrifuge) helped to enrich these organelles in the top layer. For some experiments, 50 mm PIPES-NaOH, pH 7.0, buffer was employed for homogenization and floatation. For all purifications, the fat pads were carefully collected with a spatula, and the LDs were suspended in buffer on ice. LDs were stained with 0.1–1 μg/ml of BODIPY 493/503 in 50 mm PIPES buffer.
Nanomanipulator Work Station
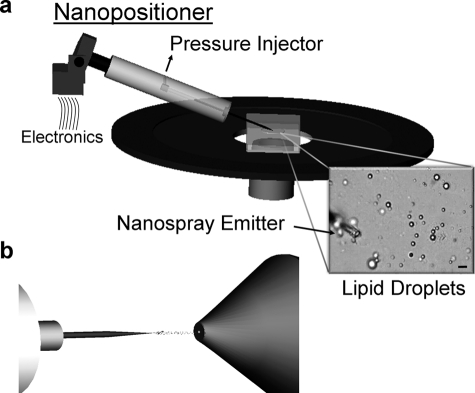
The Biometric L200 nanomanipulator work station developed by Zyvex (Richardson, TX) and the Verbeck group combines four nanopositioners with a piezo voltage source and a PM 2000B programmable four-channel pressure injector (Microdata Instruments, South Plainfield, NJ) situated on an inverted microscope stage (TE2000U, Nikon, Melville, NY, diagrammed in Fig. 1). The nanomanipulator has two modes of motion along the x, y, and z axes. The fine mode has 100 microns of travel in the x and z axis and 10 microns of travel in the y axis with 3.4 nm resolution controlled by piezoelectric crystals. The coarse mode has 12 mm of travel in the x axis and z axis and 28 mm of travel in the y axis with 100-nm resolution. The positioners consist of end effectors made up of six isolated, low impedance electrical connections and two glass capillary attachments. The end effectors are used for manipulation and, if needed, low impedance electrical characterization. Probes and capillaries attached to the positioners can be manually landed onto the sample and manipulated electronically using a joystick to control the position of the end effector. The capillaries are connected by Teflon tubing to a PM 2000B programmable four-channel pressure injector. LDs were visualized by epifluorescence, bright field, or differential scanning interference optics during collection (Nikon NIS elements), and the lipids were microextracted in 10 mm ammonium acetate in chloroform:methanol (1:1, v/v) in the capillary before MS. For single-lipid droplet analysis, the extraction solution was spiked with a Tri 15:0 TAG standard at a final concentration of 2 μm.
FIGURE 1.
Schematic of direct organelle mass spectrometry. A schematic representation of DOMS using the L200 nanomanipulator coupled to nanospray mass spectrometry. a, the nanopositioner, set on an inverted microscope stage, electronically controls the x, y, and z positioning of a nanospray emitter through a user-operated joystick. The nanospray emitter is prefilled with a microextraction solvent and is directly connected to a pressure injector. Approaching purified LDs in buffer, the emitters can selectively load LDs of interest, microextract their lipid contents, and analyze their compositions by nanospray mass spectrometry (b). Scale bar represents 2 μm.
Nanospray Mass Spectrometry
A Proxeon nanospray source (Proxeon Biosystems, Odense, Denmark) was mounted on a Thermo LCQ Deca XP Plus quadrupole ion trap (Thermo Fisher Scientific). The lipids in the nanospray emitters (New Objective (Woburn, MA) Econo12 PicoTipTM Emitter platinum-coated or PROT12 break-to-open platinum emitters (tip opening diameters were 1 ± 0.2 μm and 1–10 μm, respectively) were subjected to typical ion source conditions consisting of a potential of 0.8 to 1.5 kV, capillary temperature of 200 °C, and capillary voltage of 3.0 V. Mass spectra were acquired using the LCQ Tune software program in the positive ion mode with three microscans and a continuous acquisition time. The mass spectra were analyzed with the XCalibur software package (version 2.0). Tandem mass spectrometry (MS/MS) analyses were used to confirm the identity of the triacylglycerols by a characteristic diacylglycerol fragment. Tandem spectra were acquired in positive ion mode with a typical isolation width of 3.0 m/z, normalized collision energy of 35%, activation Q of 0.250, and an activation time of 30 ms. Quantitative estimates of molecular compositions were calculated in Microsoft Excel with in house algorithms integrating peak areas, correcting for isotopic overlap, and when available normalizing to internal standards.
Conventional Lipid Extraction
Total lipids were extracted from LDs purified from mature embryos of desiccated seeds (cv. Coker 312, without and with a Brassica FAD2 nonfunctional allele) using the method of Bligh and Dyer (32). Total lipid extracts were dissolved in 10 mm ammonium acetate in chloroform:methanol (1:1, v/v) and characterized by nanospray mass spectrometry or converted to fatty acid methyl esters and analyzed by gas chromatography equipped with a flame ionization detector (30).
Fatty Acid Methyl Ester Preparation and Analysis
Additional total lipid extracts of the purified LD fractions were converted into fatty acid methyl esters. Fatty acid methyl esters were prepared by transesterification with 1 n methanolic HCL at 85 °C for 2 h. A heptadecanoic acid (C17:0) standard was added to aid quantification. Fatty acid methyl esters were separated on a 30 m × 0.25 mm inner diameter Supelcowax 10 fused silica capillary column on a HP 5890 Series II Plus gas chromatograph with an initial oven temperature of 200 °C increasing at a rate of 1.3 °C/min to a final temperature of 230 °C.
Electrospray Mass Spectrometry
Because the ion trap is limited in its ability to carry out precursor-product scans, additional acyl chain information was derived from analysis of total lipid extracts of LD fractions purified from cotton (seed, root) and Arabidopsis tissues (seed, leaf) using a Waters Micromass Quattro Ultima triple quadrupole mass spectrometer (Waters, Milford, MA). Typical scanning conditions for a direct infusion rate of 10–20 μl/min were carried out in positive ion mode with a 3–3.5 kV spray voltage, 40 V cone voltage, and a scan range of 750 to 1000 m/z. The desolvation and source temperatures were maintained at 200 and 80 °C, respectively, and the desolvation and cone gas flows were set at 300 and 80 liters/hr, respectively. Tandem scans (MS/MS), whether detecting the precursor ions that lost a particular acyl chain in neutral loss mode or single precursor-product species, were performed with collision energy of 30 V with a scan range from 400 to 1000 m/z.
RESULTS
Direct Organelle Mass Spectrometry
Interfacing direct organelle sampling with nanospray mass spectrometry required the incorporation of nanospray emitters that could control the liquid flux at the tip opening in contact with the sample of interest while also sufficiently concentrating the extracted lipids to detect their composition with high resolution. The development of a nanomanipulator apparatus (Fig. 1) (26) coordinated the positioning of up to four emitters in a three-dimensional plane situated on the stage of an inverted light microscope for maximum working distance. Emitters, prefilled with an organic microextraction solution that served the dual purpose of extracting the lipids from the droplets and facilitating the formation of nanospray droplets, were positioned adjacent to purified LDs (Fig. 1a). Direct interfacing the emitter with a dynamic pressure injector provided the sensitivity necessary to fill nanoliter volumes (usually between 5–30 psi of fill pressure) and selectively capture individual organelles (supplemental Movie 1). After sampling LDs, the emitters were remounted onto the nanospray apparatus (Fig. 1b) for chemical analysis.
Lipid Droplet Characterization
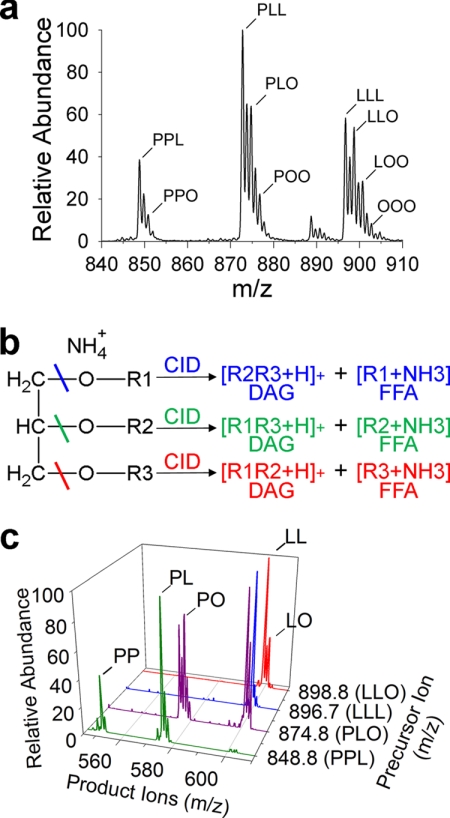
To test the DOMS approach, LDs were purified from mature cotton embryos (cv. Coker 312) due to their abundance within seed tissues, relative ease of purification and the known composition of TAGs in standard cottonseed oil (33). These LDs, suspended in ∼100 μl, were somewhat variable in size (∼0.5–2.0 μm diameter) (Fig. 1a) but retained similar spherical morphology to that observed in situ. A random sampling of approximately two dozen LDs produced a high resolution spectrum of TAGs (Fig. 2a). The TAG molecular species under these conditions were of sufficient concentration to analyze by MS/MS and confirm/assign acyl composition (Fig. 2, b and c). Tandem MS of TAG precursor ions produce diacylglycerol product ions that lead to a high confidence of acyl chain identification (34). The TAG acyl chain distribution in purified cottonseed LDs primarily consisted of linoleic (18:2), oleic (18:1), and palmitic acids (16:0).
FIGURE 2.
TAG profiles of purified cottonseed lipid droplets analyzed by DOMS. a, representative positive ion, high resolution TAG profile of purified LDs from mature cotton embryos (cv. Coker 312). Dominant TAG species are identified as ammonium adducts [M + NH4]+ with peaks labeled according to the three fatty acids present in each TAG molecular species as identified through subsequent tandem MS analysis by collision induced dissociation (CID). b, schematic of tandem MS of a TAG with acyl chains R1, R2, R3. Fragmentation of the R1 ester bond (blue line) produces a corresponding DAG plus hydrogen adduct (blue, R2 and R3) and free fatty acid (FFA) plus ammonia (blue, R1). c, confirmation of acyl chain composition by tandem MS detects the diagnostic DAG product ions minus a free fatty acid compared with known masses (34). DAGs represented in multiple TAGs shown are only labeled once for clarity. sn-positioning of each acyl chain was not determined. P, 16:0-palmitic acid; O, 18:1-oleic acid; L, 18:2-linoleic acid.
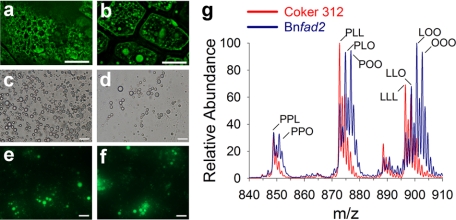
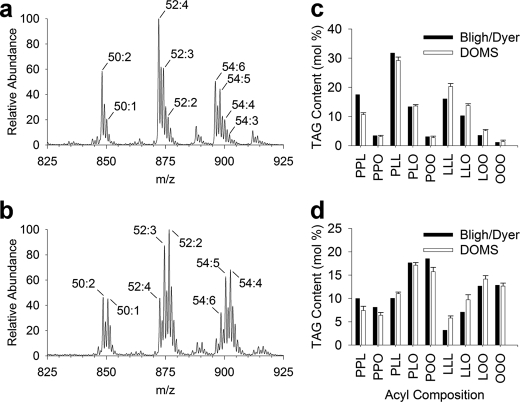
Most LDs share a similar spherical morphology despite some significant alterations in the composition of their neutral lipid core or surrounding phospholipid/protein-lined monolayer (8, 12, 29). However, the size of LDs is much more variable depending on tissue type (1) and/or metabolic state (12, 29). Expression of a Brassica nonfunctional allele of a δ-12 fatty acid desaturase (Bnfad2) in a Coker 312 wild type background produces fewer and larger LDs in cotyledons (Fig. 3, a and b) (29). Purification of these LDs was verified by bright field (Fig. 3, c and d) and epifluorescence microscopy (stained with a neutral lipid specific fluorescent dye, BODIPY 493/503) (Fig. 3, e and f). Direct sampling of these Bnfad2 LDs showed a distinct shift toward increased oleic acid (18:1) acyl chain distribution within TAG at the expense of linoleic acid (18:2) (Fig. 3g) that was confirmed qualitatively and quantitatively with conventional chemical extractions of total seed lipids (Fig. 4) and analysis of total fatty acid content by gas chromatography equipped with a flame ionization detector (supplemental Fig. 1), consistent with suppression of endogenous oleic acid desaturation by FAD2 (dominant-negative mutation). Hence, with this approach, it was possible to demonstrate directly a change in molecular composition at the organelle level in these metabolic mutants.
FIGURE 3.
Characterization of lipid droplets from high oleic cottonseed mutants. Representative in situ confocal images of mature cotton embryos from wild type (cv. Coker 312) (a) and a transgenic line expressing a Brassica nonfunctional allele of a delta-12 fatty acid desaturase (Bnfad2) stained with BODIPY 493/503 (b). Purified LDs of Coker 312 (c and e) and Bnfad2 (d and f) mature embryos visualized in bright field and stained with BODIPY 493/503. g, representative TAG profiles of Bnfad2 (blue) and Coker 312 (red) using DOMS of the purified LDs shown in c and d. Scale bars represent 10 μm (a and b) and 2 μm (c–f). P, 16:0-palmitic acid; O, 18:1-oleic acid; L, 18:2-linoleic acid.
FIGURE 4.
Validation of DOMS with conventional total lipid extracts. Representative TAG profiles from total lipid extracts of purified LDs from mature cotton embryos of Coker 312 wild type (a) and Bnfad2 transgenic (b) lines. Dominant TAG species are identified as ammonium adducts [M + NH4]+ with peaks labeled according to the total number of carbons followed by the total number of double bonds for that particular TAG mass-to-charge ratio. Quantitative comparison of molecular TAG content (c, Coker 312; d, Bnfad2) acquired through direct organelle mass spectrometry of small LD populations (10–25 LDs) relative to conventional total lipid extracts. Predominant acyl chain combinations were quantified by integrating the absolute intensities of peaks identified through tandem MS, correcting for isotopic overlap, and converting to molecular percentages. P, 16:0-palmitic acid; O, 18:1-oleic acid; L, 18:2-linoleic acid.
Sampling multiple LDs resulted in sufficient TAG concentrations within the nanospray emitters to allow for detailed compositional information to be acquired through tandem MS. The overall variability in TAG composition from sampling small, random populations of cottonseed LDs (10–25 droplets per sample) was relatively low (Fig. 4, c and d). Direct visualization and sampling of a single Bnfad2 LD (Fig. 5a) as demonstrated in supplemental Movie 2 required fine tuning the filling conditions to prevent multiple LDs from entering the tip and obscuring the final suspension of LD.
FIGURE 5.
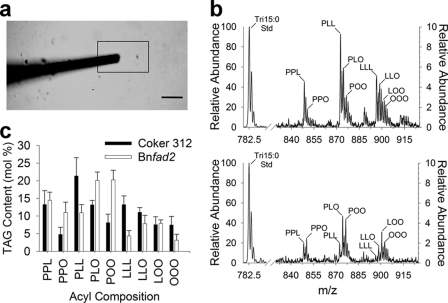
Single lipid droplet mass spectrometry and lipid droplet heterogeneity. a, bright field snapshot image of a nanospray emitter directly sampling a single LD as demonstrated in supplemental Movie 2. Scale bar represents 5 μm. b, representative TAG profiles with acyl chain designations of single LD from Tables 1 and 2 (Coker 312 LD6 and Bnfad2 LD6. LD-TAG peaks are attenuated according to the right axis to show resolution of peaks relative to spiked Tri15:0 TAG standard represented by the left axis. c, heterogeneity of TAG content within single seed LDs (n = 7 for both Coker 312 and Bnfad2). Numerical values are in Tables 1 and 2. P, 16:0-palmitic acid; O, 18:1-oleic acid; L, 18:2-linoleic acid.
To assess the heterogeneity of individual LDs isolated from cottonseed embryos, LDs were sampled individually for both the Coker 312 and Bnfad2 (Tables 1 and 2 and Fig. 5). Representative TAG spectra from single Coker 312 (Fig. 5b, top) and single Bnfad2 (Fig. 5b, bottom) LD showed identifiable TAG profiles of single LD. There was a substantial difference in mol % of TAG species (normalized to Tri 15:0 internal standard) among individual LD, both within the Coker 312 seeds and the Bnfad2 seeds (Tables 1 and 2). The average TAG molecular composition (Fig. 5C; Tables 1 and 2) of seven individual LDs combined were distinctly different from one another (Coker 312 versus Bnfad2), and the average composition of each variety approached that of the composition varieties when multiple LDs were sampled together. However, there was considerable heterogeneity among purified seed lipid droplets, suggesting a complexity in the biogenesis of LD not able to be appreciated until now. In other words, the overall average lipid composition of these seeds comes from discrete LD packages with variable TAG profiles. This is new information about LDs that would not be possible were an individual droplet not able to be sampled directly by MS. These results indicate that this technique of DOMS can be used to assess organelle heterogeneity by sampling single organelles.
TABLE 1.
Heterogeneity of TAG molecular species in Coker 312-purified seed lipid droplets
P, 16:0-palmitic acid; O, 18:1 oleic acid; L, 18:2-linoleic acid.
| TAG molecular composition |
|||||||||
|---|---|---|---|---|---|---|---|---|---|
| PPLa | PPO | PLL | PLO | POO | LLL | LLO | LOO | OOO | |
| mol % | |||||||||
| LD1 | 15.9 | 4.5 | 19.8 | 14.8 | 9.8 | 11.0 | 10.9 | 6.1 | 7.1 |
| LD2 | 9.1 | 5.7 | 18.5 | 11.5 | 10.4 | 15.2 | 13.0 | 10.4 | 6.3 |
| LD3 | 14.7 | 9.1 | 16.0 | 12.4 | 9.0 | 9.8 | 10.9 | 8.4 | 9.6 |
| LD4 | 17.2 | 4.3 | 27.9 | 14.2 | 4.9 | 13.1 | 9.7 | 5.4 | 3.2 |
| LD5 | 16.7 | 3.8 | 26.0 | 14.1 | 6.3 | 12.3 | 10.1 | 6.0 | 4.7 |
| LD6 | 13.0 | 2.6 | 26.9 | 13.4 | 6.5 | 16.3 | 10.5 | 6.1 | 4.6 |
| LD7 | 7.2 | 4.2 | 16.6 | 13.2 | 9.1 | 16.6 | 13.7 | 11.4 | 8.0 |
| Mean | 13.4 | 4.9 | 21.7 | 13.4 | 8.0 | 13.5 | 11.3 | 7.7 | 6.2 |
| S.D. | 3.9 | 2.1 | 5.1 | 1.2 | 2.1 | 2.6 | 1.5 | 2.4 | 2.2 |
a TAG acyl chains are sn-nonspecific.
TABLE 2.
Heterogeneity of TAG molecular species in Bnfad2-purified seed lipid droplets
P, 16:0-palmitic acid; O, 18:1 oleic acid; L, 18:2-linoleic acid.
| TAG molecular composition |
|||||||||
|---|---|---|---|---|---|---|---|---|---|
| PPLa | PPO | PLL | PLO | POO | LLL | LLO | LOO | OOO | |
| mol % | |||||||||
| LD1 | 17.9 | 14.0 | 7.0 | 16.2 | 22.7 | 1.6 | 4.0 | 8.8 | 7.7 |
| LD2 | 13.0 | 8.3 | 13.2 | 22.3 | 15.4 | 6.5 | 10.3 | 7.9 | 3.1 |
| LD3 | 13.2 | 9.4 | 11.4 | 21.4 | 20.4 | 5.0 | 8.5 | 6.9 | 3.8 |
| LD4 | 14.9 | 11.6 | 9.2 | 19.8 | 22.8 | 3.7 | 5.5 | 6.5 | 6.0 |
| LD5 | 13.6 | 7.5 | 14.1 | 20.4 | 18.5 | 5.1 | 10.7 | 8.3 | 1.7 |
| LD6 | 11.8 | 10.5 | 10.8 | 22.8 | 20.3 | 4.1 | 7.8 | 9.0 | 3.0 |
| LD7 | 16.0 | 15.0 | 10.6 | 17.1 | 20.7 | 4.5 | 7.8 | 7.7 | 0.7 |
| Mean | 14.3 | 10.9 | 10.9 | 20.0 | 20.1 | 4.4 | 7.8 | 7.9 | 3.7 |
| S.D. | 2.1 | 2.8 | 2.4 | 2.5 | 2.5 | 1.5 | 2.4 | 0.9 | 2.4 |
a TAG acyl chains are sn-nonspecific.
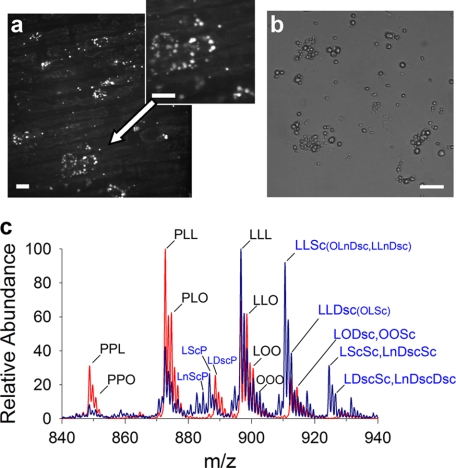
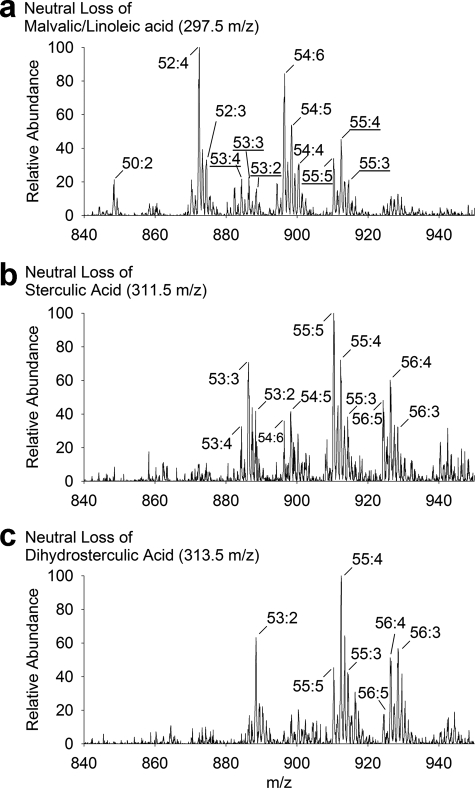
One advantage of this DOMS approach would be to distinguish by molecular composition between LDs of similar morphology. Cyclic fatty acids accumulate in root tissues of cotton seedlings during the early growth stages and include malvalic acid (8,9-methylene-8Z-heptadecenoic acid, 32.6% of total fatty acid), sterculic acid (9,10-methylene-9-octadecenoic acid, 11.0%), and dihydrosterculic acid (9S,10R-methyleneoctadecanoic acid, 0.6%) (22, 35). These cyclic fatty acids are enriched in the TAG fractions and presumed to be packaged into LDs in root cells. LDs in root cells (visualized by BODIPY-specific fluorescent staining) appeared to be either localized in clusters around the nucleus or dispersed throughout the cytosol in different root cells (Fig. 6a). Isolation and purification of these LDs did not affect their size and morphology (Fig. 6b), and this morphology was similar to the LDs purified from cotyledons of seed tissues (Fig. 3c). TAG profiles in root LDs were distinct from those derived from cotyledon tissues of seeds (Fig. 6c), and indeed, these root TAGs were enriched in cyclic fatty acids with sterculic and dihydrosterulic acids on one or two acyl chains (confirmed by tandem MS, Fig. 7, b and c). Although malvalic acid is known to be prevalent in roots by gas chromatographic studies (35), here by MS, it was not distinguishable from linoleic acid (Fig. 7a) in the purified droplets (both fatty acids have a molecular mass of 280.45 g/mol). Nonetheless, it was possible to directly distinguish LDs of differing molecular composition that were otherwise indistinguishable by morphology, illustrating that DOMS might be used to assess organelle heterogeneity within a given tissue or cell type.
FIGURE 6.
Detection of lipid droplets with cyclic fatty acyl chains in cotton roots. a, representative confocal image of BODIPY 493/503 stained LDs of 48-h germinated roots. b, bright field image of purified root LDs and resulting TAG profile (c, blue) relative to cotyledon cottonseed LDs (c, red). Cyclic fatty acid abbreviations are as follows: Sc, sterculic acid; Dsc, dihydrosterulic acid. Scale bars represent 10 μm. P, 16:0-palmitic acid; O, 18:1-oleic acid; L, 18:2-linoleic acid.
FIGURE 7.
Tandem MS analysis of lipid extracts of purified cotton root lipid droplets. In addition to tandem MS of LDs sampled through DOMS, precursor-product scans of lipid extracts of purified LDs of cotton roots aided in identification of cyclic fatty acids. Shown are precursors TAG profiles of malvalic/linoleic (a), sterculic (b), and dihydrosterculic (c) fatty acids analyzed in neutral loss mode on a triple quadrupole MS. Dominant TAG species are identified as ammonium adducts [M + NH4]+ with peaks labeled according to the total number of carbons followed by the total number of double bonds for that particular TAG mass-to-charge ratio. Underlined species in the malvalic/linoleic scan (a) correspond to TAGs with at least one sterculic or dihydrosterculic acyl chain.
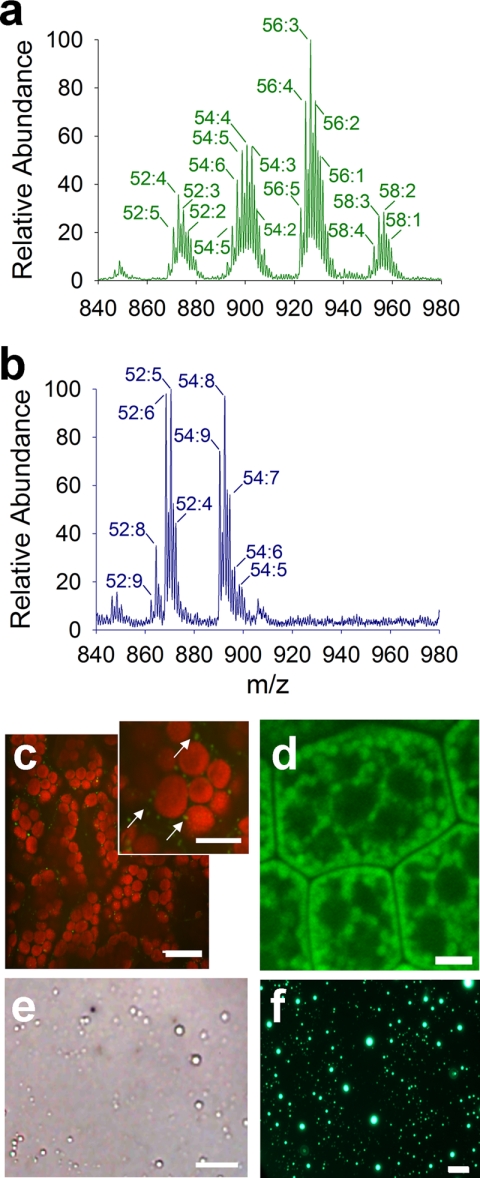
A single A. thaliana seed (∼15–25 μg) provides more than enough LDs for direct organelle mass spectrometry (Fig. 8a), and these seed LDs can be purified by a rapid two-step procedure (Fig. 8f) reducing the time from LD purification to determination of LD TAG composition to less than an hour. On the other hand, the rosette leaves (∼1 mg of dry weight) of 40-day-old Arabidopsis plants contain very few LDs per cell (Fig. 8, c and e), and much more tissue was required for purification of LDs from leaves. DOMS (supplemental Movie 3) showed that the seed LDs contained characteristic 20:1/eicosenoic fatty acids in their TAGs, whereas the LDs from leaves instead contained more 16:3 and 18:3 fatty acids that are most characteristic of leaf acyl lipids (Fig. 8b) (36). LDs in leaves (Fig. 8c), although similar in morphology to those in seeds (Fig. 8d), likely have a function different from the long term storage function of TAGs in seeds for germination and seedling establishment. Profiling organelles by DOMS from different tissues and metabolic contexts will provide new insights into how cellular and subcellular heterogeneity contributes to cellular function, which have been questions difficult to address directly until now.
FIGURE 8.
Characterization of Arabidopsis leaf and seed lipid droplets. Representative TAG profiles of LDs purified from Arabidopsis mature seeds (a) and rosette leaves of 40-day-old plants (b). Labels show the total number of carbons followed by the total number of double bonds for that particular TAG mass-to-charge ratio. Seed LDs showed an abundance of 20:1/eicosenoic fatty acids, whereas leaf LDs showed typical 18:3/16:3 fatty acids. Representative in situ confocal image (c) of wild type Arabidopsis mesophyll tissue stained with BODIPY 493/503 (red autofluorescence represents chloroplasts) and bright field snapshot image (e) of purified Arabidopsis leaf LDs as demonstrated in supplemental Movie 3. Representative in situ confocal image (d) of wild type Arabidopsis seed LDs and epifluorescence image (f) of purified Arabidopsis seed LDs stained with BODIPY 493/503. Scale bars represent 20 μm (c), 10 μm (c, inset), and 5 μm (d, e, and f).
DISCUSSION
The development of the L200 nanomanipulator supports a variety of potential analytical techniques at the cellular and subcellular level. Here, we illustrate some of these capabilities by the direct visualization of LDs derived from various cell types coupled with detailed chemical analysis. Conventional lipid profiling by MS, although detailed and capable of resolving highly complex compositions of molecules at a range of endogenous concentrations, relies on total extractions of lipid molecules from organs, tissues, or cell types, resulting in a rich mixture of compounds that lose all spatial context. Here, the DOMS facilitates a complete, comprehensive lipidomics profiling while maintaining organellar identity of the sample source. Although seed LDs contain mostly TAG molecules, there are also a small proportion of phospholipids and proteins (e.g. ∼97% TAG, 1% phospholipid, 2% protein in a 1-μm diameter LD) (8). Although only TAG molecules were detected with DOMS, it is likely that ion suppression effects prevented the detection of phospholipid with the ion trap MS. It is possible through instrument modifications that interfacing DOMS with a triple quadrupole MS might facilitate the detection of phospholipid and/or proteins, but this remains to be determined.
This technique is versatile and could be combined for the lipid profiling of other subcellular components and combined with microscopic analysis serve as a means of evaluating detailed molecular changes at the organellar level to address arrange of biological questions intractable until now. For example, considering the low variability of sampling multiple LDs, it was surprising to uncover significant TAG compositional heterogeneity when sampling individual LDs, pointing to complexity at the subcellular level in packaging TAG into lipid droplets, that until now had not been considered in models of LD biogenesis. Furthermore, it is possible to envision this approach expanded to support broad-based MS analysis of other macromolecules in organellar samples, such as proteomic or general metabolomic studies, placing this DOMS approach at the forefront of biochemical analysis with microscale resolution. Although the positioning resolution of the L200 surpasses many commercially available nanomanipulators, the relative ease of combination of a standard robotic-controlled microscope stage with conventional light microscopy and standard MS instruments (nanospray source mounted on an ion-trap or triple quad MS) provides a high level of flexibility to achieve diverse and specialized systems (26, 27). In this case, only a single end effector holding a glass nanospray emitter was necessary for sampling purified LDs; however, there are multiple ports on the L200 that could be used as molecular “tweezers” and low impedance electrical positioners (26) that might be advantageous for handling and/or sampling cellular constituents on stage, either from purified populations as was shown here, or perhaps even in situ by microdissection of whole tissue samples. Currently the nanospray emitters are not designed to penetrate the thick cell walls of plant tissues and permit selection of organelles in situ. In the future, it might be possible to use some combination of laser microdissection or cell wall digestion to gain access to organelles within tissue samples, and advances in sample preparation will expand the uses of DOMS.
Recent advances in imaging MS (MALDI-MS (23), DESI-MS (25), SIMS (18, 24), and Raman spectroscopy (18) have acquired compositional information in association with spatial distribution in biological specimens. Unfortunately, the limited resolution of MALDI-MS (typical lateral resolution of 25–100 μm (23)) and DESI-MS (typically only 250 μm (25)) makes it impossible to resolve the compositional information of single organelles. Although Raman spectroscopy approaches afford some chemical compositional information at high spatial resolution in situ, this information is limited to gross chemical information, such as confirming neutral lipid classes or overall saturation of acyl chains. A significant advantage of imaging MS is acquiring chemical information in situ. However, significant tissue preparation is often required that can adversely affect quantitative accuracy and compositional distribution (23). For example, the quantitative accuracy of MALDI-MS and TOF-SIMS is significantly affected by sample preparation necessary to withstand vacuum pressure and ion generation energies (25). Our DOMS method can derive information at a single organelle (LD) level with more comprehensive chemical compositional information than is possible by any current MS imaging approach that relies on direct ionization properties of molecules from a surface. Indeed the DOMS approach might be modified to be combined or to verify various in situ imaging techniques and together help to generate more complete chemical maps of cells and subcellular compartments than is currently available.
The DOMS approach developed and described here has the potential to be applied to diverse areas of cell biology and address many questions. In specific applications toward LDs, although significant progress has been made in understanding the mechanisms of lipid production, packaging into cytosolic LDs, and physiological roles of LDs, there are still many questions that remain unanswered, requiring additional technical advances to address. For example, what is the extent of heterogeneity in organelle composition with a cell or within tissues? Considering the acyl chain diversity of the core neutral lipid compounds, how are lipids packaged or trafficked within LDs or between associated organelles? What is the diversity of proteins or phospholipids in the LD monolayer, and are these compositions dependent on or independent of the neutral lipid components in the core? Does the size, surface composition, or neutral lipid core impact the rate of lipid accumulation or mobilization? These and many other important biological questions can begin to be, in part, addressed with the advances in analytical approaches at the microscale level.
Supplementary Material
Acknowledgment
We thank Dr. Lon Turnbull (University of North Texas) for advice and assistance with confocal microscopy.
This work was supported by Zyvex Instrument Research Grant GN1371 and University of North Texas Faculty Research Grant G33598 (to G. F. V.).

The on-line version of this article (available at http://www.jbc.org) contains supplemental Fig. 1 and Movies 1–3.
- LD
- lipid droplet
- DOMS
- direct organelle mass spectrometry
- TAG
- triacylglycerol
- DAG
- diacylglycerol
- SIMS
- secondary ion MS
- DESI
- desorption electrospray ionization.
REFERENCES
- 1. Murphy D. J. (2001) Prog. Lipid Res. 40, 325–438 [DOI] [PubMed] [Google Scholar]
- 2. Bartz R., Li W. H., Venables B., Zehmer J. K., Roth M. R., Welti R., Anderson R. G., Liu P., Chapman K. D. (2007) J. Lipid Res. 48, 837–847 [DOI] [PubMed] [Google Scholar]
- 3. Granneman J. G., Moore H. P. (2008) Trends Endocrinol Metab. 19, 3–9 [DOI] [PubMed] [Google Scholar]
- 4. Zehmer J. K., Huang Y., Peng G., Pu J., Anderson R. G., Liu P. (2009) Proteomics 9, 914–921 [DOI] [PMC free article] [PubMed] [Google Scholar]
- 5. Bozza P. T., Viola J. P. (2010) Prostaglandins Leukot. Essent. Fatty Acids 82, 243–250 [DOI] [PubMed] [Google Scholar]
- 6. Cocchiaro J. L., Kumar Y., Fischer E. R., Hackstadt T., Valdivia R. H. (2008) Proc. Natl. Acad. Sci. U.S.A. 105, 9379–9384 [DOI] [PMC free article] [PubMed] [Google Scholar]
- 7. Kumar Y., Cocchiaro J., Valdivia R. H. (2006) Curr. Biol. 16, 1646–1651 [DOI] [PubMed] [Google Scholar]
- 8. Huang A. H. C. (1992) Annu. Rev. Plant Physiol. Plant Mol. Biol. 43, 177–200 [Google Scholar]
- 9. Goodman J. M. (2008) J. Biol. Chem. 283, 28005–28009 [DOI] [PMC free article] [PubMed] [Google Scholar]
- 10. Gocze P. M., Freeman D. A. (1994) Cytometry 17, 151–158 [DOI] [PubMed] [Google Scholar]
- 11. Fukumoto S., Fujimoto T. (2002) Histochem. Cell Biol. 118, 423–428 [DOI] [PubMed] [Google Scholar]
- 12. Guo Y., Walther T. C., Rao M., Stuurman N., Goshima G., Terayama K., Wong J. S., Vale R. D., Walter P., Farese R. V. (2008) Nature 453, 657–661 [DOI] [PMC free article] [PubMed] [Google Scholar]
- 13. Slack C. R., Bertaud W. S., Shaw B. D., Holland R., Browse J., Wright H. (1980) Biochem. J. 190, 551–561 [DOI] [PMC free article] [PubMed] [Google Scholar]
- 14. Leprince O., van Aelst A. C., Pritchard H. W., Murphy D. J. (1997) Planta 204, 109–119 [Google Scholar]
- 15. Fujimoto T., Ohsaki Y., Cheng J., Suzuki M., Shinohara Y. (2008) Histochem. Cell Biol. 130, 263–279 [DOI] [PMC free article] [PubMed] [Google Scholar]
- 16. Robenek H., Buers I., Hofnagel O., Robenek M. J., Troyer D., Severs N. J. (2009) Biochim. Biophys. Acta 1791, 408–418 [DOI] [PubMed] [Google Scholar]
- 17. Débarre D., Supatto W., Pena A. M., Fabre A., Tordjmann T., Combettes L., Schanne-Klein M. C., Beaurepaire E. (2006) Nat. Methods 3, 47–53 [DOI] [PubMed] [Google Scholar]
- 18. van Manen H. J., Kraan Y. M., Roos D., Otto C. (2005) Proc. Natl. Acad. Sci. U.S.A. 102, 10159–10164 [DOI] [PMC free article] [PubMed] [Google Scholar]
- 19. Cheng C., Gross M. L., Pittenauer E. (1998) Anal. Chem. 70, 4417–4426 [DOI] [PubMed] [Google Scholar]
- 20. Schmelzer K., Fahy E., Subramaniam S., Dennis E. A. (2007) Methods Enzymol. 432, 171–183 [DOI] [PubMed] [Google Scholar]
- 21. Zehethofer N., Pinto D. M. (2008) Analytica Chimica Acta 627, 62–70 [DOI] [PubMed] [Google Scholar]
- 22. Sud M., Fahy E., Cotter D., Brown A., Dennis E. A., Glass C. K., Merrill A. H., Jr., Murphy R. C., Raetz C. R., Russell D. W., Subramaniam S. (2007) Nucleic Acids Res. 35, D527–532 [DOI] [PMC free article] [PubMed] [Google Scholar]
- 23. Murphy R. C., Hankin J. A., Barkley R. M. (2009) J. Lipid Res. 50, S317–322 [DOI] [PMC free article] [PubMed] [Google Scholar]
- 24. Brunelle A., Laprévote O. (2009) Anal. Bioanal. Chem. 393, 31–35 [DOI] [PubMed] [Google Scholar]
- 25. Dill A. L., Ifa D. R., Manicke N. E., Ouyang Z., Cooks R. G. (2009) J. Chromatogr. B 877, 2883–2889 [DOI] [PMC free article] [PubMed] [Google Scholar]
- 26. Brown J. M., Hoffmann W. D., Alvey C. M., Wood A. R., Verbeck G. F., Petros R. A. (2010) Anal. Biochem. 398, 7–14 [DOI] [PubMed] [Google Scholar]
- 27. Ledbetter N. L., Walton B. L., Davila P., Hoffmann W. D., Ernest R. N., Verbeck G. F. (2010) J. Forensic Sci. 55, 1218–1221 [DOI] [PubMed] [Google Scholar]
- 28. Chapman K. D., Austin-Brown S., Sparace S. A., Kinney A. J., Ripp K. G., Pirtle I. L., Pirtle R. M. (2001) J. Am. Oil Chem. Soc. 78, 941–947 [Google Scholar]
- 29. Chapman K. D., Neogi P. B., Hake K. D., Stawska A. A., Speed T. R., Cotter M. Q., Garrett D. C., Kerby T., Richardson C. D., Ayre B. G., Ghosh S., Kinney A. J. (2008) Crop Sci. 48, 1470–1481 [Google Scholar]
- 30. Chapman K. D., Trelease R. N. (1991) J. Cell Biol. 115, 995–1007 [DOI] [PMC free article] [PubMed] [Google Scholar]
- 31. Tzen J. T., Lai Y. K., Chan K. L., Huang A. H. (1990) Plant Physiol. 94, 1282–1289 [DOI] [PMC free article] [PubMed] [Google Scholar]
- 32. Bligh E. G., Dyer W. J. (1959) Can. J. Physiol. Pharmacol. 37, 911–917 [DOI] [PubMed] [Google Scholar]
- 33. Lísa M., Holcapek M. (2008) J. Chromatogr. A 1198–1199, 115–130 [DOI] [PubMed] [Google Scholar]
- 34. Byrdwell W. C. (2005) Lipids 40, 383–417 [DOI] [PubMed] [Google Scholar]
- 35. Schmid K. M., Patterson G. W. (1988) Phytochemistry 27, 2831–2834 [Google Scholar]
- 36. Yang Z., Ohlrogge J. B. (2009) Plant Physiol. 150, 1981–1989 [DOI] [PMC free article] [PubMed] [Google Scholar]
Associated Data
This section collects any data citations, data availability statements, or supplementary materials included in this article.


