Abstract
GoLoco motif proteins bind to the inhibitory Gi subclass of G-protein α subunits and slow the release of bound GDP; this interaction is considered critical to asymmetric cell division and neuro-epithelium and epithelial progenitor differentiation. To provide protein tools for interrogating the precise cellular role(s) of GoLoco motif/Gαi complexes, we have employed structure-based protein design strategies to predict gain-of-function mutations that increase GoLoco motif binding affinity. Here, we describe fluorescence polarization and isothermal titration calorimetry measurements showing three predicted Gαi1 point mutations, E116L, Q147L, and E245L; each increases affinity for multiple GoLoco motifs. A component of this affinity enhancement results from a decreased rate of dissociation between the Gα mutants and GoLoco motifs. For Gαi1Q147L, affinity enhancement was seen to be driven by favorable changes in binding enthalpy, despite reduced contributions from binding entropy. The crystal structure of Gαi1Q147L bound to the RGS14 GoLoco motif revealed disorder among three peptide residues surrounding a well defined Leu-147 side chain. Monte Carlo simulations of the peptide in this region showed a sampling of multiple backbone conformations in contrast to the wild-type complex. We conclude that mutation of Glu-147 to leucine creates a hydrophobic surface favorably buried upon GoLoco peptide binding, yet the hydrophobic Leu-147 also promotes flexibility among residues 511–513 of the RGS14 GoLoco peptide.
Keywords: Computer Modeling, Crystal Structure, Enzyme Mutation, Heterotrimeric G-proteins, X-ray Crystallography, GoLoco Motif, Binding Affinity, Protein Design
Introduction
Protein-based therapeutics and tools are increasingly utilized for manipulating cell biology (1–5). A vital aspect of their effective function is affinity for a target protein or ligand. An effective approach for enhancing the affinity of protein/protein interactions is structure-based computational prediction of affinity-enhancing point mutations (6–9). The development of reliable in silico procedures promises to provide a more efficient means of protein design than labor-intensive combinatorial screening techniques such as phage display or ribosome display (10–12). Previously, a structure-based protocol for predicting affinity-enhancing point mutations was developed (7), in part using as a template the high-resolution crystal structure of the heterotrimeric G-protein subunit Gαi1 in complex with the RGS14 (regulator of G-protein signaling 14) GoLoco motif (13). Residues at the protein/peptide binding surface were sequentially mutated to nonpolar amino acids in silico, producing 33 predicted affinity-enhancing mutations. Four of six experimentally tested mutations to either Gαi1 or the GoLoco motif enhanced binding affinity, as predicted by Rosetta (7).
As a critical component of seven-transmembrane domain receptor signaling, Gα subunits normally cycle between an inactive GDP-bound state and an active GTP-bound state (reviewed in Refs. 14 and 15). GoLoco motif proteins such as LGN, AGS3, RGS12, and RGS14 act as guanine nucleotide dissociation inhibitors, specifically for the adenylyl cyclase inhibitory subclass of Gα subunits (reviewed in Refs. 16 and 17). GoLoco motifs prevent GDP dissociation by binding across the Ras-like and all-helical domains of Gα, as well as by contributing an arginine side chain from the highly conserved (E/D)QR GoLoco triad (16) to contacts made to the bound guanosine diphosphate (13). Not only are GoLoco motif-containing proteins thought to modulate seven-transmembrane domain receptor signaling in various physiological responses (18–20), but these proteins are also critical to cell fate determinant sorting and cell division processes in multiple contexts across multiple species (21–24). Highlighting the value of mutation-derived affinity modulation to cell biological applications, a Gαi1N149I mutant with selective loss of GoLoco motif affinity has recently provided direct evidence for the Gαi/GoLoco protein interaction in these cell division processes (25, 26).
We previously predicted that mutation to leucine of one of three polar residues, Glu-116, Gln-147, or Glu-245, on the surface of Gαi1 enhances binding of Gαi1-GDP to the RGS14 GoLoco motif (7, 27). Although the algorithms implemented in the Rosetta program predict a favorable change in the Gibbs free energy of binding, our computational tools do not provide a clear mechanism of affinity enhancement. Knowledge of changes in the thermodynamic and/or kinetic parameters of binding, such as the rate of dissociation, will be important in the future application of these computational design strategies to biological and therapeutic questions. Here, we assessed the effects of these predicted Gαi1/GoLoco affinity-enhancing mutations on the kinetics and thermodynamics of binding using fluorescence polarization, isothermal titration calorimetry, and surface plasmon resonance. Although mutations that promote binding to a target protein are desirable, protein design applications often require the preservation of other protein functions. Accordingly, we also determined the effects of these three affinity-enhancing mutations on the nucleotide cycle of Gαi1, including GTP binding and hydrolysis. To further elucidate the molecular mechanism of affinity enhancement for one mutant, we determined the x-ray crystal structure of Gαi1Q147L-GDP bound to the RGS14 GoLoco motif. In addition, we investigated the conformational flexibility of the GoLoco peptide backbone and side chains surrounding the Leu-147 residue of the Gαi1 mutant using Monte Carlo simulations.
EXPERIMENTAL PROCEDURES
Chemicals and Other Assay Materials
Unless otherwise noted, all chemicals were the highest grade available from Sigma or Fisher Scientific. Peptides were synthesized by Fmoc (N-(9-fluorenyl)methoxycarbonyl) group protection, purified via HPLC, and confirmed using mass spectrometry by the Tufts University Core Facility (Medford, MA). Peptide sequences are as follows: FITC-GPSM2(GL2), FITC-β-alanine-NTDEFLDLLASSQSRRLDDQRASFSNLPGLRLTQNSQS-amide; FITC-RGS12 GoLoco, FITC-β-alanine-DEAEEFFELISKAQSNRADDQRGLLRKEDLVLPEFLR-amide; FITC-RGS14 GoLoco, FITC-β-alanine-SDIEGLVELLNRVQSSGAHDQRGLLRKEDLVLPEFLQ-amide; and RGS14 GoLoco, DIEGLVELLNRVQSSGAHDQRGLLRKEDLVLPEFLQ-amide.
Protein Expression and Purification
For biochemical experiments, N-terminally truncated, hexahistidine-tagged WT and mutant Gαi1 proteins were expressed and purified as described previously (28). Point mutations were made using QuikChange site-directed mutagenesis (Stratagene, La Jolla, CA). For crystallization, the Gαi1Q147L mutant was expressed and purified as described previously (29). Purified Gαi1Q147L was concentrated to 15 mg/ml and stored in crystallization buffer (10 mm Tris (pH 7.5), 1 mm magnesium chloride, 5% (v/v) glycerol, and 5 mm DTT).
Fluorescence Polarization Measurements
All polarization experiments were conducted using a PHERAstar microplate reader (BMG Labtech, Offenburg, Germany). Excitation wavelength was 485 ± 6 nm, and emission was recorded at 520 ± 15 nm. Gains of the parallel and perpendicular channels were calibrated so that 350 pm FITC probe alone had a polarization of ∼35 milli-Polarization units (mP) for each experiment. All experiments were conducted at 25 °C in triplicate using 96-well black-bottom plates (Costar, Corning, NY). The final volume of each well was brought to 180 μl with PheraBuffer (10 mm Tris (pH 7.5), 150 mm NaCl, 100 μm GDP, and 0.05% (v/v) Nonidet P-40). For experiments conducted in the presence of the transition-state mimetic, aluminum magnesium tetrafluoride (AMF),4 an additional 10 mm MgCl2, 10 mm NaF, and 30 μm AlCl3 were added to the standard PheraBuffer. Polarization was determined from raw intensity values of the parallel and perpendicular channels using PHERAstar Version 1.60 software (BMG Labtech). Binding isotherms were fit and equilibrium dissociation constants were determined using GraphPad Prism Version 5.0 as described previously (28).
Surface Plasmon Resonance Assays
Optical detection of protein/protein interactions by surface plasmon resonance was performed using a Biacore 3000 (GE Healthcare). Carboxymethylated dextran (CM5) sensor chips (GE Healthcare) with covalently bound anti-GST antibody surfaces were created as described previously (30). The GST-GoLoco fusion proteins GST-RGS12 (amino acids 1184–1228) (29), GST-RGS14 (amino acids 497–532) (29), and GST-GPSM2(GL2) (31), as well as GST alone (serving as a negative control), were loaded onto separate surfaces to levels of 1372, 963, 1290, and 1061 resonance units (RU), respectively. All experiments were performed with the sensor surface, fluidics, and pump equilibrated with Biacore running buffer (10 mm HEPES (pH 7.4), 150 mm NaCl, 0.05% (v/v) Nonidet P-40, 100 μm GDP, and 50 μm EDTA). Injections of 200 μl of WT or mutant Gαi1 at 50 μm for kinetic analyses were performed using the KINJECT command with a dissociation phase of 2000 s at a flow rate of 40 μl/min. The surface was regenerated between runs by removal of bound Gαi1 using 325-μl injections of AMF buffer (Biacore running buffer with an additional 10 mm MgCl2, 10 mm NaF, and 30 μm AlCl3). Nonspecific binding to the GST only-loaded surface was subtracted from each curve (BIAevaluation Version 3.0 software, GE Healthcare). To establish off-rates, dissociation-phase sensorgrams were normalized to percent bound, and the averages of triplicate experiments were fit to a single exponential function for dissociation without constraints using Prism Version 5.0.
Nucleotide Binding and Hydrolysis Assays
The [35S]GTPγS filter-binding assay used to measure rates of spontaneous GDP release was conducted as described previously (32). Briefly, WT or mutant Gαi1 (100 nm) was incubated in assay buffer (20 mm Tris (pH 7.5), 1 mm C12E10, 1 mm DTT, 1 mm EDTA, 100 mm NaCl, and 25 mm MgCl2) or nonspecific buffer (assay buffer plus 100 μm GTPγS) at 20 °C. Radioligand binding was initiated by the addition of 6.25 nm [35S]GTPγS. At timed intervals, 100-μl aliquots of the reaction were filtered through nitrocellulose membranes and washed four times with 7.5 ml of ice-cold wash buffer (20 mm Tris (pH 7.5), 120 mm NaCl, and 25 mm MgCl2). Filters were dried under a vacuum before measuring β-radiation via liquid scintillation counting.
Intrinsic GTP hydrolysis rates of Gαi1 subunits were assessed by monitoring the production of 32P-labeled inorganic phosphate during a single round of GTP hydrolysis as described previously (33). In brief, WT or mutant Gαi1 (100 nm) was incubated for 10 min at 20 °C with 1 × 10⁶ cpm of [γ-32P]GTP (specific activity of 6500 dpm/Ci; PerkinElmer Life Sciences) in reaction buffer (50 mm Tris (pH 7.5), 0.05% (v/v) C12E10, 1 mm DTT, 10 mm EDTA, 100 mm NaCl, and 5 μg/ml BSA). The nucleotide-loaded protein was then chilled on ice for 5 min prior to initiation of hydrolysis by the addition of 10 mm MgCl2 and 100 μm GTPγS (final concentrations). At timed intervals, 100-μl aliquots were quenched in 900 μl of charcoal slurry (5% (w/v) activated charcoal in 50 mm H3PO4 (pH 3.0)) and centrifuged at 4 °C for 10 min at 4000 × g. Subsequently, the β-radiation of 600-μl aliquots of the supernatant was counted via liquid scintillation.
Intrinsic Tryptophan Fluorescence Measurements of Gα Activation
Changes in tryptophan fluorescence of Gαi1 subunits were measured to assess activation by the transition-state mimetic GDP·AlF4−. Activation of Gαi1 results in translocation of Trp-211, a residue in the conformationally flexible switch II region, to a hydrophobic pocket; the change in environment results in an increased quantum yield of Trp-211 fluorescence (34, 35). Tryptophan fluorescence of WT or mutant Gαi1 (1 μm) was measured using a POLARstar Omega plate reader (BMG Labtech) in 187 μl of assay buffer (100 mm NaCl, 100 μm EDTA, 2 mm MgCl2, 2 μm GDP, and 20 mm Tris (pH 8.0)). Intrinsic fluorescence was measured using a 280-nm excitation filter and 350-nm emission filter (each with 10-nm cutoffs). After a 20-s equilibration at ambient temperature, activation was induced by sequential injections of 8 μl of 0.5 m NaF and 5 μl of 1.2 mm AlCl3 to each well. Tryptophan fluorescence was recorded for 2 min following activation. Fluorescence intensity traces shown represent the average of experiments performed in triplicate.
Isothermal Titration Calorimetry
Isothermal titration calorimetry (ITC) was performed using a MicroCalTM Auto-ITC200 system (GE Healthcare). WT and mutant Gαi1 subunits were subjected to size-exclusion chromatography in ITC buffer (50 mm HEPES (pH 7.5), 150 mm NaCl, 10 μm GDP, 5% (v/v) glycerol, and 0.005% (v/v) β-mercaptoethanol) and subsequently concentrated to 30 μm using a VivaSpin 20 ultrafiltration spin column (Sartorius Stedim Biotech, Göttingen, Germany) at 4 °C and 3000 × g. Lyophilized RGS14 GoLoco peptide was dissolved in ITC buffer to a concentration of 350 μm. Titrations were performed at 25 °C and consisted of 20 2-μl injections of peptide into WT Gαi1 or Gαi1Q147L solutions at 250-s intervals. Binding isotherms and curve fittings were obtained using Origin for ITC analysis software (MicroCal). Enthalpy of binding was determined for three titrations each of RGS14 GoLoco peptide into solutions of wild-type Gαi1 or Gαi1Q147L, and average values were compared with a Student's t test using Prism Version 5.0. Because ITC sensitivity did not allow us to approach a Gαi1 or peptide concentration near the KD, Gibbs free energy of binding was calculated from the more accurate fluorescence polarization binding affinity measurements, using ΔG = −R(T)ln(1/KD), where R is the universal gas constant and T is temperature in Kelvin. Entropy of binding was then estimated with ΔS = (ΔH − ΔG)/T, where ΔH is the average enthalpy of binding derived from isothermal titrations.
Crystallization and Structure Determination
The complex of Gαi1Q147L and RGS14 GoLoco peptide was obtained by mixing Gαi1Q147L and GoLoco peptide to concentrations of 400 and 600 μm, respectively, in 10 mm Tris (pH 7.5), 1 mm MgCl2, 10 μm GDP, 5% (v/v) glycerol, and 5 mm DTT. Crystals of the Gαi1Q147L·GDP/GoLoco peptide heterodimer were obtained by vapor diffusion from hanging drops containing a 1:1 (v/v) ratio of protein/peptide solution to well solution (1.5–1.6 m ammonium sulfate, 100 mm MgCl2, 100 mm sodium acetate (pH 4.8), and 10% (v/v) glycerol). Crystals (∼200 × 200 × 50 μm) formed in 1–4 days at 18 °C exhibited the symmetry of space group P2221 (a = 70.3, b = 83.7, and c = 190.1 Å, α = β = γ = 90°) and contained two Gαi1Q147L/GoLoco heterodimers in the asymmetric unit. For data collection at 100 K, crystals were transferred to well solution supplemented with 25% saturated sucrose for ∼30 s, followed by plunging into liquid nitrogen. A native data set was collected at the SER-CAT 22-BM beamline at the Advanced Photon Source (Argonne National Laboratory). Data were processed using the HKL-2000 program (36). The crystal structure of the WT Gαi1/RGS14 GoLoco heterodimer (Protein Data Bank code 2OM2 (7)), excluding the GoLoco motif peptide, nucleotide, waters, and magnesium, was used as a search model for molecular replacement using the Phaser program (37). Refinement was carried out using the Refmac5 program (38), consisting of conjugate gradient minimization and refinement of individual atomic displacement and translation-libration-screw parameters, interspersed with manual revisions of the model using the Coot program (39). The current model contains two Gαi1Q147L·GDP/GoLoco peptide heterodimers in the asymmetric unit. For data collection and refinement statistics and a list of residues that could not be located in the electron density, see supplemental Table S1. All structural images were made with PyMOL (Schrödinger LLC, Portland, OR) unless indicated otherwise.
RESULTS AND DISCUSSION
Comparing Different Point Mutations in Gαi1 That Enhance Affinity for GoLoco Motifs
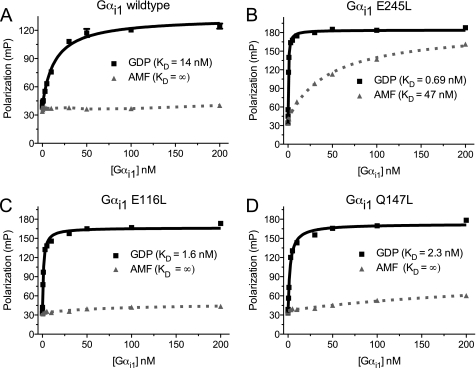
Three polar-to-nonpolar point mutations in Gαi1 (E116L, Q147L, and E245L) have been described individually (7, 27) as enhancing GoLoco motif binding affinity; the location of these three positions within Gαi1 is highlighted in supplemental Figs. S1 and S2. To determine and compare directly the affinities of these three separate Gαi1 point mutants (Gαi1E116L, Gαi1Q147L, and Gαi1E245L) for the GoLoco motif of RGS14, we used a synthetic FITC-RGS14 GoLoco motif peptide probe in fluorescence polarization (FP) binding assays similar to those performed with RGS12 and WT Gαi1 (28). Holding the peptide concentration at 350 pm, we added increasing concentrations of WT or mutant Gαi1 protein (30 pm to 200 nm) and generated equilibrium binding isotherms (Fig. 1). The dissociation constants (KD) were determined to be 14, 1.6, 2.3, and 0.69 nm for GDP-bound Gαi1WT, Gαi1E116L, Gαi1Q147L, and Gαi1E245L, respectively. These results confirm our earlier reports of affinity enhancement obtained with a tenascin-GoLoco fusion FP probe (7) and, for Gαi1E245L, mutation in the context of other affinity-modifying changes (27). Consistent with the selective binding of GoLoco motifs to ground-state Gαi subunits (i.e. Gαi·GDP) (reviewed in Ref. 16), the transition-state mimetic form (i.e. GDP·AlF4−-bound) of Gαi1WT, Gαi1E116L, and Gαi1Q147L did not demonstrate any appreciable binding to the RGS14 GoLoco motif (Fig. 1); however, the aluminum tetrafluoride-activated Gαi1E245L was observed to bind the FITC-RGS14 GoLoco FP probe with a dissociation constant of 47 nm.
FIGURE 1.
WT Gαi1 and three affinity-enhanced mutants bind to the RGS14 GoLoco motif in a nucleotide-dependent manner. Binding isotherms were generated using FP measurements by increasing the concentration of Gαi1 protein while maintaining the concentration of FITC-labeled RGS14 GoLoco motif peptide constant at 350 pm. All experiments were performed in triplicate. The error bars represent S.E. A, Gαi1WT·GDP binds the RGS14 GoLoco motif with a dissociation constant (KD) of 14 nm (95% CI, 11–17 nm). No appreciable binding was observed when the Gαi1 protein was in its transition-state mimetic form, created with AMF. B, Gαi1E245L binds the RGS14 GoLoco motif with KD values of 0.69 nm (95% CI, 0.61–0.77 nm) and 47 nm (95% CI, 37–56 nm) in its GDP and GDP·AMF forms, respectively. C, Gαi1E116L·GDP binds the RGS14 GoLoco motif with a KD of 1.6 nm (95% CI, 1.4–1.7 nm), whereas no appreciable binding is observed with the AMF-activated Gαi1E116L. D, Gαi1Q147L·GDP binds the RGS14 GoLoco motif with a KD of 2.3 nm (95% CI, 1.9–2.6 nm), whereas no appreciable binding is observed in the AMF-activated form. mP, milli-Polarization units.
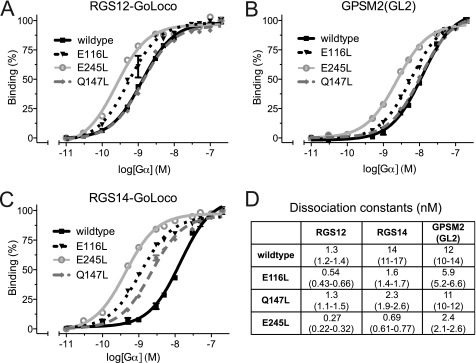
These affinity-enhancing mutations of Gαi1 were computationally predicted based on the known structure of the WT Gαi1/RGS14 GoLoco motif heterodimer (7, 27). To determine whether these mutations differentially affected binding to other known GoLoco motifs, we performed similar FP assays with GoLoco motifs from RGS12 and GPSM2 (the latter protein is also known as LGN or mammalian Pins). Both Gαi1E116L·GDP and Gαi1E245L·GDP had enhanced affinities toward the RGS12 and GPSM2 GoLoco motif FP probes, whereas the KD values obtained for Gαi1Q147L·GDP were statistically indistinguishable from those for Gαi1WT·GDP for both probes (Fig. 2).
FIGURE 2.
Gαi1 point mutants exhibit enhanced affinity for multiple GoLoco motifs as measured by FP. A–C, log linear binding isotherms were generated from FP measurements performed in triplicate and obtained by increasing the concentration of Gαi1 to 200 nm while the FITC-GoLoco probe concentration was held constant at 350 pm. D, apparent dissociation constants (KD) were calculated using nonlinear regression in GraphPad Prism. Values in parentheses represent 95% confidence intervals.
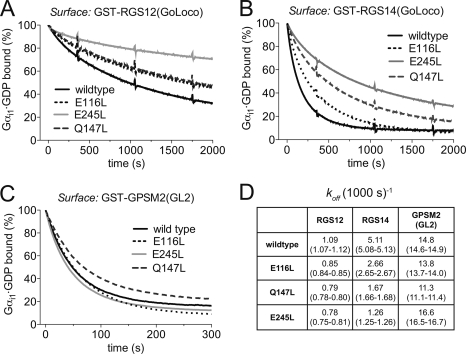
To determine the dissociation rates (koff) of the WT and mutant Gαi1 subunits from their respective complexes with the RGS12, RGS14, and GPSM2(GL2) GoLoco motifs, we used surface plasmon resonance biosensors. We generated surfaces of GST-RGS12 GoLoco, GST-RGS14 GoLoco, and GST-GPSM2(GL2) fusion proteins, each bound to separate anti-GST antibody-coated biosensor flow cells (30), and injected 200 μl of 50 nm Gαi1WT, Gαi1E116L, Gαi1Q147L, or Gαi1E245L (in their GDP-liganded forms). Dissociation rates were determined by fitting the resultant surface plasmon resonance sensorgrams (Fig. 3) with a single exponential dissociation function. RGS12 GoLoco motif-bound Gαi1WT, Gαi1E116L, Gαi1Q147L, and Gαi1E245L were observed to have koff rates of 1.09, 0.85, 0.79, and 0.78 (1000 s)−1, respectively (Fig. 3A). Although the rates of dissociation from the RGS12 GoLoco motif were significantly decreased among all mutants versus WT Gαi1, alterations in dissociation rates from the RGS14 GoLoco motif were more pronounced (Fig. 3B). Gαi1E116L, Gαi1Q147L, and Gαi1E245L had, respectively, 2-, 3-, and 4-fold decreases in their rates of dissociation compared with Gαi1WT. Gαi1E116L and Gαi1Q147L also had significant, albeit modest, decreases in their rates of dissociation from GPSM2(GL2), 13.8 and 11.3 (1000 s)−1, respectively, compared with 14.8 (1000 s)−1 for Gαi1WT. By contrast, the rate of dissociation for Gαi1E245L was actually increased slightly to 16.6 (1000 s)−1.
FIGURE 3.
Gαi1 point mutants exhibit decreased rates of dissociation from GoLoco motif complexes. Surface plasmon resonance sensorgrams were generated by injecting 200 μl of 50 nm WT or mutant Gαi1 over immobilized GST-RGS12 GoLoco motif (A), GST-RGS14 GoLoco motif (B), GST-GPSM2(GL2) (second GoLoco motif of LGN) (C), or GST alone at a flow rate of 40 μl/min with a dissociation phase of 2000 s. Dissociation curves are the plotted average of three independent experiments that have been normalized to percent of maximal binding. D, dissociation rates (koff, expressed as per 1000 s) were derived from fitting to a single exponential function using GraphPad Prism. 95% confidence intervals are shown in parentheses.
Assessment of Nucleotide Binding and Hydrolysis Properties of the Affinity-enhanced Gαi1 Mutants
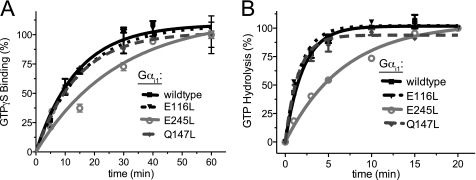
Using our 2.2-Å crystal structure of the WT Gαi1/RGS14 GoLoco motif interface (Protein Data Bank code 2OM2 (7)), we employed the Rosetta program to predict mutations with the goal of increasing GoLoco motif binding affinity while maintaining other Gα functionality. To determine whether the Gαi1 mutants retain their ability to bind GTP, we performed radionucleotide-binding assays with [35S]GTPγS. Whereas all three Gαi1 mutants were capable of binding GTPγS, Gαi1E245L had a noticeably slower rate of binding (kobs), 0.04 min−1 compared with 0.07, 0.06, and 0.07 min−1 for Gαi1WT, Gαi1E116L, and Gαi1Q147L, respectively (Fig. 4A). To determine any effects on the intrinsic GTP hydrolysis rate, we also performed single-turnover [γ-32P]GTP hydrolysis assays (Fig. 4B). Gαi1WT, Gαi1E116L, and Gαi1Q147L were observed to have similar kcat values of 0.48, 0.58, and 0.65 min−1, respectively, whereas Gαi1E245L had a reduced rate of GTP hydrolysis of 0.15 min−1 (95% confidence interval (CI), 0.12–0.17). Despite the rate changes observed with Gαi1E245L, all four Gαi1 subunits demonstrated identical rates of activation by aluminum tetrafluoride, as measured by increased Trp-211 intrinsic fluorescence (supplemental Fig. S3). However, the reduced rates of GTP binding and hydrolysis exhibited by Gαi1E245L led us to exclude this particular mutant from further pursuit.
FIGURE 4.
Rates of guanine nucleotide binding and hydrolysis by affinity-enhanced Gαi1 mutants. A, nucleotide binding assays were initiated by the addition of [35S]GTPγS to 100 nm WT or mutant Gαi1 protein in either assay buffer or nonspecific buffer (the latter with excess unlabeled nucleotide). At the indicated time points, 100 μl of the protein mixture was vacuum-filtered through nitrocellulose, washed four times, and counted by scintillation. Assays were conducted in duplicate. The error bars represent S.E. Rates of binding (kobs) were determined using nonlinear regression to be 0.07 min−1 (95% CI, 0.04–0.10), 0.04 min−1 (95% CI, 0.02–0.05), 0.06 min−1 (95% CI, 0.04–0.09), and 0.07 min−1 (95% CI, 0.06–0.08) for Gαi1WT, Gαi1E245L, Gαi1E116L, and Gαi1Q147L, respectively. B, intrinsic GTPase activities of WT and mutant Gαi1 subunits were determined using [γ-32P]GTP single-turnover assays. 100 nm Gαi1 protein was loaded with [γ-32P]GTP at 20 °C for 10 min before assays were initiated by the addition of Mg2+ (10 mm) and GTPγS (400 μm). At the indicated time points, 100 μl of the protein mixture was quenched with activated charcoal, and released [32P]Pi was counted by scintillation. Assays were conducted in duplicate. The error bars represent S.E. GTPase rates (kcat) were determined using nonlinear regression to be 0.48 min−1 (95% CI, 0.40–0.56), 0.15 min−1 (95% CI, 0.12–0.17), 0.58 min−1 (95% CI, 0.46–0.70), and 0.65 min−1 (95% CI, 0.50–0.81) for Gαi1WT, Gαi1E245L, Gαi1E116L, and Gαi1Q147L, respectively.
Assessment of Thermodynamic Binding Parameters of the Affinity-enhanced Gαi1Q147L Mutant
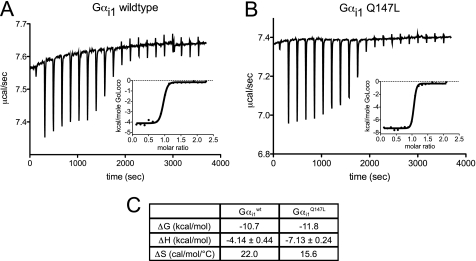
Rosetta makes predictions of changes in Gibbs free energy (ΔG) upon mutation of single residues, but because there is no explicit entropy term provided as output from the program, one cannot accurately predict whether affinity enhancement arises from favorable enthalpic (ΔH) or entropic (ΔS) thermodynamic changes (40). We therefore interrogated by isothermal titration calorimetry which thermodynamic parameter(s) were responsible for the higher affinity of GoLoco motif binding by Gαi1Q147L compared with Gαi1WT (Fig. 5). Enthalpy of binding was favorably exothermic for Gαi1Q147L at −7.13 kcal/mol compared with Gαi1WT at −4.14 kcal/mol, whereas entropy decreased unfavorably: 15.6 cal/mol/°C for Gαi1Q147L versus 22.0 cal/mol/°C for Gαi1WT (Fig. 5C).
FIGURE 5.
Thermodynamic contributions to RGS14 GoLoco motif binding by WT and Gαi1Q147L subunits as determined by ITC. 30 μm solutions of each indicated Gαi1 subunit were separately titrated with repeated additions of 350 μm RGS14 GoLoco motif peptide. Calorimetric traces of heat released and enthalpic binding curves (insets) fitted with a one-site binding model are shown for Gαi1WT (A) and Gαi1Q147L (B). The stoichiometry of binding was ∼1:1 in all experiments (three independent titrations were performed for each protein). C, average values and 95% confidence intervals for enthalpy of binding (ΔH) are given for the triplicate titration experiments (p = 0.006). Gibbs free energy (ΔG) is calculated from FP binding affinity measurements, and entropy of binding is derived by ΔS = (ΔH − ΔG)/T.
Structural Determinants of the Gαi1Q147L Mutant Bound to the RGS14 GoLoco Motif
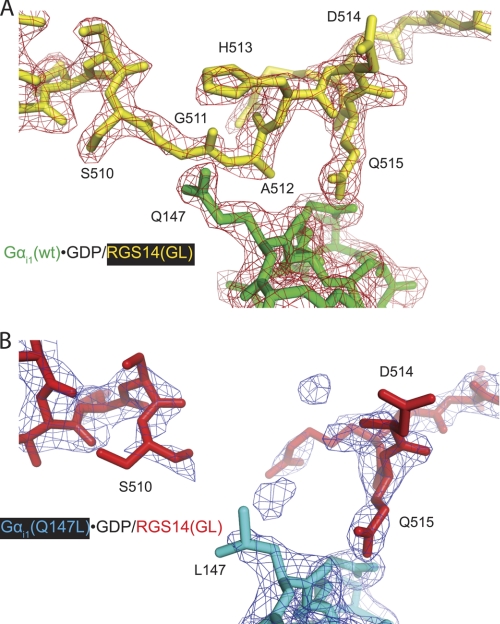
To elucidate the structural determinants of GoLoco affinity enhancement for Gαi1Q147L, we obtained x-ray diffraction data to 2.38-Å resolution from a single crystal of the Gαi1Q147L·GDP/RGS14 GoLoco motif peptide complex. A structural model was obtained by molecular replacement using the model of the WT Gαi1·GDP/RGS14 complex (Protein Data Bank code 2OM2) as a search model and subsequently refined (supplemental Table S1). The overall conformations of the Gαi1Q147L subunit and bound GoLoco motif peptide were essentially identical (root mean square deviation of 0.38 Å, 2545 atoms used in comparison) (supplemental Fig. S1) to those observed in the WT crystal structure (7). The N-terminal helix of the RGS14 GoLoco motif contacts the Ras-like domain of Gαi1Q147L in a manner similar to the WT structure (Protein Data Bank code 2OM2 (7)), whereas the N-terminal helix of a WT structure reported earlier (code 1KJY (13)) is shifted by one half-turn. The conserved (E/D)QR GoLoco triad (Asp-514, Gln-515, Arg-516) loops across the nucleotide-binding pocket, positioning the Arg-516 side chain to contact the α- and β-phosphate groups of GDP, and thus inhibits nucleotide dissociation (13). However, very weak electron density was observed for the preceding three GoLoco motif residues Gly-511, Ala-512, and His-513 that surround a well defined leucine side chain on Gαi1 at position 147 (i.e. site of the Q147L substitution) (Fig. 6). Thus, the placement of a hydrophobic leucine on the surface of Gαi1 appears to lead to disorder in the surrounding GoLoco motif peptide region. These findings suggest an increased conformational flexibility of the RGS14 GoLoco motif peptide in the region of amino acids 511–513 upon binding to Gαi1Q147L compared with WT Gαi1.
FIGURE 6.
Differences in electron density observed within the GoLoco motif between WT and Q147L mutant Gαi1·GDP/RGS14 GoLoco motif complexes. A crystal structure (using diffraction data to 2.38-Å resolution) of the Gαi1Q147L·GDP/RGS14 GoLoco motif complex (Protein Data Bank code 3ONW) was obtained. Overall, the Gαi1Q147L protein binds the RGS14 GoLoco motif protein similarly (root mean square deviation of 0.38 Å) to Gαi1WT (code 2OM2 (7)). However, electron density for the GoLoco motif peptide residues Gly-511, Ala-512, and His-513 is much weaker in the Gαi1Q147L structure (B) than in the WT structure (code 2OM2) (A), indicating disorder in the peptide surrounding the mutated Gαi1 residue Leu-147. Both 2Fo − Fc electron density maps shown are contoured at σ = 1.5.
Modeling of the Q147L Substitution by Monte Carlo Simulations
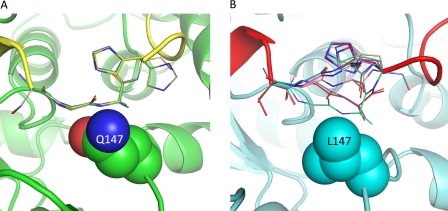
The Gαi1Q147L/GoLoco crystal structure suggest that residues 511–513 may be more dynamic in the mutant than in WT Gαi1, and therefore, an increase in conformational entropy may contribute to the enhanced affinity of Gαi1Q147L for GoLoco motifs. However, the ITC results show that the net change in the entropy component upon binding (Fig. 5) is more favorable for WT Gαi1 than for Gαi1Q147L. In general, it is very difficult to predict relative changes in binding entropies and enthalpies because enthalpy/entropy compensation is a dominant feature of solvated systems (41). Changes in water networks in either the bound or unbound state could change the number of hydrogen bonds within the system and also change the rotational freedom of each water. Given our observation of disorder within the RGS14 GoLoco motif, we used Rosetta loop modeling simulations to examine the structural preferences of GoLoco motif residues 510–513 when bound to either Gαi1WT or Gαi1Q147L. For each case, 100 independent structure prediction simulations were performed. With WT Gαi1, all 100 simulations predicted a loop conformation similar to that observed in the crystal structure (Fig. 7A). However, with Gαi1Q147L, two alternative conformations were observed for residues 510–513 (Fig. 7B). In 40% of the models, residues 510–513 adopt a conformation similar to the WT structure; in the other 60%, residues 511 and 512 are displaced by >4 Å. The alternate conformation places the backbone groups adjacent to both methyl groups on the Gαi1 residue Leu-147. The solvation energy term in Rosetta disfavors the alternate conformation for Gαi1WT because both the nitrogen and oxygen atoms of Gln-147 are desolvated without the formation of a compensating hydrogen bond. These results are consistent with the poor electron density observed for residues 511–513 in the GoLoco/Gαi1Q147L crystal structure.
FIGURE 7.
Rosetta loop modeling predictions for the RGS14 GoLoco motif bound to Gαi1WT and Gαi1Q147L. Six representative models are shown from 100 independent structure prediction trajectories. GoLoco motif residues 510–513 are shown in stick mode. Gln-147 (A) and Leu-147 (B) are shown in space filling representation. Nitrogens are colored blue, and oxygens are colored red.
Conclusions
Our findings confirm the ability of Rosetta to predict point mutations that enhance protein/protein binding affinities, a technique that should be readily applicable to other systems with high-resolution structural information available (7). Furthermore, our findings have provided insight into the kinetic, thermodynamic, and structural mechanisms underlying the favorable accommodation of affinity-enhancing mutations. Two of the three Gαi1 mutants studied (Gαi1Q147L and Gαi1E116L) exhibit enhanced binding to GoLoco motifs without disrupting guanine nucleotide binding or hydrolysis functions (an important consideration for their utility in examining selective Gα activities in an integrated cellular context). The selective loss of GoLoco motif binding of the Gαi1N149I point mutant was instrumental in establishing direct involvement of a Gαi/GoLoco motif complex in microtubule dynamics underlying spindle orientation and chromosomal segregation during cell division (25). Other groups have since employed the Gαi1N149I mutant to demonstrate that cell polarization-mediated spatial restriction of spindle orientation determinants is critical for epithelial morphogenesis (26) and that the multiple-GoLoco motif protein AGS4 may couple Gα subunits to receptor-proximal events affected by agonist application (42). The verified gain-of-function mutants Gαi1Q147L and Gαi1E116L described in this work should complement the loss-of-function Gαi1N149I mutant and find equal utility in investigating the role of Gα/GoLoco motif interactions in asymmetric cell division, epithelial progenitor differentiation, and G-protein-coupled receptor signaling regulation.
Supplementary Material
This work was supported, in whole or in part, by National Institutes of Health Grants R01 CA127152 (to D. P. S.), F30 MH074266 (to A. J. K.), and T32 GM008719 (to D. E. B. and A. J. K.).

The on-line version of this article (available at http://www.jbc.org) contains supplemental Figs. S1–S3 and Table S1.
The atomic coordinates and structure factors (code 3ONW) have been deposited in the Protein Data Bank, Research Collaboratory for Structural Bioinformatics, Rutgers University, New Brunswick, NJ (http://www.rcsb.org/).
- AMF
- aluminum magnesium tetrafluoride
- GTPγS
- guanosine 5′-O-(thiotriphosphate)
- ITC
- isothermal titration calorimetry
- FP
- fluorescence polarization
- CI
- confidence interval.
REFERENCES
- 1. Wu Y. I., Frey D., Lungu O. I., Jaehrig A., Schlichting I., Kuhlman B., Hahn K. M. (2009) Nature 461, 104–108 [DOI] [PMC free article] [PubMed] [Google Scholar]
- 2. Hahn K. M., Kuhlman B. (2010) Nat. Methods 7, 595–597 [DOI] [PubMed] [Google Scholar]
- 3. Woodnutt G., Violand B., North M. (2008) Curr. Opin. Drug Discov. Dev. 11, 754–761 [PubMed] [Google Scholar]
- 4. Leader B., Baca Q. J., Golan D. E. (2008) Nat. Rev. Drug Discov. 7, 21–39 [DOI] [PubMed] [Google Scholar]
- 5. Rao B. M., Lauffenburger D. A., Wittrup K. D. (2005) Nat. Biotechnol. 23, 191–194 [DOI] [PubMed] [Google Scholar]
- 6. Selzer T., Albeck S., Schreiber G. (2000) Nat. Struct. Biol. 7, 537–541 [DOI] [PubMed] [Google Scholar]
- 7. Sammond D. W., Eletr Z. M., Purbeck C., Kimple R. J., Siderovski D. P., Kuhlman B. (2007) J. Mol. Biol. 371, 1392–1404 [DOI] [PMC free article] [PubMed] [Google Scholar]
- 8. Kiel C., Selzer T., Shaul Y., Schreiber G., Herrmann C. (2004) Proc. Natl. Acad. Sci. U.S.A. 101, 9223–9228 [DOI] [PMC free article] [PubMed] [Google Scholar]
- 9. Reynolds K. A., Hanes M. S., Thomson J. M., Antczak A. J., Berger J. M., Bonomo R. A., Kirsch J. F., Handel T. M. (2008) J. Mol. Biol. 382, 1265–1275 [DOI] [PMC free article] [PubMed] [Google Scholar]
- 10. Karanicolas J., Kuhlman B. (2009) Curr. Opin. Struct. Biol. 19, 458–463 [DOI] [PMC free article] [PubMed] [Google Scholar]
- 11. Zahnd C., Amstutz P., Plückthun A. (2007) Nat. Methods 4, 269–279 [DOI] [PubMed] [Google Scholar]
- 12. Sidhu S. S., Koide S. (2007) Curr. Opin. Struct. Biol 17, 481–487 [DOI] [PubMed] [Google Scholar]
- 13. Kimple R. J., Kimple M. E., Betts L., Sondek J., Siderovski D. P. (2002) Nature 416, 878–881 [DOI] [PubMed] [Google Scholar]
- 14. Johnston C. A., Siderovski D. P. (2007) Mol. Pharmacol. 72, 219–230 [DOI] [PubMed] [Google Scholar]
- 15. Oldham W. M., Hamm H. E. (2008) Nat. Rev. Mol. Cell Biol. 9, 60–71 [DOI] [PubMed] [Google Scholar]
- 16. Willard F. S., Kimple R. J., Siderovski D. P. (2004) Annu. Rev. Biochem. 73, 925–951 [DOI] [PubMed] [Google Scholar]
- 17. Sato M., Blumer J. B., Simon V., Lanier S. M. (2006) Annu. Rev. Pharmacol. Toxicol. 46, 151–187 [DOI] [PubMed] [Google Scholar]
- 18. Wiser O., Qian X., Ehlers M., Ja W. W., Roberts R. W., Reuveny E., Jan Y. N., Jan L. Y. (2006) Neuron 50, 561–573 [DOI] [PubMed] [Google Scholar]
- 19. Iscru E., Serinagaoglu Y., Schilling K., Tian J., Bowers-Kidder S. L., Zhang R., Morgan J. I., DeVries A. C., Nelson R. J., Zhu M. X., Oberdick J. (2009) Mol. Cell. Neurosci. 40, 62–75 [DOI] [PMC free article] [PubMed] [Google Scholar]
- 20. Blumer J. B., Lord K., Saunders T. L., Pacchioni A., Black C., Lazartigues E., Varner K. J., Gettys T. W., Lanier S. M. (2008) Endocrinology 149, 3842–3849 [DOI] [PMC free article] [PubMed] [Google Scholar]
- 21. Colombo K., Grill S. W., Kimple R. J., Willard F. S., Siderovski D. P., Gönczy P. (2003) Science 300, 1957–1961 [DOI] [PubMed] [Google Scholar]
- 22. Yu F., Morin X., Kaushik R., Bahri S., Yang X., Chia W. (2003) J. Cell Sci. 116, 887–896 [DOI] [PubMed] [Google Scholar]
- 23. Schaefer M., Shevchenko A., Shevchenko A., Knoblich J. A. (2000) Curr. Biol. 10, 353–362 [DOI] [PubMed] [Google Scholar]
- 24. Du Q., Stukenberg P. T., Macara I. G. (2001) Nat. Cell Biol. 3, 1069–1075 [DOI] [PubMed] [Google Scholar]
- 25. Willard F. S., Zheng Z., Guo J., Digby G. J., Kimple A. J., Conley J. M., Johnston C. A., Bosch D., Willard M. D., Watts V. J., Lambert N. A., Ikeda S. R., Du Q., Siderovski D. P. (2008) J. Biol. Chem. 283, 36698–36710 [DOI] [PMC free article] [PubMed] [Google Scholar]
- 26. Zheng Z., Zhu H., Wan Q., Liu J., Xiao Z., Siderovski D. P., Du Q. (2010) J. Cell Biol. 189, 275–288 [DOI] [PMC free article] [PubMed] [Google Scholar]
- 27. Sammond D. W., Eletr Z. M., Purbeck C., Kuhlman B. (2010) Proteins 78, 1055–1065 [DOI] [PMC free article] [PubMed] [Google Scholar]
- 28. Kimple A. J., Yasgar A., Hughes M., Jadhav A., Willard F. S., Muller R. E., Austin C. P., Inglese J., Ibeanu G. C., Siderovski D. P., Simeonov A. (2008) Comb. Chem. High Throughput Screen. 11, 396–409 [DOI] [PMC free article] [PubMed] [Google Scholar]
- 29. Kimple R. J., De Vries L., Tronchère H., Behe C. I., Morris R. A., Gist Farquhar M., Siderovski D. P. (2001) J. Biol. Chem. 276, 29275–29281 [DOI] [PubMed] [Google Scholar]
- 30. Hutsell S. Q., Kimple R. J., Siderovski D. P., Willard F. S., Kimple A. J. (2010) Methods Mol. Biol. 627, 75–90 [DOI] [PMC free article] [PubMed] [Google Scholar]
- 31. McCudden C. R., Willard F. S., Kimple R. J., Johnston C. A., Hains M. D., Jones M. B., Siderovski D. P. (2005) Biochim. Biophys. Acta 1745, 254–264 [DOI] [PubMed] [Google Scholar]
- 32. Afshar K., Willard F. S., Colombo K., Johnston C. A., McCudden C. R., Siderovski D. P., Gönczy P. (2004) Cell 119, 219–230 [DOI] [PubMed] [Google Scholar]
- 33. Johnston C. A., Lobanova E. S., Shavkunov A. S., Low J., Ramer J. K., Blaesius R., Fredericks Z., Willard F. S., Kuhlman B., Arshavsky V. Y., Siderovski D. P. (2006) Biochemistry 45, 11390–11400 [DOI] [PMC free article] [PubMed] [Google Scholar]
- 34. Higashijima T., Ferguson K. M., Sternweis P. C., Ross E. M., Smigel M. D., Gilman A. G. (1987) J. Biol. Chem. 262, 752–756 [PubMed] [Google Scholar]
- 35. Wall M. A., Posner B. A., Sprang S. R. (1998) Structure 6, 1169–1183 [DOI] [PubMed] [Google Scholar]
- 36. Otwinowski Z., Minor W. (1997) Methods Enzymol. 276, 307–326 [DOI] [PubMed] [Google Scholar]
- 37. McCoy A. J., Grosse-Kunstleve R. W., Adams P. D., Winn M. D., Storoni L. C., Read R. J. (2007) J. Appl. Crystallogr. 40, 658–674 [DOI] [PMC free article] [PubMed] [Google Scholar]
- 38. Collaborative Computational Project (1994) Acta Crystallogr. D Biol. Crystallogr. 50, 760–76315299374 [Google Scholar]
- 39. Emsley P., Lohkamp B., Scott W. G., Cowtan K. (2010) Acta Crystallogr. D Biol. Crystallogr. 66, 486–501 [DOI] [PMC free article] [PubMed] [Google Scholar]
- 40. Kortemme T., Baker D. (2002) Proc. Natl. Acad. Sci. U.S.A. 99, 14116–14121 [DOI] [PMC free article] [PubMed] [Google Scholar]
- 41. Brady G. P., Sharp K. A. (1997) Curr. Opin. Struct. Biol. 7, 215–221 [DOI] [PubMed] [Google Scholar]
- 42. Oner S. S., Maher E. M., Breton B., Bouvier M., Blumer J. B. (2010) J. Biol. Chem. 285, 20588–20594 [DOI] [PMC free article] [PubMed] [Google Scholar]
Associated Data
This section collects any data citations, data availability statements, or supplementary materials included in this article.


