Abstract
Thymidine phosphorylase (TP) catalyzes the conversion of thymidine to thymine and 2-deoxyribose-1-phosphate. The latter plays an important role in induction of angiogenesis. As such, many human malignancies exhibit TP overexpression that correlates with increased microvessel density, formation of aggressive tumors, and dismal prognosis. Because TP is frequently overexpressed in cancer, pro-drugs were developed that utilize TP activity for their bioactivation to cytotoxic drugs. In this respect, TP is indispensable for the pharmacologic activity of the chemotherapeutic drug capecitabine, as it converts its intermediary metabolite 5′-deoxyfluorouridine to 5-fluorouracil. Thus, loss of TP function confers resistance to the prodrug capecitabine, currently used for the treatment of metastatic colorectal cancer and breast cancer. However, drug resistance phenomena may frequently emerge that compromise the pharmacologic activity of capecitabine. Deciphering the molecular mechanisms underlying resistance to TP-activated prodrugs is an important goal toward the overcoming of such drug resistance phenomena. Here, we discovered that lack of TP protein in drug-resistant tumor cells is due to unsplicing of its pre-mRNA. Advanced bioinformatics identified the family of heterogeneous nuclear ribonucleoproteins (hnRNP) H/F as candidate splicing factors potentially responsible for impaired TP splicing. Indeed, whereas parental cells lacked nuclear localization of hnRNPs H1/H2 and F, drug-resistant cells harbored marked levels of these splicing factors. Nuclear RNA immunoprecipitation experiments established a strong binding of hnRNP H1/H2 to TP pre-mRNA, hence implicating them in TP splicing. Moreover, introduction of hnRNP H2 into drug-sensitive parental cells recapitulated aberrant TP splicing and 5′-deoxyfluorouridine resistance. Thus, this is the first study identifying altered function of hnRNP H1/H2 in tumor cells as a novel determinant of aberrant TP splicing thereby resulting in acquired chemoresistance to TP-activated fluoropyrimidine anticancer drugs.
Keywords: Drug Resistance, Gene Regulation, Leukemia, Protein Degradation, RNA Splicing
Introduction
Thymidine phosphorylase (TP),3 also known as platelet-derived endothelial cell growth factor, catalyzes the reversible phosphorolysis of thymidine to thymine and 2-deoxyribose 1-phosphate (1). The frequent up-regulation of TP in solid tumors (2) facilitates chemotaxis of endothelial cells and angiogenesis (3–5) and was further shown to have an anti-apoptotic effect (6, 7). Consequently, overexpression of TP was correlated with increased intratumoral microvessel density (7) and dismal patient prognosis (reviewed in Ref. 8). Furthermore, the catalytic activity of TP is crucial for the cytotoxicity of fluoropyrimidine prodrugs, including capecitabine; the latter is a TP-activated oral fluoropyrimidine prodrug that is bioconverted to the mature chemotherapeutic agent 5-fluorouracil within malignant tumors where it exerts its cytotoxic activity (9, 10). Capecitabine was designed to take advantage of the increased levels of TP observed in tumors as opposed to normal tissues, hence potentially allowing for selective cytotoxicity in malignant tumors (reviewed in Ref. 11). Therefore, TP has recently gained a great deal of interest as a novel enzymatic mediator of the activity of fluoropyrimidine (pro)drugs that are bioconverted by TP to their active chemotherapeutic drug within malignant tumors. In this respect, antitumor and antiangiogenic activity of 6-(2-aminoethyl)amino-5-chlorouracil, a novel small molecule inhibitor of TP in combination with the vascular endothelial growth factor Trap, has been recently demonstrated in human small cell lung cancer xenografts (12).
Previously, we have shown that exposure of the human monocytic/macrophage leukemia cell lines THP-1 and U937 to the anti-rheumatic drug sulfasalazine (SSZ) resulted in a complete down-regulation of TP both at the mRNA and protein levels (13). The complete loss of TP protein conferred a specific anticancer drug resistance phenotype to the fluoropyrimidine prodrug capecitabine by preventing the conversion of its intermediary metabolite 5′-deoxyfluorouridine (5′-DFUR) to 5-fluorouracil (9). Here, we show that the complete lack of TP protein in these SSZ-resistant tumor cells is due to unsplicing of the primary mRNA of TP, thereby leading to its nuclear accumulation (14) and/or premature translation termination (15). Furthermore, we identified the key splicing factors responsible for this impaired splicing as heterogeneous nuclear ribonucleoproteins (hnRNPs) H1 and/or H2. We recapitulated hnRNP H2-impaired splicing activity by its stable introduction into drug-sensitive parental cells that initially displayed intact splicing of TP. We further demonstrate that this impaired splicing confers drug resistance to the fluoropyrimidine 5′-DFUR.
EXPERIMENTAL PROCEDURES
Tissue Culture
Human monocytic/macrophage THP1 and U937 cell lines were maintained in RPMI 1640 medium (Invitrogen) containing 2.3 μm folic acid supplemented with 10% fetal bovine serum, 2 mm glutamine, 100 units/ml penicillin G, and 100 μg/ml streptomycin sulfate (Biological Industries, Beth-Haemek, Israel) at 37 °C in a humidified atmosphere of 5% CO2. Cells stably growing in 0.6 or 1.5 mm SSZ, designated THP1/0.6 SSZ, THP1/1.5 SSZ, U937/0.6 SSZ, and U937/1.5, were described elsewhere (13). pcDNA3/hnRNP H2-, F-, or G-transfected cells were maintained as their parental counterparts with the addition of 0.7 mg/ml G418 (Calbiochem).
Semi-quantitative RT-PCR Analysis of Various Genes
Cells (1 × 10⁷) from the mid-log phase of growth were harvested by centrifugation; total RNA was isolated using the TRI Reagent kit (Sigma) and then treated with DNase (Promega). When purifying RNA from small numbers of cells (i.e. ≤105 cells from transfected clones in 24-well plates), the RNeasy mini kit (Qiagen) was utilized. A portion of total RNA was reverse-transcribed using the iSCRIPT cDNA synthesis kit (Bio-Rad). PCR was performed using 10 pmol of each primer (detailed in Tables 1–3) (16) in 2× ReddyMix PCR master mix reaction buffer (Thermo Scientific). For detection of ectopic gene expression, primers F-rv or H2-rv (Table 2) were used with the forward primer pcDNA3-fr 5′-AGGGAGACCCAAGCTGGCTA-3′ residing within the pcDNA 3.1 vector (Promega). PCR products were resolved on 1.5% agarose gels containing ethidium bromide.
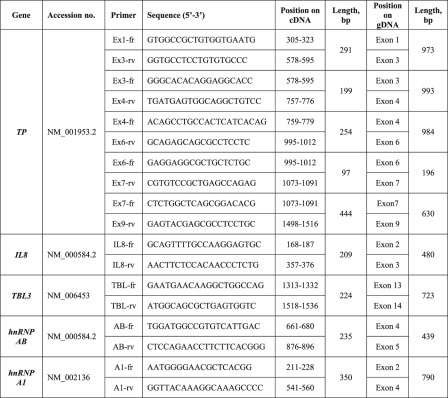
TABLE 1.
Primers designed for RT-PCR analysis of intron retention
Detailed are the primer sequences, position within the predicted length of PCR products.
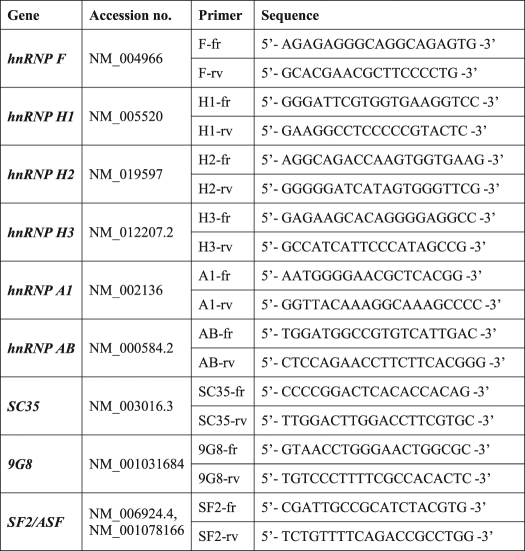
TABLE 2.
Primers designed for RT-PCR analysis of expression levels of various splicing factors
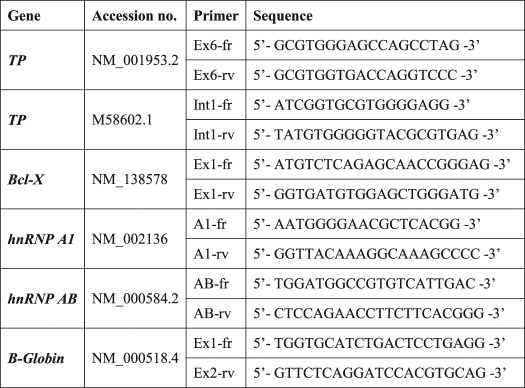
TABLE 3.
Primers used for RIP analysis
DNA Sequencing
PCR products were first purified using the Wizard SV gel and PCR clean-up kit (Promega). DNA sequencing was then performed at Hy Laboratories (Rehovot, Israel) using BigDye terminator cycle sequencing kit from ABI.
Bioinformatics Prediction of Splicing Factors Binding Sites
Genomic sequences were extracted from the UCSC human genome browser version 18 (Hg 18). The SFmap algorithm was applied to map-predicted splicing factor binding sites based on 29 experimentally verified consensus binding motifs of 17 splicing factors (supplemental Table 1). Briefly, our SFmap algorithm (17) searches for significant hits of splicing factor binding sites when considering both the genomic environment and the evolutionary conservation of a sequence window around positions matching a given consensus. The method reports significant hits relative to a background model, which was built independently for exonic and intronic regions and normalizes the number of predicted binding sites to the total length of the exon or intron. It is important to note that because of the lower than average length of the TP introns, the mapping of splicing factor binding sites was not restricted to the immediate regions flanking the binding sites but rather whole introns. Nevertheless, very similar results were obtained when mapping the splicing factor binding sites along the first and last 100 nucleotides of the intron (data not shown).
Western Blot Analysis
Nuclear and cytoplasmic extracts were prepared from exponentially growing cells (2 × 10⁷ cells) as described previously (18). Proteins were resolved by electrophoresis on 7% polyacrylamide gels containing SDS, electroblotted onto Protran BA83 cellulose nitrate membranes (Schleicher & Schuell), and reacted with the following antibodies: rabbit anti-hnRNP H1/H2 (Atlas Antibodies), rabbit anti-hnRNP H3, F, and A1 (Aviva Systems Biology), and goat anti-platelet-derived endothelial cell growth factor (Santa Cruz Biotechnology). Following three 10-min washes in Tris-buffered saline supplemented with 0.5% Tween 20 (TBST), blots were reacted with a suitable secondary antibody (Jackson ImmunoResearch) and rewashed. Enhanced chemiluminescence detection was performed using an ECL kit (Biological Industries). Enhanced chemiluminescence was recorded using the LAS-3000 imaging system (Fujifilm Global). Blots were stripped and re-probed with different antibodies.
Immunofluorescence and Confocal Laser Microscopy
107 cells were washed twice with PBS and fixed using a solution of 3.7% formaldehyde (Fluka) in PBS for 5 min. Fixed cells were then incubated for 5 min with 40 mm NH4Cl in PBS (to block free aldehyde) and washed twice with PBS, following which cells were permeabilized using 0.1% Triton X-100 in PBS for 5 min. Blocking (30 min) and incubation with a primary antibody (1 h) were carried out in a PBS solution containing 1% FCS using either polyclonal rabbit anti-human hnRNP F (1:100; Aviva Systems Biology) or anti-human hnRNP H2 (1:150; Atlas Antibodies) or the monoclonal mouse anti-human SF2/ASF (1:100; Invitrogen). Secondary donkey anti-rabbit DyLightTM 594 or donkey anti-mouse DyLightTM 488 (1:800; Jackson ImmunoResearch) was used for fluorescence labeling, and Draq5 (1:3000) was used for nuclei staining. Cells were mounted on glass slides and coated with Fluoromount-G (Southern Biotechnology Associates, Inc.) and allowed to dry overnight in the dark. All incubations were performed at room temperature. Cellular fluorescence and subcellular localization of hnRNPs were evaluated using a Zeiss LSM 510 META laser scanning confocal microscope system and software, using a single plane scan focused on cell nuclei, objective C-Apochromat X63 with a 2-fold scan zoom. Prior to image acquisition, background fluorescence was determined for each cell line using secondary antibody staining and decreased to a minimum via laser intensity settings. Linear color enhancement of individual channels (i.e. red and green) was carried out uniformly for all acquired fields using ImageJ version 1.42q processing software (National Institutes of Health).
RNA-Chromatin Immunoprecipitation (RIP)
RIP was performed as described previously (19) with the following modifications: all buffers were supplemented with protease inhibitors (complete mini, EDTA-free protease inhibitor mixture tablet, Roche Applied Science) and 50 units/ml ribonuclease inhibitor (Takara). 2 × 10⁷ cells were used for nine parallel RIP reactions. Cells were fixed in formaldehyde for 15 min, and glycine was added to a final concentration of 125 mm. Fixed cells were resuspended in 0.4 ml of buffer A (5 mm PIPES, pH 8.0, 85 mm KCl, 0.5% Nonidet P-40) and placed on ice for 10 min. The crude nuclei fraction was sedimented by microcentrifugation at 5000 rpm for 5 min at 4 °C. The pellet was washed once in Nonidet P-40-free buffer A, then resuspended in 1 ml of buffer B (10 mm EDTA, 50 mm Tris-HCl, pH 8.1, and 1% SDS), and incubated on ice for 10 min. The crude nuclei fraction was sonicated on ice three times for 5 s with 30-s intervals (Misonix Microson, amplitude 2), followed by centrifugation at 16,000 × g for 10 min at 4 °C. A 1/100 aliquot was preserved as an input sample and frozen at −80 °C until analysis. The sonicate was diluted 10-fold in IP buffer (1.2 mm EDTA, 16.7 mm Tris, pH 8.1, 167 mm NaCl, 0.01% SDS, 1.1% Triton X-100) to a final volume of 1 ml per immunoprecipitation reaction. Each reaction mixture was incubated with 10 μl of MagnaBind protein G beads (Thermo Scientific) for 30 min at 4 °C to eliminate unspecific adsorption to the beads. Beads were trapped using a magnetic plate. 4 μg of each antibody were added separately, and immune complexes were allowed to form by slow mixing on a rotating platform at 4 °C overnight. Antibodies used were anti-hnRNP F or H1/H2 (Santa Cruz Biotechnology), anti-hnRNP H3 (Aviva Systems Biology), or the monoclonal mouse anti-SF2/ASF antibody (Invitrogen). To collect immune complexes, 20 μl of MagnaBind protein G beads were added to each tube, and gentle rotation mixing proceeded for 2 h. Each immune complex was washed five times (1-ml wash, 5 min each) with the following buffers: 1) low salt buffer (20 mm Tris-HCl, pH 8.1, 2 mm EDTA, 150 mm NaCl, 0.1% SDS, 1% Triton X-100); 2) high salt buffer (the same buffer except for the inclusion of 500 mm NaCl); 3) LiCl buffer (10 mm Tris-HCl, pH 8.1, 0.25 m LiCl, 1 mm EDTA, 1% Nonidet P-40, 1% deoxycholate); 4) TE buffer (10 mm Tris-Cl, 1 mm EDTA); and the last wash was repeated twice. Immune complexes were eluted twice by addition of 250 μl of Elution buffer (0.1 m NaHCO3, 1% SDS) and incubated for 15 min with rotation mixing at room temperature. NaCl was added to a final concentration of 200 mm (including the input samples) and then placed at 65 °C for 2 h to reverse cross-linking. Next, 40 mm Tris-Cl, pH 6.5, 10 mm EDTA, and 20 μg of proteinase K were added to each sample and incubated at 42 °C for 45 min. RNA was isolated from each precipitate using the RNA Clean-Up kit-5 (Zymo Research) and reversed-transcribed using the iSCRIPT cDNA synthesis kit (Bio-Rad). PCR was performed using primers detailed in Table 3.
Expression Vectors and Stable Transfections
Cloning vectors containing full-length hnRNP H2, F, or G cDNAs were purchased from Open Biosystems. cDNAs were then transferred to pcDNA3.1 expression plasmids (Promega). Exponentially growing WT THP-1 and U937 cells (2 × 10⁷) were harvested by centrifugation and stably transfected by electroporation (1000 microfarads, 234 V) with 10 μg of the pcDNA3.1 vector, each gene in a separate transfection. Following 30 h of incubation at 37 °C, cells were subjected to G418 selection (0.7 mg/ml). Seven days later, individual clones were isolated and expanded in 96-well plates. Stable clonal transfectants were obtained after 3 weeks of G418 selection.
Leica Cell Photography
3 weeks after stable transfections, cells grown in 96-well plates were photographed in bright field mode using an inverted Leica (DMIRE2) microscope. Leica FW4000 software was used for acquisition.
5′-DFUR Growth Inhibition Assay
Cells were first grown in drug-free (i.e. SSZ or G418) growth medium for five cell doublings. Thereafter, cells were seeded in 96-well plates (2 × 10⁴ cells/well) in growth medium containing increasing concentrations of 5′-DFUR (0–3 μm). After 3 days of incubation at 37 °C, growth inhibition was determined using the cell proliferation kit (XTT, Biological Industries). Percent inhibition of cell growth was calculated relative to untreated controls. LD50 is the drug concentration exerting 50% cell death.
RESULTS
Sulfasalazine-resistant Cells Exhibit a Unique Splicing Defect of the TP Pre-mRNA
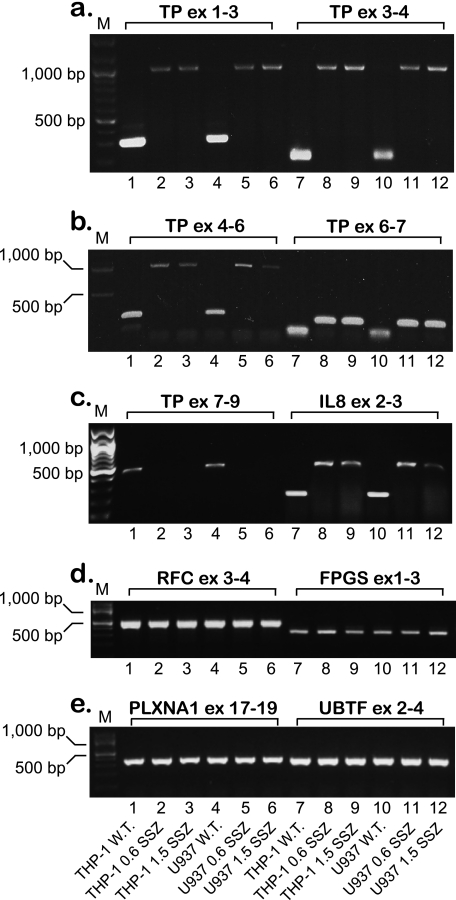
Recently, we have identified a novel mechanism of drug resistance that is based upon the complete loss of TP expression in the human acute monocytic-macrophage leukemia cell lines THP-1 and U937 subjected to a stepwise selection to the anti-rheumatic drug SSZ (13). Because TP is up-regulated in various malignant tumors and is therefore a target/mediator of anticancer therapy (20–22), we undertook this study to decipher the molecular mechanism underlying the loss of TP expression in these SSZ-resistant tumor cell lines. Using RT-PCR, we have previously shown that these SSZ-resistant cell lines are devoid of TP mRNA (13). To further examine this finding, we performed RT-PCR on the TP transcript using a newly designed set of primers (i.e. EX1-fr and EX3-rv, see Table 1). Whereas parental cell lines displayed the expected 290-bp PCR product, drug-resistant cells harbored an aberrantly long 970-bp TP product (Fig. 1a, lanes 1 and 4 versus 2 and 3 and 5 and 6, respectively). DNA sequencing of this unexpectedly large RT-PCR product revealed the presence of introns 1 and 2 within the TP transcript. We therefore designed diagnostic primers (Table 1) to investigate the potential presence of all eight introns within the principal TP transcript; indeed, RT-PCR corroborated the presence of introns 1–6 within the TP transcript in these drug-resistant cells (Fig. 1, a and b). RT-PCR of the 3′-end of the TP gene (i.e. exons 8–9) with cDNA from parental cells resulted in the predicted PCR product, whereas no product was observed for drug-resistant cells (Fig. 1c). These results establish that unsplicing of the TP pre-mRNA is the mechanism underlying loss of TP expression in SSZ-resistant cells. We next explored whether or not this aberrant splicing is restricted to TP or is a more general phenomenon affecting various gene products in these drug-resistant cells. de Bruin et al. (13) have previously shown that whereas parental THP1 and U937 cells express substantial amounts of interleukin 8 (IL8) RNA and protein, their SSZ-resistant sublines were devoid of IL8. We hence designed new primers (Table 1) residing within the second and third exons of IL8 and performed RT-PCR. Fig. 1c illustrates that like TP, IL8 is also aberrantly spliced in the SSZ-resistant sublines, and DNA sequencing of the PCR product verified the presence of intron 2. Because in our recent publication (16), methotrexate-resistant leukemia MTXR5P cells exhibited aberrant splicing of various genes, including TP, we here extended the RT-PCR analysis to include these genes that included the reduced folate carrier (RFC/SLC19A1), folyl-poly-γ-glutamate synthetase (FPGS), plexin A1 (PLXNA1), upstream binding transcription factor (UBTF) (Fig. 1, d and e), tumor necrosis factor α (TNFα) and glyceraldehyde-3-phosphate dehydrogenase (GAPDH) (data not shown). All PCRs resulted in normal size products at levels comparable with those observed in parental cells, thereby suggesting that the splicing defect appears to be restricted to the TP and IL8 pre-mRNAs.
FIGURE 1.
Semi-quantitative RT-PCR analysis of various genes reveals that SSZ-resistant cells exhibit impaired splicing of the TP and IL8 pre-mRNAs. Semi-quantitative RT-PCR analysis of various genes in parental THP-1 and U937 monocytic/macrophage leukemia cells and their SSZ-resistant sublines. The position of primers within each gene is indicated for all PCRs. The sequence of the primers and the predicted length of the PCR products are detailed in Table 1 and under “Experimental Procedures.” M denotes the 100-bp DNA ladder marker representing lengths of 100, 200, 300, 400, 500, 600, 700, 800, 900, 1000, 1200, and 1500 bp. ex, exon.
Nuclear Localization of hnRNP H1/H2 and F in SSZ-resistant Cell Lines
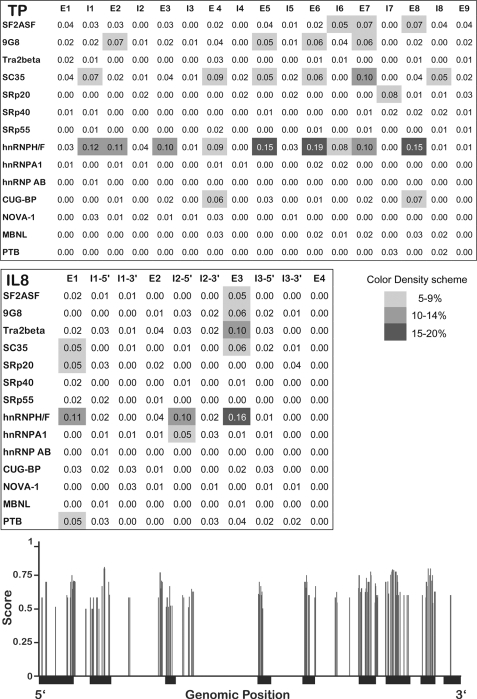
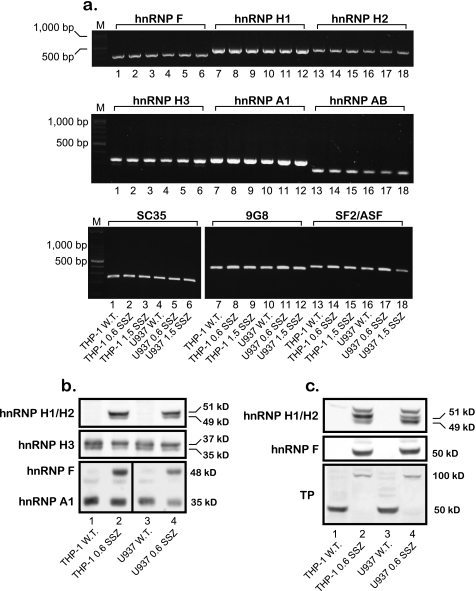
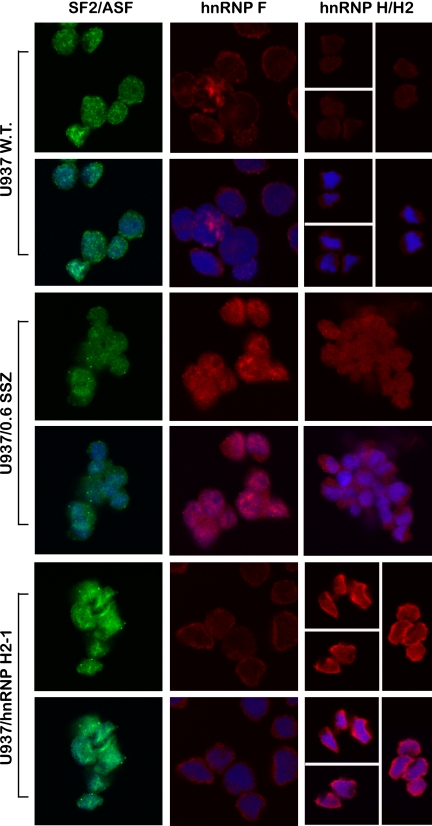
To pinpoint the splicing factor(s) responsible for the unsplicing of introns from the primary mRNAs of TP and IL8, we used our recently published computational tool for genome-wide mapping of splicing factor binding sites (BSs) (17). Fig. 2 illustrates the normalized frequency (i.e. density) of predicted binding sites for 14 splicing factors (3/17 splicing factors detailed in supplemental Table 1 had zero density of binding sites and hence are not presented here). When compared with the background model built independently for exonic and intronic regions, the TP gene harbors an enrichment of hnRNP H/F family BSs throughout the open reading frame (Fig. 2, upper and lower panels) and IL8 had a high density of hnRNP H/F BSs surrounding intron 2 (Fig. 2, middle panel). There was also lower densities of BSs for SC35 (SFRS2), 9G8 (SFRS7), and SF2/ASF (SFRS1). Based on these encouraging bioinformatics data, we first performed RT-PCR on the candidate splicing factors as well as negative controls (i.e. hnRNP A1 and AB; primers are depicted in Table 2) to examine possible alterations in their mRNA levels in SSZ-resistant cell lines. All the splicing factors had comparable expression levels when comparing parental and drug-resistant cells (Fig. 3a). Because various reports indicate that splicing factors are primarily regulated at the post-translational level by differential subcellular localization (23–25), we performed Western blot analysis on nuclear extracts and their complementary cytoplasmic fraction derived from parental and SSZ-resistant cells. Fig. 3b shows protein levels of the various splicing factors extracted from isolated nuclei of the above cell lines. Striking differences were observed at the protein level of hnRNP H1/H2 and hnRNP F, which were completely absent from the nucleus of parental cells, although highly expressed in their SSZ-resistant sublines. In contrast, hnRNPs H3 and A1 were expressed at comparable levels in all cell lines (Fig. 3b). Cytoplasmic fractions isolated from SSZ-resistant cells exhibited the same levels of hnRNP H1/H2 and hnRNP F (Fig. 3c). Following stripping and reprobing of the same Western blot with an anti-TP antibody, we confirmed that protein extracts from parental cells were indeed intact as they exhibited the 50-kDa TP protein. Based on these latter results indicating that hnRNPs H2 and F are regulated at the protein level and are absent from the nucleus, we performed immunofluorescence microscopy to determine whether or not they are subcellularly localized or absent all together. Although the control splicing factors SF2/ASF (Fig. 4, left panel) and hnRNP A1 (data not shown) exhibited consistent levels and cellular distribution in both parental and drug-resistant cells, hnRNPs F and hnRNP H2 were poorly expressed in parental cells and resided primarily in the cytoplasm (Fig. 4, middle and right panels, respectively). In contrast, hnRNP F and hnRNP H2 were expressed at much higher levels in drug-resistant U937/SSZ cells and resided both at the cytoplasm and the nucleus. Supplemental Fig. 1 depicts blow-ups of representative cells with the outline of the nucleoli to better visualize the differences in protein levels and distribution between parental and drug-resistant cells.
FIGURE 2.
Normalized frequency of predicted splicing factor binding sites, mapped along the intronic and exonic regions of the TP and IL8 genes. Upper and middle panels, binding sites for various splicing factors were predicted using our in-house algorithm SFmap (17). Gray-shaded areas represent the normalized frequency of predicted binding sites within each region; white to dark gray denote low to high densities of binding sites, respectively (color bar shown). The names of the splicing factors appear on the left side of each section, and the position within the genes is indicated by E (exon) and I (intron). Lower panel, localization and mapping of predicted hnRNP F/H-binding sites throughout the human TP gene. The structure of the TP gene is represented on the x axis, in which thin and thick black lines denote introns and exons, respectively. Vertical gray bars indicate the location of significant hits for hnRNP F/H2-binding sites along the gene. The binding sites were predicted using SFmap (17); the height of the bars indicates the prediction score (ranging from 0 to 1).
FIGURE 3.
Parental THP-1 and U937 leukemia cells differ from their SSZ-resistant sublines in the distribution and expression pattern of splicing factors. a, semi-quantitative RT-PCR analysis of RNA levels of splicing factors in parental THP-1 and U937 cells and their SSZ-resistant sublines. The sequences of the primers are detailed in Table 2. M denotes the 100-bp DNA ladder marker, displaying lengths of 100, 200, 300, 400, 500, 600, 700, 800, 900, 1000, 1200, and 1500 bp. b and c, Western blot analysis of hnRNP protein levels using nuclear extracts (a) and their complementary cytoplasmic fractions (c) from parental THP-1 and U937 cells and their SSZ-resistant sublines. Immunodetection of hnRNPs H1 and H2 was performed simultaneously because these two proteins are 96% identical (64), and hence the antibody cannot distinguish between them. The detection of nuclear hnRNPs F and A1, presented here, was simultaneously performed on the same blot. Molecular masses in kDa are shown on the right. The blots shown are representative of at least three independent experiments performed with different nuclear extracts.
FIGURE 4.
Confocal laser microscopy analysis of the cellular levels and distribution of hnRNPs H1/H2, H3, F, and SF2/ASF in U937 cells. Cellular fluorescence levels and subcellular localization of various splicing factors were evaluated using a Zeiss LSM 510 META laser scanning confocal microscope system and software, using a single plane scan focused on cell nuclei and a C-Apochromat ×63 objective (an additional 2-fold scan zoom was applied for hnRNP F and SF2/ASF). For each cell line, the upper panel depicts the immunofluorescence (green or red) pattern of the specific splice factor, and the bottom panel displays the superimposition of both this immunofluorescence and the nuclear staining (blue). For example, the colocalization of hnRNP F (red fluorescence) in the nucleus of drug-resistant U937/SSZ cells along with the blue-stained nuclei generates a purple-staining pattern. For the presentation of the subcellular expression pattern of hnRNP H2 in parental U937 and U937/hnRNP H2-1 cells (right section, upper and bottom panels, respectively), several microscope fields were chosen (separated by white lines) due to a low cell density.
hnRNP H1/H2 Strongly Bind to the TP pre-mRNA
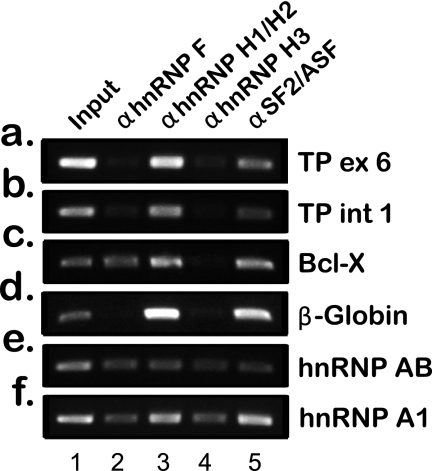
To experimentally corroborate the physical binding of members of the hnRNP F/H family to the pre-mRNA of TP, we performed RIP assays. hnRNPs H1/H2, H3, and F as well as SF2/ASF (which was bioinformatically predicted to have low density binding to TP) were immunoprecipitated from the nuclei of SSZ-resistant cells, although they were cross-linked to their endogenous RNA substrates. Following reverse transcription, PCR was performed on the isolated RNAs to determine which RNA was bound by each splicing factor. We chose to PCR exon 6 of TP, which harbors the highest density of hnRNP H/F-binding sites (Fig. 2), and intron 1, which was the highest scoring intron and has substantial physical distance from exon 6. As controls, we chose the following: Bcl-x, which was previously shown to be an hnRNP H/F substrate as it shifts between its pro-apoptotic (Bcl-xS) and anti-apoptotic (Bcl-xL) isoforms through an hnRNP H/F-dependent 5′-splice site selection (26), and hnRNP AB and β-globin, which were shown to be SF2/ASF substrates (27, 28). As shown in Fig. 5, RIP experiments provide direct evidence for a strong binding of hnRNP H1/H2 to the TP pre-mRNA; SF2/ASF also displayed binding to TP pre-mRNA. In contrast, hnRNPs F and H3 did not bind to TP RNA in these cells but did exhibit binding to the pre-mRNAs of hnRNP A1 and hnRNP AB. Furthermore, our experiments corroborated the binding of hnRNPs F and H1 to Bcl-x pre-mRNA.
FIGURE 5.
RIP experiments displaying physical binding of splicing factors to their endogenous RNA substrates. Various splicing factors were immunoprecipitated from the nuclei of SSZ-resistant cells following chemical cross-linking. Their RNA substrates were isolated and reverse-transcribed and were used as templates for PCRs. Primers used for the PCR analysis are detailed in Table 3. ex, exon.
Introduction of hnRNP F and hnRNP H2 Inflicts Impaired TP Splicing upon Parental Cells
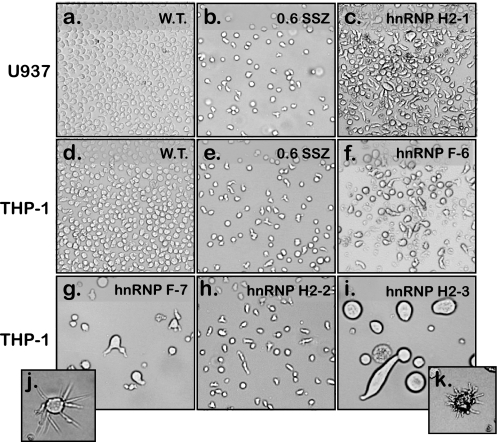
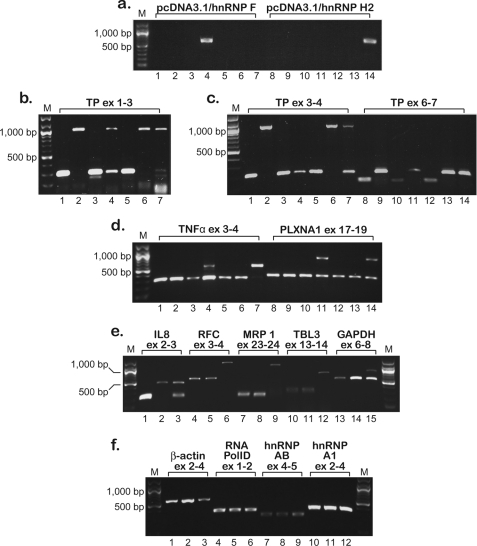
hnRNPs H2 and hnRNP F were previously shown to bind similar sequences with counter-effects on pre-mRNA cleavage and polyadenylation (29–31), whereas hnRNP F and hnRNP H2 were involved in the splicing process of various genes (26, 32–34). hnRNP H1/H2 were currently shown to physically bind to TP pre-mRNA, and although hnRNP F does not, both were absent from parental cells. Hence, to recapitulate the protein expression pattern and putative impaired splicing effect conferred upon SSZ-resistant cells by these splicing factors, we stably transfected parental THP-1 and U937 cells with expression vectors harboring the full-length cDNA of either hnRNP H2 or hnRNP F, and individual clones (∼100 clones for each transfection) were isolated in 96-well plates. As evident from representative clones shown in Fig. 6, 3 weeks after transfection, transfected cells exhibited dramatic morphological and cytoskeletal alterations both concerning cell size (Fig. 6, g and i) and cell shape (Fig. 6, c, h, and f); insets j and k illustrate abnormal microtubule elongation. Interestingly, the morphology of transfected cells was retained only under normal growth conditions (see “Experimental Procedures”), while rapidly shifting back to the wild type morphology upon changes in temperature and pH. Moreover, the majority of transfected clones either failed to survive the transition to 24-well plates or reverted to normal morphology (∼4 weeks). Only two clones termed U937/hnRNP H2-1 and THP-1/hnRNP F-6 thrived while retaining abnormal morphology (Fig. 6, c and f, respectively). One month after transfection, RNA was isolated from the remaining transfected clones as well as from mock transfectants of parental cells; expression levels of the transfected hnRNP H2 or hnRNP F were verified by RT-PCR (Fig. 7a, representative clones). Clones U937/hnRNP H2-1 and THP-1/hnRNP F-6 were positive for exogenic gene expression (Fig. 7a, lanes 4 and 14, respectively); however, clones that reverted to normal morphology deleted the transfected genes (example is given for THP-1/hnRNP H2–2, Fig. 7a, lane 3). Using the various diagnostic TP primers, we explored whether or not ectopic expression of hnRNP H2 or hnRNP F yielded aberrant splicing of TP pre-mRNA; indeed, stable introduction of hnRNP H2 and hnRNP F instigated impaired TP splicing (Fig. 7, b, lanes 4 and 7, and c, lanes 7, 11, and 14). As shown above, we were able to verify the presence of introns 1–6 of TP. Following the demonstration of impaired TP splicing in the hnRNP H2- and hnRNP F-transfected clones, we extended this RT-PCR-based analysis of impaired splicing to an assortment of genes. Using previously published (16) diagnostic primers, we identified a group of genes displaying aberrantly spliced transcripts; TNFα, PLXNA1 (Fig. 7d), as well as UBTF and FPGS (data not shown) showed at least partial intron retention. As shown in Fig. 7d, PCR of these genes resulted in aberrantly long products in addition to the predicted normal size products. In contrast, parental and SSZ-resistant cells exhibited intact splicing of these genes (Fig. 7, a–d, lanes 1 and 2 and 8 and 9). Because clone THP-1/hnRNP H2–2 maintained normal splicing (Fig. 7, a–d, lanes 3 and 10), we concluded that the aberrant splicing observed here was the result of the overexpression of hnRNP F and hnRNP H2. U937/hnRNP H2-1 was the last clone to survive after more than 5 weeks in culture and hence was available for further exploration of the splicing status. We identified five additional genes harboring impaired splicing, including IL8, RFC, transducin β-like 3 (TBL3), multidrug-associated protein 1 (MRP1/ABCC1), and GAPDH (Fig. 7e), although RNA polID, hnRNP A1, and hnRNP AB retained normal splicing (Fig. 7f). Moreover, the marked decrease in β-actin levels in this transfectant clone (Fig. 7f, compare lanes 1 and 3) may be consistent with the major cytoskeletal alterations shown in Fig. 6.
FIGURE 6.
Light microscopy images illustrating the marked morphological changes occurring in hnRNP H2/F-transfected cells. Parental U937 (a) and THP-1 (d) cells were transfected with either hnRNP H2 or F, and clones were isolated in 96-well plates. Three weeks after transfection, representative clones (c and f–i) were photographed using an inverted Leica microscope (DMIRE2, magnification ×10). Insets j and k (magnifications ×20 and 10, respectively) illustrate a single cell from the corresponding clone (i.e. THP-1/hnRNP F-7 and THP-1/hnRNP H2-3) that exhibits significant microtubule overgrowth. SSZ-resistant sub-lines were photographed for comparison (b and e).
FIGURE 7.
Semi-quantitative RT-PCR analysis of intron retention in hnRNP H2/F-transfected cells performed 1 month after transfection. Semi-quantitative RT-PCR analysis is shown of the various genes in parental THP-1 and U937 cells, their SSZ-resistant sublines, and hnRNP H2/F-transfected clones. a–d, order of the cell lines is as follows: THP-1 WT (W.T.), lanes 1 and 8; THP-1/0.6 SSZ, lanes 2 and 9; THP-1/hnRNP H2–2, lanes 3 and 10; THP-1/hnRNP F-6, lanes 4 and 11; U937 WT, lanes 5 and 12; U937/0.6 SSZ, lanes 6 and 13; U937/hnRNP H2-1, lanes 7 and 14. e and f, order of the cell lines is as follows: U937 WT, lanes 1, 4, 7, 10, and 13; U937/0.6 SSZ, lanes 2, 5, 8, 11, and 14; U937/hnRNP H2-1, lanes 3, 6, 9, 12, and 15. The position of the primers within each gene is indicated for all PCRs. Primer sequences and the predicted length of the PCR products are detailed in Table 1 and “Experimental Procedures.” M denotes the 100-bp DNA ladder marker, displaying lengths of 100, 200, 300, 400, 500, 600, 700, 800, 900, 1000, 1200, and 1500 bp.
Stable Transfection with hnRNP H2 Confers Drug Resistance to 5′-DFUR
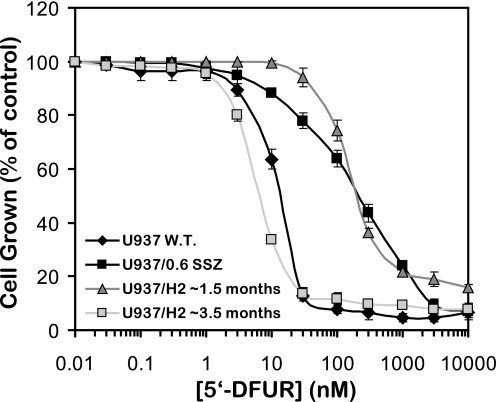
In a previous study, we showed that loss of TP activity confers drug resistance to the uridine analog 5′-DFUR (13). Because our stably transfected U937/hnRNP H2-1 clone exhibited aberrant splicing of TP, we performed cytotoxicity assays to establish a TP-dependent drug resistance phenotype to 5′-DFUR. Indeed, both U937/0.6 SSZ cells and this clonal U937/hnRNP H2-1 transfectant displayed 17-fold resistance to 5′-DFUR, the capecitabine intermediary metabolite, when compared with their parental U937 cells (Fig. 8, LD50 of 229 and 222 nm compared with 13 nm, respectively). Hence, these results establish that impaired splicing of TP via ectopic expression of hnRNP H2 confers a drug resistance phenotype to 5′-DFUR that is dependent on loss of TP function.
FIGURE 8.
Growth inhibitory effects of 5′-DFUR on parental U937 cells, their SSZ-resistant cell line, and hnRNP H2-transfectants. Exponentially growing cells were exposed to various concentrations of 5′-DFUR as detailed under “Experimental Procedures.” Following 3 days of incubation, viable cell numbers were determined. U937/hnRNP H2-1 transfected cells were tested after ∼1.5 or ∼3 months from transfection. Data shown are the means ± S.D. obtained from three independent experiments performed in triplicate.
Transfected U937 Cells Exhibit Impaired Sorting of hnRNP H2 to the Nucleus
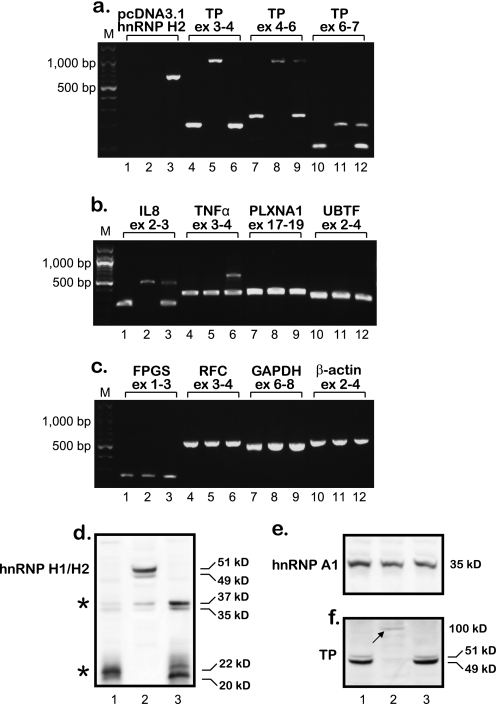
U937/hnRNP H2-1 was the only clone to survive the transition to a stable cell line; hence, after 3 months of growth in culture, RNA was isolated, and RT-PCR analysis was performed to explore its splicing status. We first verified the ectopic expression of hnRNP H2 and subsequently explored intron retention in the TP transcript. Although transfectant cells retained the expression of exogenic hnRNP H2 (Fig. 9a, lane 3), they also expressed near normal levels of properly spliced TP transcripts. Moreover, except for IL8 and TNFα, which preserved partial splicing defects (Fig. 9b, lanes 3 and 6), all the other genes that were tested displayed intact splicing (Fig. 9, b and c). Because U937/hnRNP H2-1 cells retain ectopic expression of hnRNP H2 but regained normal splicing, we performed an immunofluorescence microscopy assay to explore hnRNP H2 protein levels and subcellular localization. As shown in Fig. 4 (bottom panel), although hnRNP H2 is overexpressed in stably transfected cells, it is predominantly confined to the cytoplasm where it cannot affect splicing. Western blot analysis performed with nuclear extracts corroborated these findings, as hnRNP H2 protein was not detectable in the nucleus of hnRNP H2-transfected cells (Fig. 9d), whereas hnRNP A1 was equally detected in all cell lines (Fig. 9e). Furthermore, in concordance with our new observations, Western blot analysis on cytoplasmic extracts established normal TP protein levels in U937/hnRNP H2-1 transfectant cells (Fig. 9f, compare lane 3 with 1), and cytotoxicity assays confirmed the restoration of hypersensitivity to 5′-DFUR (Fig. 8, LD50 of 5.3 nm compared with 13 nm in parental cells). Consistent with our previous report (13), SSZ-resistant cells had no detectable TP protein but rather expressed a residual level of a high molecular weight protein (Fig. 9f, lane 2, arrow). Following multiple repeats of stable transfections with hnRNP F or hnRNP H2 with similar results, we conclude that parental cells abolish the nuclear ectopic expression of these genes presumably via their proteolytic cleavage. Fig. 9d illustrates the presence of possible proteolytic products with molecular masses of ∼35 and ∼20 kDa (see asterisk) mainly in nuclear extracts isolated from hnRNP H2-transfected cells. These low molecular weight peptides were not visible after stable transfection with hnRNP G and F (data not shown).
FIGURE 9.
Analysis of intron retention, hnRNP H2 targeting to the nucleus, and TP protein levels in hnRNP H2/F-transfected cells performed 3 months after transfection. a–c, semi-quantitative RT-PCR analysis of various genes in parental U937 cells, their SSZ-resistant subline, and the hnRNP H2-1 transfectant clone. The order of the cell lines is as follows: U937 WT (W.T.), lanes 1, 4, 7, and 10; U937/0.6 SSZ, lanes 2, 5, 8, and 11; U937/hnRNP H2-1, lanes 3, 6, 9, and 12. The position of the primers within each gene is indicated for all PCRs. Primer sequences and the predicted length of PCR products are detailed in Table 1 and “Experimental Procedures.” M denotes the 100-bp DNA ladder marker, displaying lengths of 100, 200, 300, 400, 500, 600, 700, 800, 900, 1000, 1200, and 1500 bp. d–f, Western blot analysis using nuclear (d and e) and cytoplasmic extracts (f) from U937 WT (lane 1), U937/0.6 SSZ (lane 2), and U937/hnRNP H2-1 (lane 3). Immunodetection of hnRNPs H1 and H2 was performed simultaneously because these two proteins are 96% identical (64); hence, the antibody cannot distinguish between them. Molecular masses in kDa are shown on the right; asterisks denote degradation products. Blots shown are representative of at least three independent experiments performed with different protein extracts.
DISCUSSION
Loss of TP expression and/or function may pose a major obstacle in fluoropyrimidine-based chemotherapy. This study was undertaken to investigate the mechanism underlying loss of TP RNA and protein in drug-resistant tumor cells (13). Our first discovery here concerns the identification of a novel modality of drug resistance that is based upon unsplicing of TP pre-mRNA. Based on our previous report (13) demonstrating that SSZ-resistant tumor cells lack TP mRNA, we found here that these cells harbor unspliced TP RNA, as illustrated by the presence of introns 1–6 in the principal TP transcript. Localization of the primers previously used for detection of TP RNA (13) revealed that the forward primer resides within the junction of exons 3 and 4 and hence could not detect an unspliced transcript. This novel mechanism of TP unsplicing may result in premature translation termination and activation of the nonsense-mediated mRNA decay pathway (15, 35, 36), as just the retention of intron 1 introduces a stop codon after 174 amino acids. Nonsense-mediated mRNA decay may also account for the relatively low transcript levels of the aberrantly long PCR products observed in the SSZ-resistant cells. Another plausible outcome of the unsplicing of TP pre-mRNA is its accumulation in the nucleus and its rapid degradation (reviewed in Ref. 14).
The second novel finding reported here is the first demonstration of the physical binding of hnRNP H1/H2 and SF2/ASF to TP pre-mRNA using nuclear RIP experiments. Although all members of the hnRNP H/F subfamily bind to the same consensus sequences (37), only hnRNP H1/H2 bind TP pre-mRNA. This is likely due to the functional redundancy in this family of splicing factors and the network of factors that may affect the binding of splicing factors to their pre-mRNA substrates. The fact that both hnRNP H1/H2 and hnRNP F were differentially expressed in SSZ-resistant cells when compared with parental cells, suggested their implication in TP pre-mRNA splicing. Indeed, both splicing factors affected TP splicing when ectopically expressed in transfected parental cells. Moreover, the results of the RIP experiments provided the first identification of endogenous RNA substrates of hnRNP H3, i.e. hnRNP A1 and hnRNP AB.
The third finding concerns the role of hnRNPs H1/H2 in aberrant splicing. hnRNP H2 was previously associated with pre-mRNA cleavage and polyadenylation (29, 30), whereas hnRNPs H1 was reported to regulate splicing (26, 32–34). We find here that upon stable introduction of hnRNP H2 into parental cells, they exhibit impaired splicing of the pre-mRNAs of TP and an assortment of genes. The rationale that led us to this finding is as follows: because SSZ-resistant cells displayed impaired splicing only of a limited subset of genes, including TP and IL8, we investigated which of the splicing factors may be responsible for this aberrant splicing. Using a novel algorithm (17) for genome-wide mapping of splicing factor BSs, we found a high abundance of highly scoring hnRNP H/F family BSs surrounding all the introns of the TP gene (except for intron 8). Consistently, highly scoring BSs for hnRNP H/F were also found to surround intron 2 of the IL8 gene. As we verified the retention of introns 1–6 in the TP transcript as well as intron 2 in the IL8 transcript, we explored the mRNA levels of the various suspected splicing factors in parental and SSZ-resistant cells and found no quantitative alterations in gene expression. Splicing factors are known to be regulated also by subcellular localization (23–25); members of the hnRNPs H/F family are regulated by translocation to various subcellular compartments both physiologically as well as under stress or pathological conditions (24, 25, 38, 39). Because splicing factors exert their activity in the nucleus, Western blot analysis was undertaken using either nuclear extracts or cytoplasmic fractions isolated from parental and SSZ-resistant cells, to assess the protein levels of these splicing factors. Whereas hnRNPs H3 and A1 protein levels were comparable in all cell lines, hnRNPs H1/H2 and F were completely absent from both the cytoplasm and nuclei of parental cells. These results initially appeared counter-intuitive as splicing factors typically reside in the nucleus. We thus hypothesized that parental THP-1 and U937 monocytic leukemia cells have acquired an altered expression and/or subcellular localization of these hnRNPs during the process of malignant transformation (39). The results of the Western blot analysis led us to specific candidates possibly responsible for the observed splicing defect. To further explore the possible role of these factors in the splicing of TP, we performed RIP experiments. Specifically, to investigate the role of the missing splicing factors (i.e. hnRNPs) on the splicing of TP pre-mRNA, we stably transfected parental cells with hnRNP H2 or hnRNP F and explored their impact on the splicing of the pre-mRNA of TP and other genes. Introduction of hnRNP H2 or hnRNP F into parental cells recapitulated impaired splicing of an assortment of genes, including TP and IL8, while retaining normal splicing of various genes, including hnRNPs A1 and AB, RNA polymerase ID and β-actin, thereby suggesting that this was not a global impairment of splicing. Furthermore, individual transfectant clones that excluded the transfected hnRNP gene retained normal splicing. Although properly spliced, β-actin was substantially down-regulated upon transfection of hnRNP H2. This phenomenon is in accord with the marked morphological changes observed in most transfectant clones; the latter lost their parental round shape and became asymmetric, long, or very large with clear indications of aberrant microtubule overgrowth. THP-1 and U937 cells were widely studied for their monocyte-macrophage differentiation (40–43) typically by exposure to phorbol myristate acetate or the phorbol ester 12-O-tetradecanoylphorbol-13-acetate. Both stimulate morphological changes in THP-1 and U937 cells (i.e. cytoplasmic projections) as part of the transition from suspension to monolayer growth conditions. Hence, transfection with hnRNPs H2 and F may mimic the naturally occurring alterations in cytoskeletal structure during differentiation. Further studies are warranted to investigate this proposed association.
Stable ectopic expression of hnRNP H2 conferred upon transfectant cells not only impaired splicing of the TP pre-mRNA but also a TP-dependent 5′-DFUR resistance phenotype. The role of TP in fluoropyrimidine sensitivity is well established (9, 44), as its catalytic activity is absolutely essential for the conversion of fluoropyrimidine pro-drugs to active cytotoxic agents. By disrupting the splicing of TP in parental cells transfected with hnRNP H2, we recapitulated the 5′-DFUR resistance phenotype originally observed in SSZ-resistant cells. The role of impaired splicing in the acquisition of anticancer drug resistance is in accord with our recent publication that defective folyl-poly-γ-glutamate synthetase splicing results in resistance to polyglutamatable antifolates (16). Other reports described the acquisition of multidrug resistance phenomena through alternative splicing of the anti-apoptotic factors FAS (45) and Bcl-x (46). It is of note that the latter shifts between its pro-apoptotic (Bcl-xS) and anti-apoptotic (Bcl-xL) isoforms through an hnRNP H/F-dependent 5′-splice site selection (26).
hnRNPs F and A1 are both shuttled to the nucleus by a transporter termed transportin (25), and because hnRNP A1 is localized in the nucleus of parental cells, shuttling by transportin may not be the basis for the absence of hnRNP F from the nucleus of parental cells. A specific nuclear transporter for hnRNPs H1, H2, and H3 has not been identified yet. Nuclear localization of hnRNPs H2 and F wreaks havoc in parental cells, as evident from the following findings: (a) only 20 of ∼400 isolated transfectant clones survived the first 4 weeks of growth, and only two clones (i.e. U937/hnRNP H2-1 and THP-1/hnRNP F-6) expressed the transfected gene. (b) Transfectant clones lost normal cell morphology and presented aberrant microtubule overgrowth. (c) Both surviving clones exhibited impaired splicing of multiple genes (i.e. IL8, TNFα, PLXNA1, UBTF, FPGS, RFC, TBL3, MRP1, and GAPDH), which is expected to substantially interfere with normal cellular metabolism. (d) The only transfectant clone that survived the transition to long term growth in culture was devoid of nuclear localization of hnRNP H2, as indicated by Western blot and immunofluorescence analyses. Consequently, this clone resumed normal splicing of various genes and even regained hypersensitivity to 5′-DFUR, when compared with its parental counterpart. Because SSZ-resistant cells harbor hnRNPs H2 and F in the nucleus without a dramatic deleterious effect on splicing (i.e. impaired splicing was detected only for TP and IL8) as observed with the transfectant parental cells, we propose the involvement of other splicing factors that may cooperate with these hnRNPs, thereby refining their influence on splicing.
As both hnRNP H2 and F have an established role in RNA processing, including 5′-capping (47), 3′-cleavage (30, 31), and polyadenylation (29, 30, 48), and because the different steps of RNA processing are believed to be interlinked and influence each other's specificity and efficiency (reviewed in Ref. 49), particularly polyadenylation and splicing (50), hnRNP H2 and hnRNP F may modulate splicing in an indirect manner. This could account for the dramatic effect of hnRNP H2/F transfection on the splicing of multiple genes. Moreover, although previously shown to bind to similar RNA sequences, these two factors have counter-effects on polyadenylation and appear to have redundant activities in our study. This conclusion of functional redundancy is based on the finding that parental THP-1 and U937 cells exclude both of these splicing factors from the nucleus, although hnRNP F does not appear to bind TP, and transfection with either of these hnRNPs resulted in impaired splicing.
Although stable transfection of parental cells with hnRNP H2 results in ectopic expression of hnRNP H2 mRNA (as confirmed by PCR), the mature protein is completely eliminated from the nucleus, as confirmed by both Western blot analysis and immunofluorescence microscopy. Instead of an ∼50-kDa protein, Western blot analysis reveals two low molecular weight polypeptides of ∼35 and ∼20 kDa. The very same 35-kDa protein was found in 14 breast cancer patient specimens tested for hnRNP H1 expression, whereas 7 normal breast epithelium specimens displayed the full-length hnRNP H1 protein (51). In concordance, hnRNP H1/H2 were shown to undergo post-translational proteolytic cleavage around amino acid residues 190–200, thereby yielding two proteolytic products as follows: a C-terminal 35-kDa fragment as well as an N-terminal 22-kDa polypeptide (52). Recently, Cathelin et al. (53) demonstrated that caspase-8 cleaves hnRNP H1 as part of a specific leukocyte maturation-differentiation program. Caspases are aspartate-specific cysteine proteases that were identified as key players in apoptotic cell death (reviewed in Ref. 15). Caspase-8 has a crucial role in macrophage differentiation (54) and has been specifically shown to undergo sumoylation at lysine 156 (55). Sumoylation of caspase-8 is associated with its nuclear localization while retaining its proteolytic activity (55), hence allowing the cleavage of endogenous and ectopic hnRNPs H1/H2 proteins in the nucleus of parental cells. To verify that the degradation products are not a result of either the drug selection process after transfection or the electroporation procedure itself, we stably transfected parental U937 cells with a pcDNA harboring hnRNP G and evaluated the possible presence of its degradation products. Cells transfected with hnRNP G did not display elevated levels of the proteolytic products, hence linking them to hnRNP H2. Clearly, proteolytic cleavage of hnRNP H1 and H2 is likely to be a protective mechanism by which parental cells prevent the lethal nuclear overexpression of these ectopic hnRNP genes as well as their endogenous proteins. Another possibility is the gain of function by the proteolytic products; the N-terminal peptide of hnRNP H2 harbors two RNA recognition motifs (52) and thus resembles the UP1 protein that is obtained by proteolytic cleavage of hnRNP A1 (56). This Up1 protein possesses a nucleic acid helix-destabilizing effect (56, 57) and stimulates the activity of DNA polymerase II (56, 58), an activity that is not contained in the hnRNP A1 protein itself (56).
Mitochondrial neurogastrointestinal encephalomyopathy is an autosomal recessive disorder caused by loss-of-function mutations in the TP gene (reviewed in Ref. 59). Mutations found in intronic sequences of TP splice sites in mitochondrial neurogastrointestinal encephalomyopathy patients lead to various exon skipping phenomena and consequent down-regulation of TP activity. A similar case has been reported where a disease-causing substitution at the donor site of NF-1 exon 3 results in its skipping (60). Interestingly, exon recognition in the mutant can be rescued by disruption of the binding of hnRNP H, which binds specifically to the donor sequence of NF-1 exon 3 and restricts the accessibility of U1 small nuclear ribonucleoprotein to the donor site. SR proteins (such as SF2/ASF) function early in spliceosome assembly to promote the formation of complexes containing U1 snRNP bound to the intron 5′ splice site and U2 snRNP bound to the branch site (61–63). Hence, manipulating the binding of hnRNP H and SF2/ASF may rescue splicing in some mitochondrial neurogastrointestinal encephalomyopathy patients.
In summary, we uncovered here a novel mechanism of loss of TP gene expression and function that is based on an hnRNP H2-dependent impaired splicing of TP pre-mRNA. This impaired splicing results in a fluoropyrimidine-based drug resistance in tumor cells.
Supplementary Material

The on-line version of this article (available at http://www.jbc.org) contains supplemental Fig. 1 and Table 1.
- TP
- thymidine phosphorylase
- SSZ
- sulfasalazine
- 5′-DFUR
- 5′-deoxyfluorouridine
- hnRNP
- heterogeneous nuclear ribonucleoproteins
- BS
- binding site
- RIP
- RNA immunoprecipitation.
REFERENCES
- 1. Friedkin M., Roberts D. (1954) J. Biol. Chem. 207, 245–256 [PubMed] [Google Scholar]
- 2. Takebayashi Y., Yamada K., Miyadera K., Sumizawa T., Furukawa T., Kinoshita F., Aoki D., Okumura H., Yamada Y., Akiyama S., Aikou T. (1996) Eur. J. Cancer 32A, 1227–1232 [DOI] [PubMed] [Google Scholar]
- 3. Haraguchi M., Miyadera K., Uemura K., Sumizawa T., Furukawa T., Yamada K., Akiyama S., Yamada Y. (1994) Nature 368, 198. [DOI] [PubMed] [Google Scholar]
- 4. Yonenaga F., Takasaki T., Ohi Y., Sagara Y., Akiba S., Yoshinaka H., Aikou T., Miyadera K., Akiyama S., Yoshida H. (1998) Pathol. Int. 48, 850–856 [DOI] [PubMed] [Google Scholar]
- 5. Ota T., Suzuki Y., Nishikawa T., Otsuki T., Sugiyama T., Irie R., Wakamatsu A., Hayashi K., Sato H., Nagai K., Kimura K., Makita H., Sekine M., Obayashi M., Nishi T., Shibahara T., Tanaka T., Ishii S., Yamamoto J., Saito K., Kawai Y., Isono Y., Nakamura Y., Nagahari K., Murakami K., Yasuda T., Iwayanagi T., Wagatsuma M., Shiratori A., Sudo H., Hosoiri T., Kaku Y., Kodaira H., Kondo H., Sugawara M., Takahashi M., Kanda K., Yokoi T., Furuya T., Kikkawa E., Omura Y., Abe K., Kamihara K., Katsuta N., Sato K., Tanikawa M., Yamazaki M., Ninomiya K., Ishibashi T., Yamashita H., Murakawa K., Fujimori K., Tanai H., Kimata M., Watanabe M., Hiraoka S., Chiba Y., Ishida S., Ono Y., Takiguchi S., Watanabe S., Yosida M., Hotuta T., Kusano J., Kanehori K., Takahashi-Fujii A., Hara H., Tanase T. O., Nomura Y., Togiya S., Komai F., Hara R., Takeuchi K., Arita M., Imose N., Musashino K., Yuuki H., Oshima A., Sasaki N., Aotsuka S., Yoshikawa Y., Matsunawa H., Ichihara T., Shiohata N., Sano S., Moriya S., Momiyama H., Satoh N., Takami S., Terashima Y., Suzuki O., Nakagawa S., Senoh A., Mizoguchi H., Goto Y., Shimizu F., Wakebe H., Hishigaki H., Watanabe T., Sugiyama A., Takemoto M., Kawakami B., Yamazaki M., Watanabe K., Kumagai A., Itakura S., Fukuzumi Y., Fujimori Y., Komiyama M., Tashiro H., Tanigami A., Fujiwara T., Ono T., Yamada K., Fujii Y., Ozaki K., Hirao M., Ohmori Y., Kawabata A., Hikiji T., Kobatake N., Inagaki H., Ikema Y., Okamoto S., Okitani R., Kawakami T., Noguchi S., Itoh T., Shigeta K., Senba T., Matsumura K., Nakajima Y., Mizuno T., Morinaga M., Sasaki M., Togashi T., Oyama M., Hata H., Watanabe M., Komatsu T., Mizushima-Sugano J., Satoh T., Shirai Y., Takahashi Y., Nakagawa K., Okumura K., Nagase T., Nomura N., Kikuchi H., Masuho Y., Yamashita R., Nakai K., Yada T., Nakamura Y., Ohara O., Isogai T., Sugano S. (2004) Nat. Genet. 36, 40–45 [DOI] [PubMed] [Google Scholar]
- 6. Ueda M., Ueki K., Kumagai K., Terai Y., Okamoto Y., Ueki M., Otsuki Y. (1998) Cancer Res. 58, 2343–2346 [PubMed] [Google Scholar]
- 7. Matsuura T., Kuratate I., Teramachi K., Osaki M., Fukuda Y., Ito H. (1999) Cancer Res. 59, 5037–5040 [PubMed] [Google Scholar]
- 8. Morita T., Matsuzaki A., Suzuki K., Tokue A. (2001) Curr. Pharm. Biotechnol. 2, 257–267 [DOI] [PubMed] [Google Scholar]
- 9. Ackland S. P., Peters G. J. (1999) Drug Resist. Updat. 2, 205–214 [DOI] [PubMed] [Google Scholar]
- 10. Ciccolini J., Evrard A., Cuq P. (2004) Curr. Med. Chem. Anticancer Agents 4, 71–81 [DOI] [PubMed] [Google Scholar]
- 11. Van Cutsem E., Cunningham D., Hoff P. M., Maroun J. (2001) Oncologist 6, Suppl. 4, 1–2 [DOI] [PubMed] [Google Scholar]
- 12. Lu H., Klein R. S., Schwartz E. L. (2009) Clin. Cancer Res. 15, 5136–5144 [DOI] [PMC free article] [PubMed] [Google Scholar]
- 13. de Bruin M., Peters G. J., Oerlemans R., Assaraf Y. G., Masterson A. J., Adema A. D., Dijkmans B. A., Pinedo H. M., Jansen G. (2004) Mol. Pharmacol. 66, 1054–1060 [DOI] [PubMed] [Google Scholar]
- 14. Schmid M., Jensen T. H. (2008) Chromosoma 117, 419–429 [DOI] [PubMed] [Google Scholar]
- 15. Lewis B. P., Green R. E., Brenner S. E. (2003) Proc. Natl. Acad. Sci. U.S.A. 100, 189–192 [DOI] [PMC free article] [PubMed] [Google Scholar]
- 16. Stark M., Wichman C., Avivi I., Assaraf Y. G. (2009) Blood 113, 4362–4369 [DOI] [PubMed] [Google Scholar]
- 17. Akerman M., David-Eden H., Pinter R. Y., Mandel-Gutfreund Y. (2009) Genome Biol. 10, R30. [DOI] [PMC free article] [PubMed] [Google Scholar]
- 18. Schreiber E., Matthias P., Müller M. M., Schaffner W. (1989) Nucleic Acids Res. 17, 6419. [DOI] [PMC free article] [PubMed] [Google Scholar]
- 19. Niranjanakumari S., Lasda E., Brazas R., Garcia-Blanco M. A. (2002) Methods 26, 182–190 [DOI] [PubMed] [Google Scholar]
- 20. Endo M., Shinbori N., Fukase Y., Sawada N., Ishikawa T., Ishitsuka H., Tanaka Y. (1999) Int. J. Cancer 83, 127–134 [DOI] [PubMed] [Google Scholar]
- 21. Sawada N., Ishikawa T., Fukase Y., Nishida M., Yoshikubo T., Ishitsuka H. (1998) Clin. Cancer Res. 4, 1013–1019 [PubMed] [Google Scholar]
- 22. Schwartz E. L., Baptiste N., O'Connor C. J., Wadler S., Otter B. A. (1994) Cancer Res. 54, 1472–1478 [PubMed] [Google Scholar]
- 23. Gui J. F., Lane W. S., Fu X. D. (1994) Nature 369, 678–682 [DOI] [PubMed] [Google Scholar]
- 24. Mahé D., Mähl P., Gattoni R., Fischer N., Mattei M. G., Stévenin J., Fuchs J. P. (1997) J. Biol. Chem. 272, 1827–1836 [DOI] [PubMed] [Google Scholar]
- 25. Siomi M. C., Eder P. S., Kataoka N., Wan L., Liu Q., Dreyfuss G. (1997) J. Cell Biol. 138, 1181–1192 [DOI] [PMC free article] [PubMed] [Google Scholar]
- 26. Garneau D., Revil T., Fisette J. F., Chabot B. (2005) J. Biol. Chem. 280, 22641–22650 [DOI] [PubMed] [Google Scholar]
- 27. Sanford J. R., Coutinho P., Hackett J. A., Wang X., Ranahan W., Caceres J. F. (2008) PLoS One 3, e3369. [DOI] [PMC free article] [PubMed] [Google Scholar]
- 28. Zhu J., Krainer A. R. (2000) Genes Dev. 14, 3166–3178 [DOI] [PMC free article] [PubMed] [Google Scholar]
- 29. Alkan S. A., Martincic K., Milcarek C. (2006) Biochem. J. 393, 361–371 [DOI] [PMC free article] [PubMed] [Google Scholar]
- 30. Bagga P. S., Arhin G. K., Wilusz J. (1998) Nucleic Acids Res. 26, 5343–5350 [DOI] [PMC free article] [PubMed] [Google Scholar]
- 31. Veraldi K. L., Arhin G. K., Martincic K., Chung-Ganster L. H., Wilusz J., Milcarek C. (2001) Mol. Cell. Biol. 21, 1228–1238 [DOI] [PMC free article] [PubMed] [Google Scholar]
- 32. Martinez-Contreras R., Fisette J. F., Nasim F. U., Madden R., Cordeau M., Chabot B. (2006) PLoS Biol. 4, e21. [DOI] [PMC free article] [PubMed] [Google Scholar]
- 33. Min H., Chan R. C., Black D. L. (1995) Genes Dev. 9, 2659–2671 [DOI] [PubMed] [Google Scholar]
- 34. Chou M. Y., Rooke N., Turck C. W., Black D. L. (1999) Mol. Cell. Biol. 19, 69–77 [DOI] [PMC free article] [PubMed] [Google Scholar]
- 35. Chang Y. F., Imam J. S., Wilkinson M. F. (2007) Annu. Rev. Biochem. 76, 51–74 [DOI] [PubMed] [Google Scholar]
- 36. Isken O., Maquat L. E. (2007) Genes Dev. 21, 1833–1856 [DOI] [PubMed] [Google Scholar]
- 37. Caputi M., Zahler A. M. (2001) J. Biol. Chem. 276, 43850–43859 [DOI] [PubMed] [Google Scholar]
- 38. Matunis M. J., Xing J., Dreyfuss G. (1994) Nucleic Acids Res. 22, 1059–1067 [DOI] [PMC free article] [PubMed] [Google Scholar]
- 39. Honoré B., Baandrup U., Vorum H. (2004) Exp. Cell Res. 294, 199–209 [DOI] [PubMed] [Google Scholar]
- 40. Auwerx J. (1991) Experientia 47, 22–31 [DOI] [PubMed] [Google Scholar]
- 41. Phillips R. J., Lutz M., Premack B. (2005) J. Inflamm. 2, 14–27 [DOI] [PMC free article] [PubMed] [Google Scholar]
- 42. Hass R., Giese G., Meyer G., Hartmann A., Dörk T., Köhler L., Resch K., Traub P., Goppelt-Strübe M. (1990) Eur. J. Cell Biol. 51, 265–271 [PubMed] [Google Scholar]
- 43. Hass R., Bartels H., Topley N., Hadam M., Köhler L., Goppelt-Strübe M., Resch K. (1989) Eur. J. Cell Biol. 48, 282–293 [PubMed] [Google Scholar]
- 44. de Bruin M., van Capel T., Van der Born K., Kruyt F. A., Fukushima M., Hoekman K., Pinedo H. M., Peters G. J. (2003) Br. J. Cancer 88, 957–964 [DOI] [PMC free article] [PubMed] [Google Scholar]
- 45. Corsini L., Bonnal S., Bonna S., Basquin J., Hothorn M., Scheffzek K., Valcárcel J., Sattler M. (2007) Nat. Struct. Mol. Biol. 14, 620–629 [DOI] [PubMed] [Google Scholar]
- 46. Minn A. J., Rudin C. M., Boise L. H., Thompson C. B. (1995) Blood 86, 1903–1910 [PubMed] [Google Scholar]
- 47. Gamberi C., Izaurralde E., Beisel C., Mattaj I. W. (1997) Mol. Cell. Biol. 17, 2587–2597 [DOI] [PMC free article] [PubMed] [Google Scholar]
- 48. Arhin G. K., Boots M., Bagga P. S., Milcarek C., Wilusz J. (2002) Nucleic Acids Res. 30, 1842–1850 [DOI] [PMC free article] [PubMed] [Google Scholar]
- 49. Proudfoot N. J., Furger A., Dye M. J. (2002) Cell 108, 501–512 [DOI] [PubMed] [Google Scholar]
- 50. Tian B., Pan Z., Lee J. Y. (2007) Genome Res. 17, 156–165 [DOI] [PMC free article] [PubMed] [Google Scholar]
- 51. Zhang D. (2008) Proteomics Clin. Appl. 2, 99–107 [DOI] [PubMed] [Google Scholar]
- 52. Honoré B., Vorum H., Baandrup U. (1999) FEBS Lett. 456, 274–280 [DOI] [PubMed] [Google Scholar]
- 53. Cathelin S., Rébé C., Haddaoui L., Simioni N., Verdier F., Fontenay M., Launay S., Mayeux P., Solary E. (2006) J. Biol. Chem. 281, 17779–17788 [DOI] [PubMed] [Google Scholar]
- 54. Droin N., Cathelin S., Jacquel A., Guéry L., Garrido C., Fontenay M., Hermine O., Solary E. (2008) Biochimie 90, 416–422 [DOI] [PubMed] [Google Scholar]
- 55. Besnault-Mascard L., Leprince C., Auffredou M. T., Meunier B., Bourgeade M. F., Camonis J., Lorenzo H. K., Vazquez A. (2005) Oncogene 24, 3268–3273 [DOI] [PubMed] [Google Scholar]
- 56. Sironi M., Menozzi G., Riva L., Cagliani R., Comi G. P., Bresolin N., Giorda R., Pozzoli U. (2004) Nucleic Acids Res. 32, 1783–1791 [DOI] [PMC free article] [PubMed] [Google Scholar]
- 57. Herrick G., Alberts B. (1976) J. Biol. Chem. 251, 2133–2141 [PubMed] [Google Scholar]
- 58. Herrick G., Delius H., Alberts B. (1976) J. Biol. Chem. 251, 2142–2146 [PubMed] [Google Scholar]
- 59. Lara M. C., Valentino M. L., Torres-Torronteras J., Hirano M., Martí R. (2007) Biosci. Rep. 27, 151–163 [DOI] [PubMed] [Google Scholar]
- 60. Buratti E., Baralle M., De Conti L., Baralle D., Romano M., Ayala Y. M., Baralle F. E. (2004) Nucleic Acids Res. 32, 4224–4236 [DOI] [PMC free article] [PubMed] [Google Scholar]
- 61. Krainer A. R., Conway G. C., Kozak D. (1990) Cell 62, 35–42 [DOI] [PubMed] [Google Scholar]
- 62. Wu J. Y., Maniatis T. (1993) Cell 75, 1061–1070 [DOI] [PubMed] [Google Scholar]
- 63. Jamison S. F., Pasman Z., Wang J., Will C., Lührmann R., Manley J. L., Garcia-Blanco M. A. (1995) Nucleic Acids Res. 23, 3260–3267 [DOI] [PMC free article] [PubMed] [Google Scholar]
- 64. Honoré B., Rasmussen H. H., Vorum H., Dejgaard K., Liu X., Gromov P., Madsen P., Gesser B., Tommerup N., Celis J. E. (1995) J. Biol. Chem. 270, 28780–28789 [DOI] [PubMed] [Google Scholar]
Associated Data
This section collects any data citations, data availability statements, or supplementary materials included in this article.


